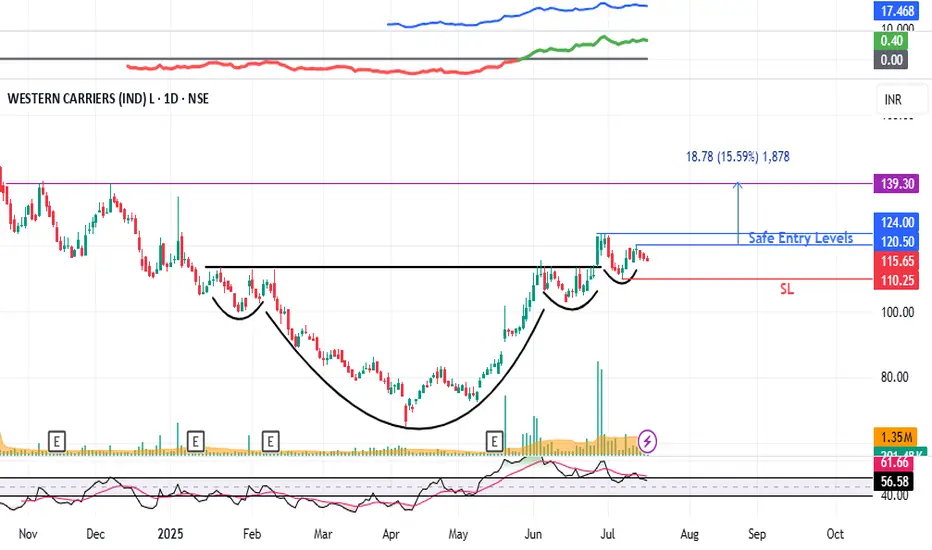
Western Carriers (WCIL) : Breakout Candidate#WCIL #patterntrading #breakout #breakoutstock #inverseheadandshoulder #swingtrading
WCIL : Swing Trade
>> Low PE Stock
>> Inverse Head & Shoulder pattern visible
>> Breakout & Retest Done
>> Ready for New Highs
>> Low Risk High Reward Trade
Swing Traders can lock profits at 10% & Keep Trailing
Pls Comment , Boost and Follow for more such Analysis
Disc : Charts shared are for Learning Purpose and not a Trade recommendation, Consult your Financial afvisor or a SEBI Registered Advisor before taking postion in it.
Breakoutandretest
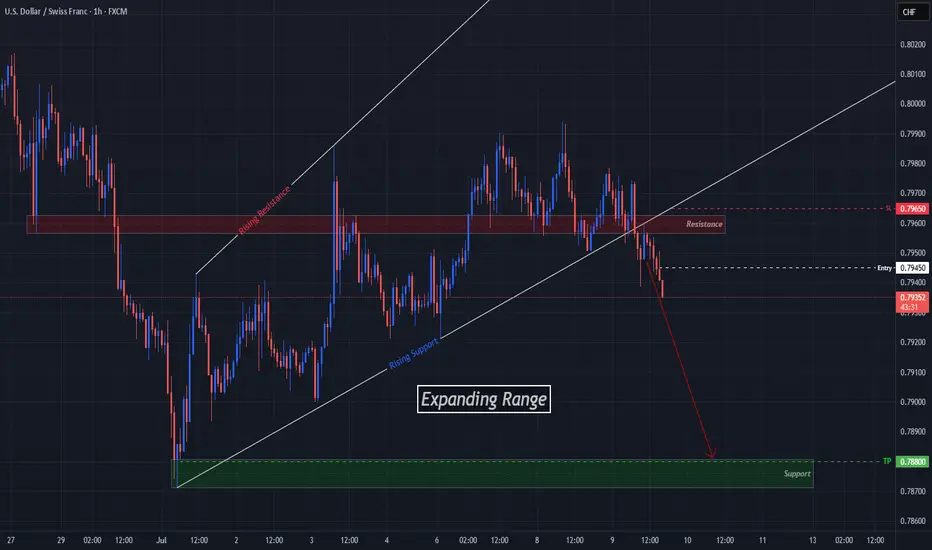
USDCHF Breaks Expansion, Aims For Next Support LevelOANDA:USDCHF has given us a Breakout of the Expanding Range it has been traveling in since the Low @ .78712 created on July 1st.
Now Price has already Retested the Breakout of the Rising Support of the Expansion and a Past Support Level, now turned Resistance @ .7960!
Hourly candles are continuing to close Lower signaling further potential to the downside!
Short Entry @ .7945
SL @ .7965 ( Above Retest of Breakout )
TP @ .7880
AUDJPY Ready To "Drop A Shoulder"? Multi-Timeframe May Help!OANDA:AUDJPY is beginning to form a very convincingly strong Reversal Pattern, the Head & Shoulders!
Starting with the Daily Chart we can see that Price is Forming a Doji Candle just after trying to Breakout of a Major Resistance Zone created from the Highs of March 18th and if Price is unable to close above this level, this strengthens the Bearish and Reversal Bias.
Now the 4 Hr Chart shows both the "First Shoulder" or Previous Higher High that was surpassed by the "Head" which is the New Higher High, has formed quite quickly with a slightly Ascending "Neckline" or Support Line where Bulls were able to make their Last Stand.
With a Reversal Pattern, you want to see a Change in Trend, in this case, would be a Lower High then that of the Higher High or "Head" @ 96.204.
*If Bulls are able to Push Price above the "Left Shoulder" or Previous Higher High @ 95.952, this will Invalidate the Head & Shoulders Set-up!
**If Bulls are unable to Break Above 95.952 and Price is pushed back down to the Confirmation or "Neckline" for a 3rd time, this Confirms the Head & Shoulders Set-up!!
Based on the Distance between the Head and Neckline, we can project a potential drop down to the next Support Level as a Price Target @ 95.00 once:
1) Pattern is Confirmed
2) Breakout is Validated

Bulls Could "Wedge" Their Way Into Higher Prices On EGOANDA:EURGBP has made some impressive moves up since the Low from May 29th and Price just fell short of the Highs of April 11th before falling into a very familiar Bullish Pattern, the Falling Wedge!
The Falling Wedge is typically a Bullish Pattern where we expect Price to give us a Bullish Break of the Falling Resistance and Successful Retest of the Break before Price heads Higher!
Wedge Patterns can play both Reversal and Continuation Patterns dependent upon the location they form and surrounding Major Support/Resistance or Highs/Lows. In this case, we will be looking for a Continuation with Price being in an Uptrend before pausing slightly for a Consolidation Phase to form the "Triangle" of the Pattern.
*It is important to note that both the Falling Resistance and Falling Support have only been tested twice where three tests of both Trendlines should point to a strong equilibrium from both Bears and Bulls, validating the legs of the Triangle and strengthening the Consolidation Bias. ( So we could see Price test the Falling Resistance one last time before falling down to the Falling Support for a 3rd test! )
Lastly, when it comes to a Wedge Pattern, we should suspect that once Price makes a 3rd Test of the Falling Support and Retraces to the 50% Fibonacci Level @ .85887, this will signal the End of the Consolidation Phase!
- And this will be the time to enter!
**Once the Pattern is Confirmed and Breakout is Validated, based on the "Flagpole" or Rally prior to Price falling into the Consolidation Phase we can anticipate Price to potentially rise to the most recent High on April 11th of .87374 and give the next Previous High on November 16th 2023 of .87657 a try!
Fundamentally, news is light this week for both currencies in the pair with GDP m/m releasing for GBP on Friday, July 11th with a Forecast of .1%, a .4% increase from June's -.3%
Also, CPI y/y for GBP will be released the following week on Wednesday, July 16th.

EURJPY Readies Triangle Breakout w/ Elliot WaveOANDA:EURJPY has formed a Triangle Pattern with a Rising Support and Resistance Zone @ 169.5 - 169.7 area.
After the False Breakout last week on Friday, we see Price falls back within the Pattern and finds strong Resistance from the zone.
Now based from the High - to Low - to Lower High where price made a 50% - 61.8% Retracement, we can plot the Trend Based-Fib Tool that suggests with the change of trend ( Price printing a Lower High ) we can expect Lower Prices to come and potentially a Bearish Breakout to the pattern!
First we will want to see where the next Lower Low will be ( currently @ 168.934 ) then wait for a Retracement to a favorable Fibonacci Level based from the Lower High to Lower Low.
Fundamentally, the EUR will have CPI Flash Estimates on Tuesday, and multiple Services PMI on Thursday with ECB President Lagarde speaking Tuesday and Wednesday. This could add volatility!!
Stay Tuned!

Could BOJ's "HOLD" on Rates Turn AUDJPY "On Its Head"?Here I have a Multi-Timeframe analysis on OANDA:AUDJPY which is giving multiple signs of Higher Prices potentially to come!!
First on the Daily we can see that Price formed a Hammer Candle after testing the March 11th Support Zone and as the next Daily candle forms (Today), we are already seeing a Bullish Confirmation candle begin!
*Bullish Engulfing would be a textbook Confirmation Candle!
Now zooming into the 4Hr / 1 Hr Charts, this Hammer is formed by what looks to be a very Strong Reversal Pattern, the Inverted Head and Shoulders!
Now we are still waiting for the Confirmation of the Pattern where Price needs to rise to the "Neckline" or Resistance Level.
Once Confirmed, we will look for a Breakout of the Pattern and if Validated, could deliver great Long Opportunities as a Breakout and Retest of the Inverted Head and Shoulders Pattern!
If the Pattern is Successful, we could expect the Price Target to be at the next level of Resistance being the 95.3 - 95.6 Area!
Fundamentally, the BOJ begins the week with Policy Rate decision Monday evening where they forecast a HOLD on Interest Rates, staying at .5%. This could have drastic implications on the JPY, potentially weakening it.

UCAD Bears Ready to Break 2 Month Long Falling Support??OANDA:USDCAD has been supported by a Falling Support Trend line since August 14th and here soon Price could potentially give us a Bearish Break to that Trend line!
Once a Breakout is validated, we could look for a Retest Set-Up for some Short Opportunities to take Price down to the Support Zone created by the August and September 2024 Lows.
An interesting fact to point out is if you observe the reaction of Price when it tests the Falling Support, we can see Price arc and the following reactions arc smaller, suggesting Bulls are losing strength on the push off of the Falling Support!
Price Action is being heavily driven by Fundamentals in the markets this week:
-USD-
ADP Non-Farm Employment - Previous 60K / Forecast 111K / Actual 37K
ISM Services PMI - Previous 51.6 / Forecast 52 / Actual 49.9
ISM Manufacturing PMI - Previous 48.7 / Forecast 49.3 / Actual 48.5
ISM Manufacturing Prices - Previous 69.8 / Forecast 70.2 / Actual 48.5
Unemployment Claims - Previous 239K / Forecast 236K / Actual 247K
*Average Hourly Earnings, Non-Farm Employment and Unemployment Rate are to be released tomorrow
-CAD-
BOC held Interest Rates @ 2.75%
Ivey PMI - Previous 47.9 / Forecast 48.3 / Actual 48.9
*Employment Change and Unemployment are to be released tomorrow
With BOC holding Interest Rates and the Federal Reserve possibly looking to cut rates because of a "softening labor market", this could fuel CAD to overcome the pair and put Bears in control to pull Prices lower!
www.tradingview.com

GU Bulls Raise "Flag" Eyeing Higher PricesFX:GBPUSD has formed a Bull Flag and we could be getting ready to see the Bulls take the spotlight!
After Price broke through the Previous Level of Structure, Price retraces the High of 1.35589 to the 50% Fibonacci Level @ 1.35022 and is supported pushing Price back up from the Previous Level of Structure.
-The 50% retracement signals the end of the Consolidation Phase of the Pattern.
Now with a Bull Flag being a Continuation Pattern, we can suspect that Price will give us a Bullish Breakout of the Descending Channel and Retest before moving higher Confirming the Pattern and once the Breakout is Validated!
Based off the "Flagpole" of the Pattern, if a Bullish Breakout is Validated and the Retest is Successful, the extension of the Set-up would place the Price Target @ 1.3640 which is at the next big level of Resistance.

Double Reject @ March Resistance Spells Good News For GJ BearsOANDA:GBPJPY struggles to reach Higher Prices then that of the High created on March 27th and leads me to believe we could see a Double Top Pattern in the making!
Confirmation of the Pattern will come when:
1) Price declines back to 191.877
&
2) Makes a Breakout of the Confirmation
Once the Pattern is Confirmed and Breakout is Validated:
- This should deliver great Short opportunities as a Double Top Breakout & Retest Set-up!

As ECB Ready's "Final Cut", EJ "Begins Reversal"OANDA:EURJPY has began to potentially form a very strong Triple Reversal Pattern, The Head and Shoulders @ the Resistance Level lasted visited May 14th.
I say "potentially" because the "Right Shoulder" or recent Lower High has been created but we still wait for the final decline to the "Neckline" or Support Area formed by the Lows separating the "Head" from the "Shoulders" or Higher High from the Lower Highs in the pattern!
Signs of Potential Head & Shoulders:
1) Left Shoulder is an Oversold High
2) A Higher High is created at a level of Resistance
3) The Head not only has the Most Volume concentrated in the Pattern, but is also the start of the RSI Divergence from Price
4) Right Shoulder is formed and unable to surpass the Left Shoulder
..Bringing us to a very important tell..
5) Volume Decreases and logs a 3rd Divergent High in the RSI @ the creation of the Right Shoulder
Now we must WAIT for CONFIRMATION of the Pattern!
This will come when Price:
1) Declines to the Neckline
&
2) Makes Successful Breakout
Once the Head & Shoulders is Confirmed and Breakout is Validated:
- This could deliver great Short opportunities as a Head and Shoulders Breakout and Retest at the Neckline being the Last Line of Defense for the Bulls if Bears can push Price through and pick up Volume!
Fundamentally, BOJ Governor Kazuo Ueda will be speaking on Tuesday, June 3rd where we could see volatility come in for JPY.
The ECB is expected to cut rates by 25 bps from 2.4% to 2.15% on Thursday, June 5th and this could be the Last Cut we see the ECB plan to make until they see downside growth risks make more cuts likely.

RENDER ANALYSIS📊 #RENDER Analysis
✅There is a formation of Falling Wedge Pattern on daily chart with a good breakout and currently retests from the major resistance zone🧐
Pattern signals potential bullish movement incoming after a breakout of major resistance zone
👀Current Price: $3.455
🚀 Target Price: $4.4-6.0
⚡️What to do ?
👀Keep an eye on #RENDER price action and volume. We can trade according to the chart and make some profits⚡️⚡️
#RENDER #Cryptocurrency #TechnicalAnalysis #DYOR

1304: Triangle Breakout and Retest1304 has shown a recent upward movement.
Price was moving within triangle.
A breakdown of triangle was observed but could not sustain. Price took an upside movement after making a double bottom (support zone).
Price is retesting the breakout of triangle.
Entry can be taken with low risk.
Manage your risk and enjoy the ride.

UNFI ANALYSIS🔮 #UNFI Analysis - Breakout 🚀🚀
💲💲 There is a breakout of Falling Wedge Pattern in #UNFI. It's a daily time frame breakout and we will see more higher price in long-term. Already a successful retest is done, we woulf see proper a rally in few days 📈📈
💸Current Price -- $2.650
📈Target Price -- $4.300
⁉️ What to do?
- We have marked crucial levels in the chart . We can trade according to the chart and make some profits. 🚀💸
#UNFI #Cryptocurrency #Breakout #DYOR

SAND ANALYSIS🔮 #SAND Analysis - Breakout 🚀🚀
💲💲 In 12hr Timeframe,Falling Wedge Breakout is Done✅
But right now we can see that #SAND is trading below its crucial resistance zone and if #SAND breaks this resistance zone then we would see a bullish move 💯🚀
💸Current Price -- $0.3365
📈Target Price -- $0.7310
⁉️ What to do?
- We have marked crucial levels in the chart . We can trade according to the chart and make some profits. 🚀💸
#SAND #Cryptocurrency #Breakout #DYOR

TAO ANALYSIS🔮 #TAO Analysis - Breakout 🚀🚀
💲💲 There is a breakout of Falling Wedge Pattern in #TAO and trying to retests the level. It's a daily time frame breakout and we will see more higher price in long-term. A successful retest is done and now we could see proper a rally 📈📈
💸Current Price -- $355.60
📈Target Price -- $722.00
⁉️ What to do?
- We have marked crucial levels in the chart . We can trade according to the chart and make some profits. 🚀💸
#TAO #Cryptocurrency #Breakout #DYOR

ETHFI ANALYSIS🔮 #ETHFI Analysis - Breakout 🚀🚀
💲💲 There is a breakout of Falling Wedge Pattern in #ETHFI and perfectly retests the level. It's a 12hr time frame breakout and we will see more higher price in long-term.
💸Current Price -- $4.406
📈Target Price -- $8.092
⁉️ What to do?
- We have marked crucial levels in the chart . We can trade according to the chart and make some profits. 🚀💸
#ETHFI #Cryptocurrency #Breakout #DYOR

NEAR ANALYSIS🔮 #NEAR Analysis 💰💰
📊#NEAR is making perfect and huge rounding bottom pattern in weekly time frame, also we can see that there is a good retest in #NEAR indicating a potential bullish move. If #NEAR breakout the pattern with high volume then we will get a bullish move📈
🔖 Current Price: $7.029
⏳ Target Price: $11.811
⁉️ What to do?
- We have marked crucial levels in the chart . We can trade according to the chart and make some profits. 🚀💸
#NEAR #Cryptocurrency #Pump #DYOR

EOS ANALYSIS🔮 #EOS Analysis - Breakout 🚀🚀
💲💲 There is a breakout of Falling Wedge Pattern in #EOS and perfectly retests the level. It's a weekly time frame breakout and we will see more higher price in long-term.
💸Current Price -- $0.8514
📈Target Price -- 1.8200
⁉️ What to do?
- We have marked crucial levels in the chart . We can trade according to the chart and make some profits. 🚀💸
#EOS #Cryptocurrency #Breakout #DYOR

PEPE ANALYSIS🔮 PEPE Analysis - Breakout Trading 💰💰
🌟🚀 #PEPE was trading in a Bullish Flag Pattern in daily time frame and breakout the pattern. We can expect a long rally as a retest has been done already #PEPE.💲💲
🔖 Current Price: $0.00000785
⏳ Target Price: $0.00001081
⁉️ What to do?
- We have marked crucial levels in the chart . We can trade according to the chart and make some profits. 🚀💸
#PEPE #Cryptocurrency #Breakout #DYOR

QNT ANALYSIS🔮 #QNT Analysis - Breakout Trading 💰💰
🌟🚀 #QNT was trading in a Ascending Triangle Pattern and here we can see that #QNT gave a great breakout with high volume and currently retesting the levels in 8hr chart pattern. We can expect a long rally in #QNT.💲💲
🔖 Current Price: $109.4
⏳️ Target Price: $134.9
⁉️ What to do?
- We have marked crucial levels in the chart . We can trade according to the chart and make some profits. 🚀
#QNT #Cryptocurrency #Breakout #DYOR

SHIB ANALYSIS🚀#SHIB Analysis : Breakout and Retest
🔮#SHIB has broken out of a symmetrical triangle pattern in 6-hour timeframe
The breakout of the symmetrical triangle pattern suggests a potential bullish move📈
Expect a bullish wave of around 40% in the coming weeks🐳
🔰Current Price: $0.00002771
🎯 Target Price: $0.00004388
⚡️What to do ?
👀Keep an eye on #SHIB price action. We can trade according to the chart and make some profits⚡️⚡️
#SHIB #Cryptocurrency #TechnicalAnalysis #DYOR

ARPA ANALYSIS🚀#ARPA Analysis : Breakout and Retest
🔮As we can see in the chart of #ARPA that there is a formation symmetrical triangle pattern. Also there is a perfect breakout and retest of the levels. This indicates a potential bullish move.📈📈
🔰Current Price: $0.10070
🎯 Target Price: $0.14580
⚡️What to do ?
👀Keep an eye on #ARPA price action. We can trade according to the chart and make some profits⚡️⚡️
#ARPA #Cryptocurrency #TechnicalAnalysis #DYOR

ALGO ANALYSIS🚀#ALGO Analysis : Pattern Formation
🔮As we can see in the chart of #ALGO that there is a formation Inverse Head And Shoulder Pattern and it's a bullish pattern. Also there is a perfect breakout and retest of the levels. This indicates a potential bullish move.📈📈
🔰Current Price: $0.2353
🎯 Target Price: $0.3871
⚡️What to do ?
👀Keep an eye on #ALGO price action. We can trade according to the chart and make some profits⚡️⚡️
#ALGO #Cryptocurrency #TechnicalAnalysis #DYOR
