EURGBP Descending Triangle Pattern Breakout LongWe expect a reversal to the upside on this pair, signalled by the descending triangle pattern breakout and counter-trendline breakout. We can also see the breakout of a key level which further supports our directional basis.
Breakoutbar

Stock at break up level This stock
When it sustain 390 level above it will touch life time High level so participate in rally by adding small small portion
My Target 500+
No recommendation for buy and sell
Take own analysis or SEBI registration advice
No responsibility from my side for profit or loss
I'm not recommending to participate in rally just education purpose

IFCI Breakout trade set up1. Trend - Turned bullish with this week breakout
2. Breakout - Strong
3. Strength - Very strong with 37% move in a week
4. Entry is volatile, if price come for a retest.
5. Keep in radar if on daily a fresh breakout comes, after a range formation of 7 days to 10 days minimum.


Life time High fundamental Let's begin analysis
Today stock SHALBY Ltd
•This stock was listed in DECEMBER 2017 but stock at 210 level work for that time as support but 2018 March this support break down 40 level it's 400+% down from High level.
•after 400% down stock trying hit and breakout 210 level in August 2021 but it work as resistance.
•stock come upto 100 leve from resistance level of 210, from 100 level stock creating higher high and High low formation.
•Now stock break resistance of 210 with High valume, the valumes are given idea about accumulation of the stock.
•keeping 185 as Stop loss get chance 280+, stock life time High also 270
•risk reward ratio 1:2
no recommendation for but and sell

DOTUSDT Time to breakout?DOTUSDT is currently in an accumulation phase, as the market is consolidating below the key level of $7 on a weekly basis. During this phase, the price has been printing Higher Highs and Higher Lows, which indicates that buyers have been gradually gaining strength over sellers.
An accumulation phase is typically characterized by a period of sideways movement in the price, as buyers and sellers work to establish a new equilibrium. This can often take place after a prolonged downtrend, when investors are looking for a bottom in the market.
In the case of DOTUSDT, the accumulation phase is occurring below the important $7 level, which is a critical area of support and resistance. This level has held as a strong barrier to upside movement in the past, and as such, any potential breakout above it could signal a significant shift in market sentiment.
As we wait for a new breakout, it's important to keep an eye on Plancton's rules, which are a set of guidelines for identifying potential market movements. If and when a new breakout occurs, we can apply these rules to help guide our decision-making and potentially open a new long position.
–––––
Follow the Shrimp 🦐
Keep in mind.
🟣 Purple structure -> Monthly structure.
🔴 Red structure -> Weekly structure.
🔵 Blue structure -> Daily structure.
🟡 Yellow structure -> 4h structure.
⚫️ Black structure -> <= 1h structure.
Follow the Shrimp 🦐

Best Buy Co. a best buy ⁉Placed my buy order in this stock. As you've seen the price has broken the consolidation rectangle to the upside. So let's see how this plays out ...

MKRUSDT is loading a breakout?MKRUSDT recently experienced a false breakout from the daily resistance level, which is a key level that often represents a point of strong supply and demand. When the price breaks through this level, it can indicate a significant shift in market sentiment and a potential change in trend direction.
However, in this case, the breakout turned out to be false and the price is currently inside a descending channel. The market will need to create a new breakout from the static resistance level at around $760 for any long continuation to occur. This level is another key area of support and resistance and is a crucial level to monitor as it can indicate the direction of future price movement.
If the price breaks above this resistance level, we can apply Plancton's Strategies, a set of guidelines for identifying potential market movements, to help guide our decision-making and potentially open a new long position.
According to Plancton's strategy , we can set a nice order
–––––
Keep in mind.
🟣 Purple structure -> Monthly structure.
🔴 Red structure -> Weekly structure.
🔵 Blue structure -> Daily structure.
🟡 Yellow structure -> 4h structure.
⚫️ black structure -> <= 1h structure.
–––––
Follow the Shrimp 🦐

💥 3 Types of BreakoutIn trading, the term "breakout" refers to a price movement that "breaks" past a certain level or range. It's important to note that breakouts can be false, meaning the price could reverse its movement after the breakout. Hence, traders often use confirmation techniques to confirm the validity of a breakout.
A breakout is a potential trading opportunity that occurs when an asset's price moves above a resistance level or moves below a support level on increasing volume. The first step in trading breakouts is to identify current price trend patterns along with support and resistance levels in order to plan possible entry and exit points. Once you've acted on a breakout strategy, know when to cut your losses and re-assess the situation if the breakout sputters. As with any technical trading strategy, don't let emotions get the better of you. Stick with your plan and know when to get in and get out.
📈3 Key things to know about Breakouts📉
📍A breakout in the stock market refers to a situation where the price of a security moves beyond a pre-defined support or resistance level, accompanied by an increase in trading volume. Traders often take advantage of breakouts by entering a long position when the price surpasses resistance or a short position when it falls below support. This movement beyond a price barrier often leads to increased volatility and a trend in the direction of the breakout.
📍Breakouts are highly valued as a trading strategy because they can signal the beginning of heightened volatility, substantial price movements, and major trends. This phenomenon can occur in various market conditions and is particularly noticeable in the case of channel breakouts and price pattern breakouts, such as triangles, flags, or head and shoulders patterns. As volatility contracts during these periods, it typically expands once the prices move beyond the established range.
📍Breakout trading can be applied to various trading styles and timeframes, including intraday, daily, or weekly charts, making it a versatile strategy for day trading, swing trading, or any other approach.
🔹 Trend Line Breakout: This occurs when the price breaks past a trend line that has been connecting a series of lows or highs.
🔹 Support and Resistance Breakout: This occurs when the price breaks past a significant level of support or resistance.
🔹 Flag and Pennant Breakout: This occurs when the price breaks past a flag or pennant pattern, which is a short-term consolidation pattern.
🔹 Rectangle Breakout: This occurs when the price breaks past a rectangular price pattern, which is a pattern of price congestion.
🔹 Volume Breakout: This occurs when the volume of trades surpasses a significant level, indicating a potential change in trend.
It's important to note that breakouts can be false, meaning the price could reverse its movement after the breakout. Hence, traders often use confirmation techniques to confirm the validity of a breakout.
👤 @AlgoBuddy
📅 Daily Ideas about market update, psychology & indicators
❤️ If you appreciate our work, please like, comment and follow ❤️

DOTUSDT is creating a falling wedgeAfter an amazing profit, the price is testing the monthly support on 6.7$
on the 4h timeframe the market creates the falling wedge below the 4h resistance.
How to approach it?
IF the price is going to have a breakout from the falling wedge and daily resistance on 8$, According to Plancton's strategy , we can set a nice order
–––––
Keep in mind.
🟣 Purple structure -> Monthly structure.
🔴 Red structure -> Weekly structure.
🔵 Blue structure -> Daily structure.
🟡 Yellow structure -> 4h structure.
–––––
Follow the Shrimp 🦐

Waiting for confirmation...US30 - Waiting to see what price does, currently in a PRZ but looking like it's going to break that level and head up to the next supply zone, SPX looking bullish too (Failed to break the previous low), let's see, waiting for confirmations, ideally looking for sells today after the HTF BOS yesterday, if price breaks down and we get failed lows/breaks up rejects from current supply i'll be looking for buys too.
Let me know your thoughts!
* Disclaimer **
These ideas I never trade until the end target with my initial lots, I focused on high probable entries with higher lots and use a specific partial taking strategy giving me a very high win rate and take most of my profits very early, I only leave a small % of my capital to run the entire trade. On the flip side im constantly monitoring LTF momentum and will close early if things change, these analysis's are for research purposes only.

EGLDUSDT ready to explode? 💣The price created a triple bottom on the daily support on 159% as you can see on the upper chart.
On the 4h timeframe the price bounced exactly on the 0.886 Fibonacci level and dynamic support. The price got liquidity and had a breakout from the descending Channel. Now the price is testing the weekly resistance as new support
How to approach?
The price needs to have a breakout form the 170$ with Volumes and Momentum, According to Plancton's strategy , we can set a nice order
–––––
Keep in mind.
🟣 Purple structure -> Monthly structure.
🔴 Red structure -> Weekly structure.
🔵 Blue structure -> Daily structure.
🟡 Yellow structure -> 4h structure.
–––––
Follow the Shrimp 🦐

SOBHA - Clear swing trade entry🔴DISCLAIMER
***** It's just for an educational purpose and so you must also follow your own technical analysis before taking up the trade ******
Aggressive traders enter at the breakout and conservative traders may give entry after retracement (Retracement is optional, we cannot expect every stock to take a retest after the breakout, it may also continue to have its bullish pressure after the breakout)
After reaching our targets, trail your stop loss to get maximum profit from the stock in a single trade

Goodluck India Educational Idea
Looking good
Buying zone and SL given in chart with cup and handle pattern

TPX breakoutTPX made a base over base and broke out!
Fundamentally, it's earnings and sales have been growing more than 30% quarter over quarter and is expected to continue growing.
Technically, it's been in a range since March 2021. After the earnings report in July it broke out of the range and started consolidating above the previous range creating a base over base pattern. A break out of such a pattern can prove to be very powerful.
Trading idea:
* A pull back to retest the $44.50 area is likely so look for buying opportunities there.
* If you want to get in regardless of a discount now would be a great time to get in and ride the wave!

XPO broke out of months long consolidationXPO broke out of consolidation that dates back to June of 2021 and is making new all time highs.
It's a good company that moves with the general market and is expected to do even better in the coming year.
It recently broke the resistance range between $88 and $89.30 and has retested the upper bound as support.
The next measured objective is $99.40 to $100.

YFIUSDT is testing the weekly support 🦐YFIUSDT is testing the weekly support and now is trying to have a breakout from the descending channel. IF the price will have a breakout, According to Plancton's strategy (check our Academy ), we can set a nice order
–––––
Follow the Shrimp 🦐
Keep in mind.
🟣 Purple structure -> Monthly structure.
🔴 Red structure -> Weekly structure.
🔵 Blue structure -> Daily structure.
🟡 Yellow structure -> 4h structure.
⚫️ Black structure -> <4h structure.

IOTXUSDT bounced on weekly support 🦐IOTXUSDT bounced on weekly support and the price created a W.
At the moment the price is testing the daily resistance.
IF the price will have a breakout from it, and flip the current resistance into new support, According to Plancton's strategy (check our Academy), we can set a nice order
–––––
Follow the Shrimp 🦐
Keep in mind.
🟣 Purple structure -> Monthly structure.
🔴 Red structure -> Weekly structure.
🔵 Blue structure -> Daily structure.
🟡 Yellow structure -> 4h structure.
⚫️ Black structure -> <4h structure.
Here is the Plancton0618 technical analysis, please comment below if you have any question.
The ENTRY in the market will be taken only if the condition of the Plancton0618 strategy will trigger.

BCHUSDT is testing the 4h resistance 🦐BCHUSDT is testing the 4h resistance inside an ascending channel.
IF the price will have a breakout upward, we could apply our strategies in order to open a new long position, otherwise, if the price will lose the weekly support, We can see a new bearish scenario.
According to Plancton's strategy (check our Academy), we can set a nice order
–––––
Follow the Shrimp 🦐
Keep in mind.
🟣 Purple structure -> Monthly structure.
🔴 Red structure -> Weekly structure.
🔵 Blue structure -> Daily structure.
🟡 Yellow structure -> 4h structure.
⚫️ Black structure -> <4h structure.
Here is the Plancton0618 technical analysis, please comment below if you have any question.
The ENTRY in the market will be taken only if the condition of the Plancton0618 strategy will trigger.

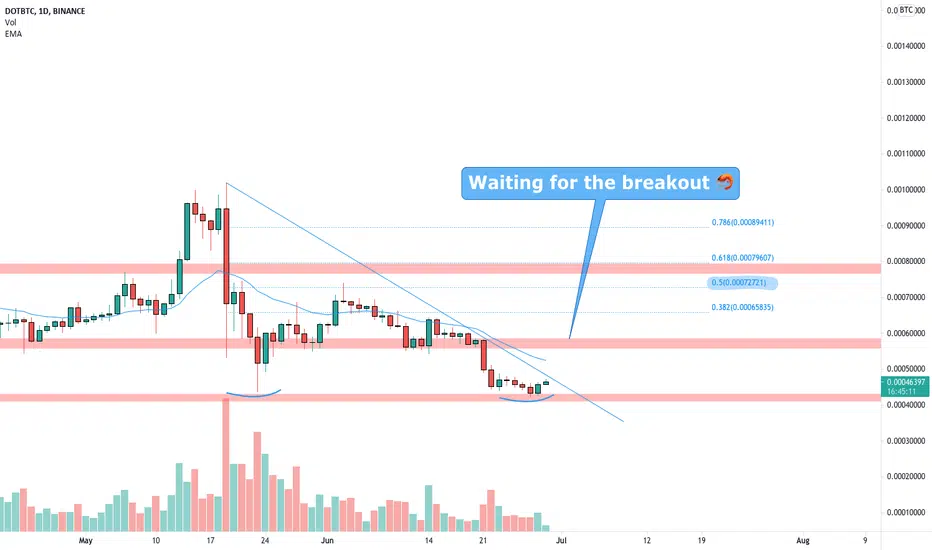
DOTBTC is testing the weekly support 🦐DOTBTC is testing the weekly support after the price bounced on 0.5 Fibonacci level.
IF the price will hold that level and have a breakout from weekly resistance, According to Plancton's strategy (check our Academy), we can set a nice order
–––––
Follow the Shrimp 🦐
Keep in mind.
🟣 Purple structure -> Monthly structure.
🔴 Red structure -> Weekly structure.
🔵 Blue structure -> Daily structure.
🟡 Yellow structure -> 4h structure.
⚫️ Black structure -> <4h structure.
Here is the Plancton0618 technical analysis, please comment below if you have any question.
The ENTRY in the market will be taken only if the condition of the Plancton0618 strategy will trigger.
KAVAUSDT is testing the weekly resistance 🦐KAVAUSDT is testing the weekly resistance after the price retested the 0.618 Fibonacci level during the retest.
IF and ONLY IF the price will have a breakout from the weekly resistance, and confirm the breakout with a retest, According to Plancton's strategy (check our Academy), we can set a nice order
–––––
Follow the Shrimp 🦐
Keep in mind.
🟣 Purple structure -> Monthly structure.
🔴 Red structure -> Weekly structure.
🔵 Blue structure -> Daily structure.
🟡 Yellow structure -> 4h structure.
⚫️ Black structure -> <4h structure.
Here is the Plancton0618 technical analysis, please comment below if you have any question.
The ENTRY in the market will be taken only if the condition of the Plancton0618 strategy will trigger.

DOTUSDT is testing the bearish flag 🦐DOTUSDT is testing the bearish flag above the daily support. IF and only IF the price will have a breakout from daily support and retest it as new resistance, According to Plancton's strategy (check our Academy), we can set a nice order
–––––
Follow the Shrimp 🦐
Keep in mind.
🟣 Purple structure -> Monthly structure.
🔴 Red structure -> Weekly structure.
🔵 Blue structure -> Daily structure.
🟡 Yellow structure -> 4h structure.
⚫️ Black structure -> <4h structure.
Here is the Plancton0618 technical analysis, please comment below if you have any question.
The ENTRY in the market will be taken only if the condition of the Plancton0618 strategy will trigger.

BTCUSDT could retest 40k 🦐The price created a nice double bottom on the weekly support as expected ( CHECK MY IDEA ).
After the breakout from 4h trendline, the price is testing the daily resistance.
IF the price will have a breakout from it, and turn the current resistance into new support, According to Plancton's strategy (check our Academy), we can set a nice order
–––––
Follow the Shrimp 🦐
Keep in mind.
🟣 Purple structure -> Monthly structure.
🔴 Red structure -> Weekly structure.
🔵 Blue structure -> Daily structure.
🟡 Yellow structure -> 4h structure.
⚫️ Black structure -> <4h structure.
Here is the Plancton0618 technical analysis, please comment below if you have any question.
The ENTRY in the market will be taken only if the condition of the Plancton0618 strategy will trigger.
