XRPUSDT at least +100$ pumpXRPUSDT really has a high potential and soon we can expect a heavy pump here to the targets like 1$ and even more.
also in the long-term we can expect a breakout of major resistances like 2$ and more pump after that.
DISCLAIMER: ((trade based on your own decision))
<>
Breakouts

BTCUSDTCover BTCUSDT at 28325.570
Percent change from entry price is: 2.73%
Lets move on to next Good trade!

SQ - Rising Trend [MIDTERM]- SQ is in a rising trend channel in the medium long term.
- SQ is moving within a rectangle formation between support at 44 and resistance at 90.
- A decisive break through one of these levels indicates the new direction for the stock.
- The price has reacted back after the break of the double bottom formation.
- There is support around 71.5, which now indicates good buying opportunities.
- An established break through this support will neutralize the positive signal.
- SQ has marginally broken up through resistance at 71.5.
- SQ is overall assessed as technically positive for the medium long term.


Set up forming?- NASDAQ LongPrice trending down to find support at 12264.2 level before a bull run up. About 700 points are to be made.

buy signal base on unfilled order levels hi there 👋
in hear we have a strong supply levels which price has pushed through it.
base on RRR and risk management it can be a good position.
if you agree with me follow 4 more.

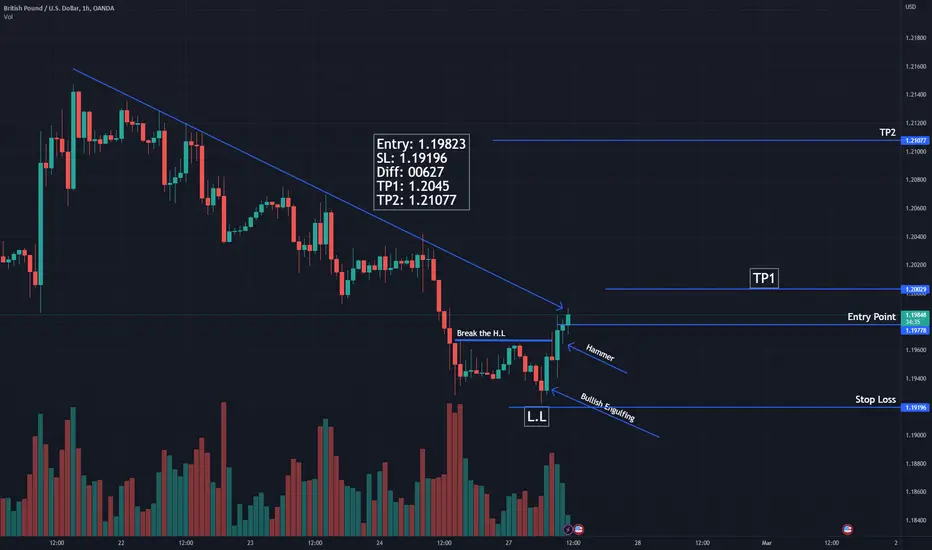
GBPUSD Bullish Trend Start in 1 HR TF.OANDA:GBPUSD On this chart, the first candle is a Bullish Engulfing Candle, and the second candle is a Hammer Candle. Mean buyers dominate the market at this time. GBP IUSD Break of previous Higher Low
DOTUSDT Time to breakout?DOTUSDT is currently in an accumulation phase, as the market is consolidating below the key level of $7 on a weekly basis. During this phase, the price has been printing Higher Highs and Higher Lows, which indicates that buyers have been gradually gaining strength over sellers.
An accumulation phase is typically characterized by a period of sideways movement in the price, as buyers and sellers work to establish a new equilibrium. This can often take place after a prolonged downtrend, when investors are looking for a bottom in the market.
In the case of DOTUSDT, the accumulation phase is occurring below the important $7 level, which is a critical area of support and resistance. This level has held as a strong barrier to upside movement in the past, and as such, any potential breakout above it could signal a significant shift in market sentiment.
As we wait for a new breakout, it's important to keep an eye on Plancton's rules, which are a set of guidelines for identifying potential market movements. If and when a new breakout occurs, we can apply these rules to help guide our decision-making and potentially open a new long position.
–––––
Follow the Shrimp 🦐
Keep in mind.
🟣 Purple structure -> Monthly structure.
🔴 Red structure -> Weekly structure.
🔵 Blue structure -> Daily structure.
🟡 Yellow structure -> 4h structure.
⚫️ Black structure -> <= 1h structure.
Follow the Shrimp 🦐

Learn False Breakout in Trading | Technical Analysis Basics
⭕️False-breakouts are exactly what they sound like: a breakout that failed to continue beyond a level, resulting in a ‘false’ breakout of that level. False breakout patterns are one of the most important price action trading patterns to learn, because a false-break is often a very strong clue that price might be changing direction or that a trend might be resuming soon.
⭕️A false-break of a level can be thought of as a ‘deception’ by the market, because it looks like price will breakout but then it quickly reverses, deceiving all those who took the ‘bait’ of the breakout. It’s often the case that amateurs will enter what looks like an ‘obvious’ breakout and then the professional’s will push the market back the other way
⭕️A false breakout is essentially a ‘contrarian’ move in the market that ‘flushes’ out those traders who may have entered on emotion, rather than logic and forward thinking.
⭕️Generally speaking, a false-breakout happens because amateur traders or those with ‘weak hands’ in the market will tend to enter the market only when it ‘feels safe’ to do so. This means, they tend to enter when a market is already quite extended in one direction (and it’s about ready to retrace) or they try to ‘predict’ a breakout from a key support or resistance level too early. Professional traders watch for these missteps by the amateurs, and the end result is a very good entry for them with a tight stop loss and huge risk reward potential.
⭕️It takes discipline and a bit of ‘gut feel’ to know when a false-break is likely to occur, and you can never really know ‘for sure’ until after one has formed. The important thing, is to know what they look like and how to trade them.
Like, comment and subscribe to boost your trading!
Hey traders, let me know what subject do you want to dive in in the next post?

GALAUSDT is ready for the breakout?The current price of GALAUSDT is testing a dynamic resistance level in the $0.05 area where the market also has a static daily resistance level. Additionally, the price is creating an inverse head and shoulders pattern, which is a technical chart pattern that may indicate a potential trend reversal from a downtrend to an uptrend.
An inverse head and shoulders pattern consists of three distinct troughs or valleys with the middle trough being the lowest, forming the "head," and the two outer troughs forming the "shoulders." The middle trough or the "head" is typically lower than the shoulders, and the pattern is completed when the price breaks above the "neckline," which is a trend line drawn connecting the high points between the shoulders.
If the price of GALAUSDT is able to break out from the neckline of the inverse head and shoulders pattern and the market satisfies Plancton’s rules, it may be a signal for a long position. To satisfy Plancton’s rules, a trader may have a predetermined entry price, set stop loss and take profit levels to manage risk and maximize profits, and monitor the price action for any signs of a trend reversal or invalidation of the initial analysis.
–––––
Keep in mind.
🟣 Purple structure -> Monthly structure.
🔴 Red structure -> Weekly structure.
🔵 Blue structure -> Daily structure.
🟡 Yellow structure -> 4h structure.
⚫️ black structure -> <= 1h structure.
–––––
Follow the Shrimp 🦐

OGNUSDT wants the breakout?The price of OGNUSDT is currently attempting to create a breakout from a supply area, which is a price range where sellers are more likely to enter the market and sell their assets, causing downward pressure on the price.
During its attempts to break out, the price of OGNUSDT has bounced several times on a dynamic support level, which is a price level that moves with the price action over time. This support level has provided a base for the price to rebound and gain new liquidity from a demand zone, which is a price range where buyers are more likely to enter the market and purchase assets, causing upward pressure on the price.
As traders, we are now waiting for the price to successfully break out from the supply area and apply Plancton’s rules for a long position, which may include buying OGNUSDT at a predetermined entry price, setting stop loss and take profit levels to manage risk and maximize profits, and monitoring the price action for any signs of a trend reversal or invalidation of our initial analysis. By following these rules, we aim to increase our chances of profiting from the potential uptrend in the price of OGNUSDT.
–––––
Follow the Shrimp 🦐
Keep in mind.
🟣 Purple structure -> Monthly structure.
🔴 Red structure -> Weekly structure.
🔵 Blue structure -> Daily structure.
🟡 Yellow structure -> 4h structure.
⚫️ Black structure -> <= 1h structure.
Follow the Shrimp 🦐

$SOL - Beast ready to Hunt ShortersHello my Fellow TraderZ,
Two days back I posted the potential breakout of #Solana which has happened already and price has showed a significant move.
Just look at the VOLUME + Breakout Candle on 4 HTF - Fabolous.
For now I'm Targeting $30. Incase that is broken be ready for the LONG party.
Follow me for the alpha analysis coming shortly.
CHEERS!!! FAM.

MKRUSDT is loading a breakout?MKRUSDT recently experienced a false breakout from the daily resistance level, which is a key level that often represents a point of strong supply and demand. When the price breaks through this level, it can indicate a significant shift in market sentiment and a potential change in trend direction.
However, in this case, the breakout turned out to be false and the price is currently inside a descending channel. The market will need to create a new breakout from the static resistance level at around $760 for any long continuation to occur. This level is another key area of support and resistance and is a crucial level to monitor as it can indicate the direction of future price movement.
If the price breaks above this resistance level, we can apply Plancton's Strategies, a set of guidelines for identifying potential market movements, to help guide our decision-making and potentially open a new long position.
According to Plancton's strategy , we can set a nice order
–––––
Keep in mind.
🟣 Purple structure -> Monthly structure.
🔴 Red structure -> Weekly structure.
🔵 Blue structure -> Daily structure.
🟡 Yellow structure -> 4h structure.
⚫️ black structure -> <= 1h structure.
–––––
Follow the Shrimp 🦐

Eur/UsdHello traders! In my opinion, in medium term this pair is sell.
Target:
Buy 1.0880 (sell confirmation)
Sell 1.0160
Be careful and wait for a confirmation!
Don`t forget to look at the economic calendar!
MAKE MONEY AND ENJOY LIFE 💰
THANK YOU!
GOOD LUCK!
🙏🏻🙏🏻🙏🏻

💥 3 Types of BreakoutIn trading, the term "breakout" refers to a price movement that "breaks" past a certain level or range. It's important to note that breakouts can be false, meaning the price could reverse its movement after the breakout. Hence, traders often use confirmation techniques to confirm the validity of a breakout.
A breakout is a potential trading opportunity that occurs when an asset's price moves above a resistance level or moves below a support level on increasing volume. The first step in trading breakouts is to identify current price trend patterns along with support and resistance levels in order to plan possible entry and exit points. Once you've acted on a breakout strategy, know when to cut your losses and re-assess the situation if the breakout sputters. As with any technical trading strategy, don't let emotions get the better of you. Stick with your plan and know when to get in and get out.
📈3 Key things to know about Breakouts📉
📍A breakout in the stock market refers to a situation where the price of a security moves beyond a pre-defined support or resistance level, accompanied by an increase in trading volume. Traders often take advantage of breakouts by entering a long position when the price surpasses resistance or a short position when it falls below support. This movement beyond a price barrier often leads to increased volatility and a trend in the direction of the breakout.
📍Breakouts are highly valued as a trading strategy because they can signal the beginning of heightened volatility, substantial price movements, and major trends. This phenomenon can occur in various market conditions and is particularly noticeable in the case of channel breakouts and price pattern breakouts, such as triangles, flags, or head and shoulders patterns. As volatility contracts during these periods, it typically expands once the prices move beyond the established range.
📍Breakout trading can be applied to various trading styles and timeframes, including intraday, daily, or weekly charts, making it a versatile strategy for day trading, swing trading, or any other approach.
🔹 Trend Line Breakout: This occurs when the price breaks past a trend line that has been connecting a series of lows or highs.
🔹 Support and Resistance Breakout: This occurs when the price breaks past a significant level of support or resistance.
🔹 Flag and Pennant Breakout: This occurs when the price breaks past a flag or pennant pattern, which is a short-term consolidation pattern.
🔹 Rectangle Breakout: This occurs when the price breaks past a rectangular price pattern, which is a pattern of price congestion.
🔹 Volume Breakout: This occurs when the volume of trades surpasses a significant level, indicating a potential change in trend.
It's important to note that breakouts can be false, meaning the price could reverse its movement after the breakout. Hence, traders often use confirmation techniques to confirm the validity of a breakout.
👤 @AlgoBuddy
📅 Daily Ideas about market update, psychology & indicators
❤️ If you appreciate our work, please like, comment and follow ❤️

Consolidation Breakout: Impulse and Continuation Consolidations are range bound.
The rules for a breakout (impulse) is to retrace it to confirm the exit, and then strike the low signaling the continuation...the beginning of a trend.
Notice the red arrow.
The impulse exited a range of a trending zone, but the retrace failed and there wasn't a continuation.
That is why to wait to strike bullish reversal....

Most Misguided PatternsHello Traders!
Welcome back to another trade with Analyst Aadil1000x.
Today I am posting some education posts which I found necessary to post and share with the public.
Have you ever wondered if you figured out a pattern perfectly and try to trade it and you lost and then you wait for the same pattern to reappear and try to trade that pattern in a more perfect manner and you still lose? The reason is you have been taught wrong. Nearly 100% of the patterns that are roaming on the internet are wrong and it will lead to a loss.
I have posted some patterns to make money easily. Trading is a game of probability and if you trade my way then the win probability will be higher than 70% and if you follow the traditional way then I am sure your probability will not be more than 30%.
Don't forget to hit the like button and follow to stay connected

CAD JPY CONSOLIDATION BREAKOUT TO SUPPORTThis video shows the short position that I am now in on the CAD JPY, as I trade the bearish movement now taking place. It is part of the larger 4 Hour Consolidation Setup being formed.
Entry took place on the 1 Hour Chart with the break of the Consolidation Channel that is expected to take us to the Support of the Consolidation Channel on the 4 Hour Chart.

❌ False Breakout PatternsA breakout that failed to proceed past a level, leading to a "false" breakout of that level, is referred to as a "false breakout."
One of the most essential price action trading patterns to learn is the false double bottom and double top patterns,
as a false-break is frequently a very strong indicator that price may be changing direction or that a trend may soon resume.
False breakouts occur in all market scenarios, including trending, consolidating, and counter-trending.
Trading Tips To Respect:
✅False breakouts can happen in markets that are trending, range-bound, or going against the trend.
Watch for them in all market conditions since they frequently provide insightful hints about the direction the market will take.
✅Trading against a trend can be challenging, but one of the "best" approaches is to watch for a clear false breakout signal
from a significant support or resistance level, as in the last example above.
✅False breakouts provide us with a "window" into the "fight" between expert and amateur traders, allowing us to engage in trading alongside them.
Trading will appear to you in a different light if you can learn to recognize and trade false breakout patterns.
👤 @AlgoBuddy
📅 Daily Ideas about market update, psychology & indicators
❤️ If you appreciate our work , Please like, comment and follow ❤️


JBMA - Long viewThe price has broken out from its consolidation area and has now picked up an upward movement.
One can buy JBMA above 504 for a price target of 554 with a stop loss of 478
The views presented are of the author and is for educational purpose only.
Kindly consult your financial advisor before investing.

Breakout in Fertilizer and chemical After a soo long tym a good breakout has-been come in fertilizer and chemical which look like bullish.
Buy it above 155
Target 165.30 174.5 180 200
Sl 141
