Price Trap (USD/JPY) IDEA......Wait for break AND retest on the 1 hour TF
enter 15 min TF
CONFIRMATIONS OF 2 BULLISH or 2 BEARISH candles DEPENDING ON BREAK OF ZONE (FLOOR OR CEILING)
25 Pips TP
25 Pips SL
1;1 RISK/REWARD
EXAMPLE
0.01 per every £100 in account
0.02 = £200
0.03 = £300
0.04 = £400
0.10 = £1000
Breakouts

LTCUSDT: Targeting Confluence Resistance at 57.00?Strong moves off of an inverted H&S pattern and perhaps about to test resistance levels, a key one of which is 57.00 (IMO).
Here's the weekly chart for reference:

Fractal breakouts on MES 5 min chartTutorial on how to play fractal level breakouts using custom indicator.

TSLA Working On An Inside Week, About to BreakoutIt's early but TSLA is winding tight here getting ready for a bigger move. When it breaks above 450 it can run to 500+. Patience is key but when it breaks it'll run.

LTCUSDT breakout 4h hour below weekly resistanceLTCUSDT breakout 4h hour below weekly resistance.
The price must gain bullish momentum in order to have breakout towards up.
According to Plancton's strategy, we can set a nice order
–––––
Follow the Shrimp 🦐
Keep in mind.
🟣 Purple structure -> Monthly structure.
🔴 Red structure -> Weekly structure.
🔵 Blue structure -> Daily structure.
🟡 Yellow structure -> 4h structure.
Here is the Plancton0618 technical analysis, please comment below if you have any question.
The ENTRY in the market will be taken only if the condition of Plancton0618 strategy will trigger.

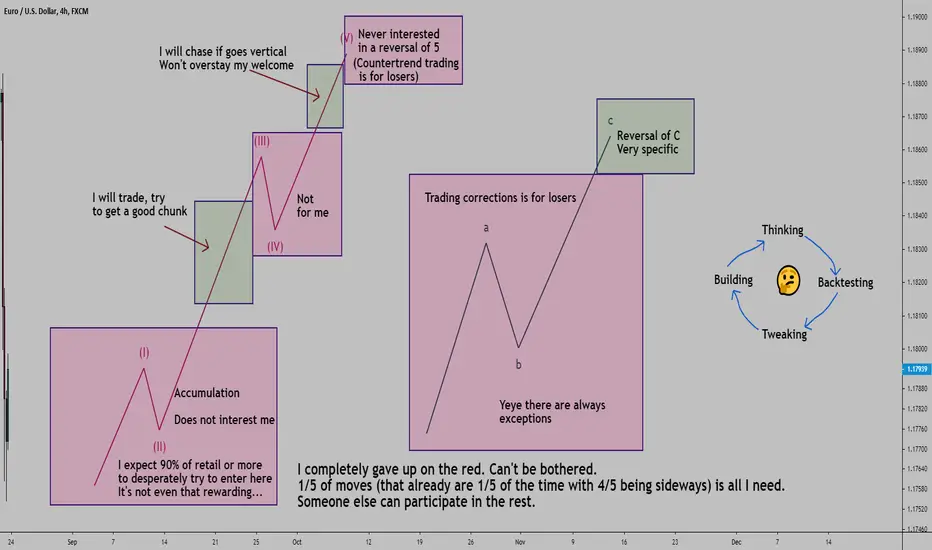
How did my week go? Should I consider changing something?Taking a look at my most marking activities this week, my thought process might interest some.
Reminds me of something... Slow choochooing trends.
I think they can be good. Always reminds me of NEO the crypto.
Was slow choo chooing then just skyrocketed up, mainstreet kindly throwing money for free at me ^^
In this game you are always going back and forth. Always tweaking it. Making compromises.
Constantly thinking. And every week or month (or quarter), or 🤢 day 🤮 for day traders, you don't come to fresh new conclusions but rather you add weight to your permanent conclusions and slowly steer the ship wheel the direction you consider the best.
It is a constant thing, there is no "end game", the markets change all the time so here.
Lazy bums that want "rich quick" might get extremely lucky, and then give most of it back, and then use their luck perf to sell courses on the internet (the shame).
Keep in mind there are less "turtle trader that made huge gains 40 years ago turned to education teacher on something that does not work" than lottery winners.
I gave up on plenty of things: Trading the waves 1 & 2, going for reversals on 5 (and previous ones except 3 if I think it is C), trying to enter too early on 3, trying to enter on 4 (but rather chase it after 5 went past 3), overstaying my welcome on vertical 5's.
Imagine being the guy that tries to catch every more and do every thing (when trust me they can never do just 1 thing right), these clowns always talk and years later, mathematically they should be billionaires, but where are they? Vanished. 100% of the time they are not even capable to understand that what they are saying leads to billionaire.
Real story I told someone ... he can make the biggest gains in history (according to himself) double digit percents in a day np ... "cool so in a month you will be billionaire", genius answer "I can't reach billionaire I don't have 1 million to turn into a billion I only have thousands" ... My eyes... My brain...
Are these people missing braincells? Neurons not connected?
I physically cannot bring myself to explain this xd
I've been taking on average 1 bet a day. That's a good 20/month. A bit more. This week I took 6 ones.
And I roughly estimate for every 10 1R goes away in spreads.
It is natural to always want to be in the market. And 1 excuse is even if some positions might not be the best, there is no better way to learn than being IN.
But I can counter this excuse. Being in less = more thinking, one can go further (there is no analysis paralysis only noobs with excuses) the more info or knowledge the better, it's infinite so... And another plus is take 100 trades you just won't remember anything, but take a few and they'll stay in there. I think I am at my limit, I can't recall all I have taken off the top of my head, but if I spot them it will come back most of the time. Big winners stay more :)
On the other hand you have this trading vip signal educator I recall vividly, going "my best trade was on gold I made so much bla bla bla" "oh nice, can you tell us more about it?" "emmm I do not quite remember" 🤣
These guys are just so funny.
You better have a good memory. Oh and also, not lie and just copy paste "education" (found for free on the internet) that you sell to gullible suckers.
I have been thinking all day about this actually, since midday, and I really do not want to take 0's. I sort of do Elliot waves but I have my own names and own rules and own waves idc about textbook I care about what I saw with my own eyes.
And when a trend goes, the first pullback that often happens around the break (just like with EURUSD) is the one I call... guess how? 0.
Fitting name because it truly feels like 0. I better enter on 1. My only regret this week is EURUSD, which I expected.
I am a little disappointed on NatGas, I thought after I quit my job this would never happen again... but of course here we go again...
I constantly get plenty of opportunities, I do not need to go for those... Feels really like forcing.
I am quitting this specific breakout early pullback join. 1 or 2 more R is not really worth it. No it is not just from that 1 EURUSD fail.
Normally here is where you do even MOAR backtesting to see how those go, and for once it is a quite easy backtest even after the move completed: whether it continued or reversed you can easilly spot those breakout-doesn't go far-pullback patterns on a chart.
I am not an expert at this but I am quite certain you rarely get 7R out of those.
Lovely. The theory in books tell you this is how they operate, the anecdotes tell you the same thing, the OG's say it too, and the market data keeps repeating the same thing.
Those are quick moves (down), this could even be a majority of day traders (you get rich quick even quicker by day trading right?) that ended up bagholding for 2 whole weeks because "but I don't want to lose I am scared".
They probably got so relieved, smiled, all the stress went away. Ye they'll get what's coming when it never comes back. Like Nick Leeson.
I love hearing anecdotes, and tricks and tips, and I love writting about it. Really trying to make short ideas but I just go on and on.
There is so much to think about, understand, talk about.
I feel very good about eliminating a pattern I hesitated about.
Trading Above MA20, Broke Resistance 0.5KSSC has been trading above its upward sloping 20-Day Moving Average which is a good sign.
In addition, the price just broke the resistance of 0.5 reinforcing the bullishness in the recent price movement.
This breakout was accompanied by a higher than average volume which shows the enthusiasm of the traders to push the price higher and past this resistance hence giving a higher probability of successful breakout.
Resistance : 0.810
Support 1 : 0.355
Support 2 : 0.34
Resistance Breakout :
28 Jul : 0.384
2 Jul : 0.375
29 Jun : 0.415
17 Jun : 0.405

DKNG- Technicals show nice breakout -Long entryDKNG broke out of inverse head and shoulder pattern on 4hr. Recently even in bad quarter corona impacted quarter company generated more than estimated profit. I agree fundamentally it is not apple but entry is based on technical analysis. If works then it offers a great risk to reward ratio. I am not an expert on Elliot wave but I try to incorporate it in a very basic manner. Usually it works for me. Wave 5 begins here. If you measure wave 3 target can be about 60.00. I am happy to get 45 to 50 range. Lets hope it materializes. I like the pattern and will go long. Hoping the run to continue. Today was a nice day for a cheap entry as price retraced to the breakout line. This is just an opinion. Everyone must do their own homework before trading or investing in any financial assets.

IRB INFRA- Towards 160+Breakout from one month consolidation, and it may towards 160 - 166 levels on the upside.

is THETABTC ready for a huge profit?LONG TERM – HUGE profit ahead.
💰BUY ZONE:
- 0.00002747
- 0.00002682
Take Profits:
- 🤑 TP 1: 0.00002995
- 🚀 TP 2: 0.00003468
- 🔥 TP 3: 0.00003995
- 🦐 TP 4: 0.00004430
Stop Loss
🚨 BELOW 0.00002499


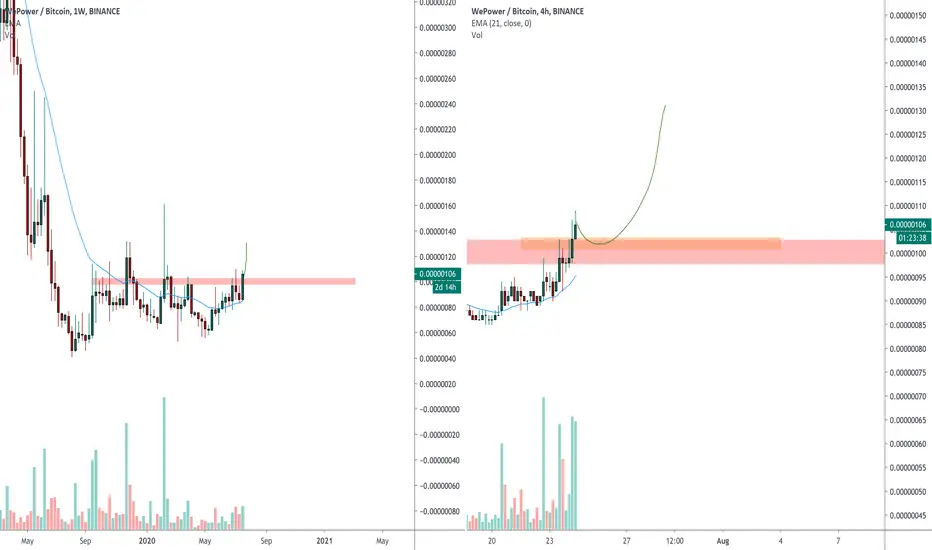
WPRBTC nice weekly chart 🦐WPRBTC nice weekly chart and now (left side) and on 4h timeframe (right side) we are waiting for a retest.
According to Plancton's strategy, we can set a nice order
–––––
Follow the Shrimp 🦐
Here is the Plancton0618 technical analysis, please comment below if you have any question.
The ENTRY in the market will be taken only if the condition of Plancton0618 strategy will trigger.
BTCUSD: Bullish turn? Watching for sell volumeBroke through last set resistance, watching for shorts on balanced volume. Tracking volume volatility and trends on MACD strat and RSI Cross, 5 Day 2 Hr .

euraud longthe h4 trendline is broken and the retest on the trendline will be the right time to enter the trade and go long until the next s/r

WRXBTC breakout 🦐WRXBTC very nice breakout!
In the case THAT the market WILL gain positive momentum (senza ..and) we can set an order according our strategy.
According to Plancton strategy, we can set a nice order
–––––
Follow the Shrimp 🦐
Here is the Plancton0618 technical analysis, please comment below if you have any question.
The ENTRY in the market will be taken only if the condition of Plancton0618 strategy will trigger.

USDCAD is on 4h support 🦐USDCAD is on 4h support, when the price breakouts it,
According to Plancton's strategy, we can set a nice order
–––––
Follow the Shrimp 🦐
Here is the Plancton0618 technical analysis, please comment below if you have any question.
The ENTRY in the market will be taken only if the condition of Plancton0618 strategy will trigger.

TNTBTC nice breakout 🦐TNTBTC nice breakout and now it's looking bullish!
According to Plancton's strategy, we can set a nice order
–––––
Follow the Shrimp 🦐
Here is the Plancton0618 technical analysis, please comment below if you have any question.
The ENTRY in the market will be taken only if the condition of Plancton0618 strategy will trigger.

ERDBTC nice breakout ! 🦐ERDBTC nice breakout !
According to Plancton strategy, we can set a nice order
–––––
Follow the Shrimp 🦐


XVGBTC nice breakout 🦐XVGBTC nice breakout, now the price is near to a resistance, after a new breakout According to Plancton strategy, we can set a nice order
–––––
Follow the Shrimp 🦐
Here is the Plancton0618 technical analysis, please comment below if you have any question.
The ENTRY in the market will be taken only if the condition of Plancton0618 strategy will trigger.

QTUMBTC Waiting for a breakoutQTUMBTC Waiting for a breakout. Now Qtum is in accumulation
According to Plancton strategy, we can set a nice order
–––––
Follow the Shrimp 🦐
Here is the Plancton0618 technical analysis, please comment below if you have any question.
The ENTRY in the market will be taken only if the condition of Plancton0618 strategy will trigger.

Backtest of the backtestOn the weekly chart shows the trend is down and the horizontal support zone is backtested. In the daily chart shows that this backtest was in corrective style with choppy waves in a flat rising channel.
On the 4H chart there is an impulse decline and break out of the channel not to mentioned that there was a breakout back also. So backtest of the backtest is good-looking. These signs empower my bearish view.
On the 1H chart shows the last rising has a five wave structure! That's why I expect to see one more, the last backtest before going down.
We can take the chance at the moment or wait for another breakout sign as my trading strategy on the chart. This decision is about RR and the aggressive or conservative style of trading. It depends on you.
Important
Always use stop order, cutting losses, this is one of the essential elements of your risk management and if you would like to be an independent investor then you must be the master of risk management.
Disclaimer
Reserved the right to make changes the content on this analysis at any time without notice and is provided for the sole purpose of assisting traders to make independent investment decisions.

GBPUSD SELL UPDATE Comment down below to share your opinion that may be useful to the community. Like and follow to know more how I see the market.
Priority:
1. Stop loss must smaller than your take profit.
2. Must at least 2 reasons why you enter the trade.
3. Trade and Forget.
Psychology:
1. Not all setup is valid, its fact.
2. Trading is predicting the market.
3. The only way to win in Forex is by controlling your lot size and your risk to reward ratio.
4. Sometimes when the price hit your stop loss but you still follow your SYSTEM, its still a good trade. READ IT AGAIN!
Money Management:
1. Lot size:
Acc 100 USD : 0.01 lot
Acc 1000 USD : 0.1 lot
Acc 10,000 USD : 1.0 lot
Acc 100,000 USD : 10.0 lot
Acc 1,000,000 USD : 100.0 lot
2. Risk of an account max is 1%-3% from the capital in your current running trades.
