Amazing breakout on MONTHLY Timeframe - APOLLOCheckout an amazing breakout happened in the stock in Weekly timeframe, macroscopically seen in Daily timeframe. Having a great favor that the stock might be bullish expecting a staggering returns of minimum 25% TGT. IMPORTANT BREAKOUT LEVELS ARE ALWAYS RESPECTED!
NOTE for learners: Place the breakout levels as per the chart shared and track it yourself to get amazed!!
#No complicated chart patterns
#No big big indicators
#No Excel sheet or number magics
TRADE IDEA: WAIT FOR THE STOCK TO BREAKOUT IN WEEKLY TIMEFRAME ABOVE THIS LEVEL.
Checkout an amazing breakout happened in the stock in Weekly timeframe.
Breakouts happening in longer timeframe is way more powerful than the breakouts seen in Daily timeframe. You can blindly invest once the weekly candle closes above the breakout line and stay invested forever. Also these stocks breakouts are lifelong predictions, it means technically these breakouts happen giving more returns in the longer runs. Hence, even when the scrip makes a loss of 10% / 20% / 30% / 50%, the stock will regain and turn around. Once they again enter the same breakout level, they will flyyyyyyyyyyyy like a ROCKET if held in the portfolio in the longer run.
Time makes money, GREEDY & EGO will not make money.
Also, magically these breakouts tend to prove that the companies turn around and fundamentally becoming strong. Also the magic happens when more diversification is done in various sectors under various scripts with equal money invested in each N500 scripts.
The real deal is when to purchase and where to purchase the stock. That is where Breakout study comes into play.
LET'S PUMP IN SOME MONEY AND REVOLUTIONIZE THE NATION'S ECONOMY!
Breakouts

Amazing breakout on MONTHLY Timeframe - KAUSHALYACheckout an amazing breakout happened in the stock in Weekly timeframe, macroscopically seen in Daily timeframe. Having a great favor that the stock might be bullish expecting a staggering returns of minimum 25% TGT. IMPORTANT BREAKOUT LEVELS ARE ALWAYS RESPECTED!
NOTE for learners: Place the breakout levels as per the chart shared and track it yourself to get amazed!!
#No complicated chart patterns
#No big big indicators
#No Excel sheet or number magics
TRADE IDEA: WAIT FOR THE STOCK TO BREAKOUT IN WEEKLY TIMEFRAME ABOVE THIS LEVEL.
Checkout an amazing breakout happened in the stock in Weekly timeframe.
Breakouts happening in longer timeframe is way more powerful than the breakouts seen in Daily timeframe. You can blindly invest once the weekly candle closes above the breakout line and stay invested forever. Also these stocks breakouts are lifelong predictions, it means technically these breakouts happen giving more returns in the longer runs. Hence, even when the scrip makes a loss of 10% / 20% / 30% / 50%, the stock will regain and turn around. Once they again enter the same breakout level, they will flyyyyyyyyyyyy like a ROCKET if held in the portfolio in the longer run.
Time makes money, GREEDY & EGO will not make money.
Also, magically these breakouts tend to prove that the companies turn around and fundamentally becoming strong. Also the magic happens when more diversification is done in various sectors under various scripts with equal money invested in each N500 scripts.
The real deal is when to purchase and where to purchase the stock. That is where Breakout study comes into play.
LET'S PUMP IN SOME MONEY AND REVOLUTIONIZE THE NATION'S ECONOMY!

High conviction IPO stock - AIILCheckout an amazing breakout happened in the stock in Weekly timeframe, macroscopically seen in Daily timeframe. Having a great favor that the stock might be bullish expecting a staggering returns of minimum 25% TGT. IMPORTANT BREAKOUT LEVELS ARE ALWAYS RESPECTED!
NOTE for learners: Place the breakout levels as per the chart shared and track it yourself to get amazed!!
#No complicated chart patterns
#No big big indicators
#No Excel sheet or number magics
TRADE IDEA: WAIT FOR THE STOCK TO BREAKOUT IN WEEKLY TIMEFRAME ABOVE THIS LEVEL.
Checkout an amazing breakout happened in the stock in Weekly timeframe.
Breakouts happening in longer timeframe is way more powerful than the breakouts seen in Daily timeframe. You can blindly invest once the weekly candle closes above the breakout line and stay invested forever. Also these stocks breakouts are lifelong predictions, it means technically these breakouts happen giving more returns in the longer runs. Hence, even when the scrip makes a loss of 10% / 20% / 30% / 50%, the stock will regain and turn around. Once they again enter the same breakout level, they will flyyyyyyyyyyyy like a ROCKET if held in the portfolio in the longer run.
Time makes money, GREEDY & EGO will not make money.
Also, magically these breakouts tend to prove that the companies turn around and fundamentally becoming strong. Also the magic happens when more diversification is done in various sectors under various scripts with equal money invested in each N500 scripts.
The real deal is when to purchase and where to purchase the stock. That is where Breakout study comes into play.
LET'S PUMP IN SOME MONEY AND REVOLUTIONIZE THE NATION'S ECONOMY!

GODREJAGRO RETEST DONEThe stock has retested the levels after breakout.
However, there is some supply, and it can absorb it in the near future to thrive.

JM FINANCIL Long consolidation BOLooks like a big cup & handle but not accurate.
The stock gave a long consolidation breakout, and volumes are also shooting up.

Descending Triangle on Brent @ D1A descending triangle pattern has formed on the daily chart of the spot Brent oil. It follows a long-term downtrend in the oil price and can be used for a bearish breakout setup. The triangle's borders are marked with the yellow lines. The cyan line is where my potential entry level will be. It is located at 10% of the pattern's height below the lower border. The green line denotes my take-profit level. It is set to the 100% of the pattern height plotted below the lower border. I will set the stop-loss level to the triangle's highest point (81.710) - the red line. I will ignore bullish breakouts from this trend continuation pattern.

Z for ZETA - Breakout - Reversal Ascending Triangle, bottomed out and reversal in motion of downtrend breakout.
The chart is pretty self explanatory.
Careful with risk management.

Play for a Range Breakout...NSE:LAURUSLABS trade @ 445, Resistence is 485 & Support is 385. lauruslabs trade in range since APR/2023. You can watch for a breakout and next resistence is @ 600-625 after that its ATH @ 725.

CENTURYPLY Seen an Upside Swing Move...CENTURYPLY made a triangle pattern. and give a breakout above 750. You can watch for a Swing move. Next Resistence is at 1000...

MORPHO Breaks AboveMORPHO displaying significant strength in it's breakout upwards, could reach 5.00 within the next two weeks.

Amazing breakout on Weekly Timeframe - JUBLFOODCheckout an amazing breakout happened in the stock in Weekly timeframe, macroscopically seen in Daily timeframe. Having a great favor that the stock might be bullish expecting a staggering returns of minimum 25% TGT. IMPORTANT BREAKOUT LEVELS ARE ALWAYS RESPECTED!
NOTE for learners: Place the breakout levels as per the chart shared and track it yourself to get amazed!!
#No complicated chart patterns
#No big big indicators
#No Excel sheet or number magics
TRADE IDEA: WAIT FOR THE STOCK TO BREAKOUT IN LOWER TIMEFRAME AND RETRACE IF NEEDED. SL IS NEARER SUPPORT ZONE IN Daily TIMEFRAME.
Checkout an amazing breakout happened in the stock in Weekly timeframe.
Breakouts happening in longer timeframe is way more powerful than the breakouts seen in Daily timeframe. You can blindly invest once the weekly candle closes above the breakout line and stay invested forever. Also these stocks breakouts are lifelong predictions, it means technically these breakouts happen giving more returns in the longer runs. Hence, even when the scrip makes a loss of 10% / 20% / 30% / 50%, the stock will regain and turn around. Once they again enter the same breakout level, they will flyyyyyyyyyyyy like a ROCKET if held in the portfolio in the longer run.
Time makes money, GREEDY & EGO will not make money.
Also, magically these breakouts tend to prove that the companies turn around and fundamentally becoming strong. Also the magic happens when more diversification is done in various sectors under various scripts with equal money invested in each N500 scripts.
The real deal is when to purchase and where to purchase the stock. That is where Breakout study comes into play.
LET'S PUMP IN SOME MONEY AND REVOLUTIONIZE THE NATION'S ECONOMY!

Amazing breakout on Weekly Timeframe - GREAVESCOTCheckout an amazing breakout happened in the stock in Weekly timeframe, macroscopically seen in Daily timeframe. Having a great favor that the stock might be bullish expecting a staggering returns of minimum 25% TGT. IMPORTANT BREAKOUT LEVELS ARE ALWAYS RESPECTED!
NOTE for learners: Place the breakout levels as per the chart shared and track it yourself to get amazed!!
#No complicated chart patterns
#No big big indicators
#No Excel sheet or number magics
TRADE IDEA: WAIT FOR THE STOCK TO BREAKOUT IN LOWER TIMEFRAME AND RETRACE IF NEEDED. SL IS NEARER SUPPORT ZONE IN Daily TIMEFRAME.
Checkout an amazing breakout happened in the stock in Weekly timeframe.
Breakouts happening in longer timeframe is way more powerful than the breakouts seen in Daily timeframe. You can blindly invest once the weekly candle closes above the breakout line and stay invested forever. Also these stocks breakouts are lifelong predictions, it means technically these breakouts happen giving more returns in the longer runs. Hence, even when the scrip makes a loss of 10% / 20% / 30% / 50%, the stock will regain and turn around. Once they again enter the same breakout level, they will flyyyyyyyyyyyy like a ROCKET if held in the portfolio in the longer run.
Time makes money, GREEDY & EGO will not make money.
Also, magically these breakouts tend to prove that the companies turn around and fundamentally becoming strong. Also the magic happens when more diversification is done in various sectors under various scripts with equal money invested in each N500 scripts.
The real deal is when to purchase and where to purchase the stock. That is where Breakout study comes into play.
LET'S PUMP IN SOME MONEY AND REVOLUTIONIZE THE NATION'S ECONOMY!

$NASDAQ:RGTI breaking out of a bullish flagNASDAQ:RGTI appears to be breaking out of a bullish flag with ~$14 Price Target (PT).
Awaiting confirmation on volume, but 100M shares have traded 2 hours into the trading day, which matches recent daily volume. Long story short... looks like there's going to be a lot of volume today.
As I get closer to the PT, I'll set up a trailing stop to help maximize profits/minimize loss.
Good luck!

$NASDAQ:LUNR Ready for a 60% upside double bottom patternNASDAQ:LUNR there's a ~60% upside on this play.
Lunr has broken through a previous resistance point (~$14.00) and should be on track to reach the Price Target (PT) for completing a double bottom pattern ($24.41)
Entry : anything above $14, with positive direction indicators
Stop : $13.45 - heading below the ~14 resistance (now our support) is not ok, but should not dip into the lower volume pocket.
Exit : Take profits on half at ~$24 and set trailing stops on any remaining shares.
Good Luck!

GOLDEN Breakout setup on Nifty 50 for (30-12-24)Nifty 50 index was going sideways for 3 days, today it gave bull breakout but not sustained properly. So next trading day can become significantly important if you do breakout trades!
ANALYSIS :
On chart you can see I am using my custom build indicator named Golden Trading System (GTS) it shows two significant support and resistance zones which works like magic! as of now it is not published but you can follow us to get notified when we publish this.
How you can use it ?
Alternatively you can use standard pivot point and change the pivot type to camarilla. Here we will only use H3-H4 and L3-L4.
In the chart you can see I already marked the H3-H4 and L3-L4 for tomorrow (30-12-24) so you can use that instead.
How to TRADE ?
Tomorrow (30-12-24) three thing can happen :-
(i) If market gave breakout the green band (H3-H4) we can look Long setup.
(ii) If market gave breakout the red band (L3-L4) we can look Short setup.
(iii) Market can go sideways / range bound between green band and red band.
CAUTION :-
While taking bullish trades we should not neglect the red resistance line and also While taking bearish trades we should not neglect the red support line because form those points market can reverse so trade cautiously and with "Stop Loss".

Crypto LONG Signal #ZECUSDT. Potential profit 17%
30m TF. BINANCE:ZECUSDT is showing growth alongside increasing volumes, indicating heightened buyer interest. The price has reached 67.93 USDT and is targeting a breakout of key resistance.
🔑 Key Levels
Support:
67.45 USDT – the nearest support level where demand has been observed.
63.71 USDT – a stronger support level maintaining the current uptrend.
Resistance:
75.33 USDT – the first target after a breakout.
76.88 USDT – the secondary resistance level.
79.50 USDT – the key target for profit-taking.
🚩 Trading Strategy
Entry Point:
Consider opening a long position above 67.93 USDT.
Stop-Loss:
Place a protective stop order below 67.45 USDT to minimize risks.
Take-Profit Targets:
75.33 USDT – the first target for partial profit-taking.
76.88 USDT – an intermediate target.
79.50 USDT – the final target.
📈 Technical Analysis
Rising volumes confirm buyers’ readiness for further growth.
A price consolidation above 67.93 USDT will strengthen the upward impulse.
A retest of 67.45 USDT before the breakout could provide a good entry point.
💡 Recommendations
Monitor Volumes: Increased volumes during the breakout will confirm the strength of the move.
Manage Risks: Use sensible stop-loss orders to limit potential losses.
Analyze Dynamically: Use smaller timeframes (15m and 1h) for precise entry points.
Conclusion
BINANCE:ZECUSDT shows strong upward potential. Watch for a breakout above 67.93 USDT to take advantage of the current market conditions.

XAUUSD Revision Saturday 21 December 2024Hello Nation!
Let’s look how Gold did today. We started at around the 2594 area. It was looking like it may move down further till right before London Open,Buyers came in and took control. We did not even touch the low of yesterday.
By London Session, We had a H1 Resistance Break. Price consolidated for a while. Bouncing on the previous Resistance which becomes a support. The multiple rejections of the candles is a hint for me to be ready for a buy setup.
With a 30 pips Risk and a target of 100 pips. It went straight to break another H1 Resistance Level. Similarly, that Resistance level becomes a Support Level. M15 box clearly support this idea. But it was too close to a red folder news (PCE Price index).
But risk takers would have survive the news if they attempted with the usual 30pips Risk Setup. Price didn’t even break the m15 box. It went straight breaking another H1 Resistance.
Another RBS Moment on the H1. A very clean body break on the m15 gives us a loud possibility that price was continuing upwards. With another M15 box. I might consider this as a low risk entry as Price was with good momentum and a very clear show of direction.
We can spot 3 beautiful entries with the focus on H1 and M15 SNR. As i am writing this, I am still in a buy position which i entered earlier.
As i had explained, I am just sharing what i see. I believe in trading there are no 100% winning Strategy. Even myself, do suffer from losses and missed opportunities. I simply just want to pen it down so that i can read these notes and improve myself. Trading is an endless studying journey and the best teacher is our mistakes.
I also do hope this will benefit the person who red it with hope they can learn from my mistakes and experience. I am not a market mover or a forex educator. Just someone who buy and sell candles like you.
Conclusion for Gold today. It Reversed from Bearish to Bullish.
Thank you for Reading! And Good bye!

$NYSE:QBTS Breaking out?NYSE:QBTS has broken above the top of a bullish flag. Initial Price Target (PT) is ~$9.28

Amazing breakout on Weekly Timeframe - PAYTMCheckout an amazing breakout happened in the stock in Weekly timeframe, macroscopically seen in Daily timeframe. Having a great favor that the stock might be bullish expecting a staggering returns of minimum 25% TGT. IMPORTANT BREAKOUT LEVELS ARE ALWAYS RESPECTED!
NOTE for learners: Place the breakout levels as per the chart shared and track it yourself to get amazed!!
#No complicated chart patterns
#No big big indicators
#No Excel sheet or number magics
TRADE IDEA: WAIT FOR THE STOCK TO BREAKOUT IN LOWER TIMEFRAME AND RETRACE IF NEEDED. SL IS NEARER SUPPORT ZONE IN Daily TIMEFRAME.
Checkout an amazing breakout happened in the stock in Weekly timeframe.
Breakouts happening in longer timeframe is way more powerful than the breakouts seen in Daily timeframe. You can blindly invest once the weekly candle closes above the breakout line and stay invested forever. Also these stocks breakouts are lifelong predictions, it means technically these breakouts happen giving more returns in the longer runs. Hence, even when the scrip makes a loss of 10% / 20% / 30% / 50%, the stock will regain and turn around. Once they again enter the same breakout level, they will flyyyyyyyyyyyy like a ROCKET if held in the portfolio in the longer run.
Time makes money, GREEDY & EGO will not make money.
Also, magically these breakouts tend to prove that the companies turn around and fundamentally becoming strong. Also the magic happens when more diversification is done in various sectors under various scripts with equal money invested in each N500 scripts.
The real deal is when to purchase and where to purchase the stock. That is where Breakout study comes into play.
LET'S PUMP IN SOME MONEY AND REVOLUTIONIZE THE NATION'S ECONOMY!

Amazing breakout on Weekly Timeframe - BLSCheckout an amazing breakout happened in the stock in Weekly timeframe, macroscopically seen in Daily timeframe. Having a great favor that the stock might be bullish expecting a staggering returns of minimum 25% TGT. IMPORTANT BREAKOUT LEVELS ARE ALWAYS RESPECTED!
NOTE for learners: Place the breakout levels as per the chart shared and track it yourself to get amazed!!
#No complicated chart patterns
#No big big indicators
#No Excel sheet or number magics
TRADE IDEA: WAIT FOR THE STOCK TO BREAKOUT IN LOWER TIMEFRAME AND RETRACE IF NEEDED. SL IS NEARER SUPPORT ZONE IN Daily TIMEFRAME.
Checkout an amazing breakout happened in the stock in Weekly timeframe.
Breakouts happening in longer timeframe is way more powerful than the breakouts seen in Daily timeframe. You can blindly invest once the weekly candle closes above the breakout line and stay invested forever. Also these stocks breakouts are lifelong predictions, it means technically these breakouts happen giving more returns in the longer runs. Hence, even when the scrip makes a loss of 10% / 20% / 30% / 50%, the stock will regain and turn around. Once they again enter the same breakout level, they will flyyyyyyyyyyyy like a ROCKET if held in the portfolio in the longer run.
Time makes money, GREEDY & EGO will not make money.
Also, magically these breakouts tend to prove that the companies turn around and fundamentally becoming strong. Also the magic happens when more diversification is done in various sectors under various scripts with equal money invested in each N500 scripts.
The real deal is when to purchase and where to purchase the stock. That is where Breakout study comes into play.
LET'S PUMP IN SOME MONEY AND REVOLUTIONIZE THE NATION'S ECONOMY!

Amazing breakout on Weekly Timeframe - MAHSEAMLESCheckout an amazing breakout happened in the stock in Weekly timeframe, macroscopically seen in Daily timeframe. Having a great favor that the stock might be bullish expecting a staggering returns of minimum 25% TGT. IMPORTANT BREAKOUT LEVELS ARE ALWAYS RESPECTED!
NOTE for learners: Place the breakout levels as per the chart shared and track it yourself to get amazed!!
#No complicated chart patterns
#No big big indicators
#No Excel sheet or number magics
TRADE IDEA: WAIT FOR THE STOCK TO BREAKOUT IN LOWER TIMEFRAME AND RETRACE IF NEEDED. SL IS NEARER SUPPORT ZONE IN Daily TIMEFRAME.
Checkout an amazing breakout happened in the stock in Weekly timeframe.
Breakouts happening in longer timeframe is way more powerful than the breakouts seen in Daily timeframe. You can blindly invest once the weekly candle closes above the breakout line and stay invested forever. Also these stocks breakouts are lifelong predictions, it means technically these breakouts happen giving more returns in the longer runs. Hence, even when the scrip makes a loss of 10% / 20% / 30% / 50%, the stock will regain and turn around. Once they again enter the same breakout level, they will flyyyyyyyyyyyy like a ROCKET if held in the portfolio in the longer run.
Time makes money, GREEDY & EGO will not make money.
Also, magically these breakouts tend to prove that the companies turn around and fundamentally becoming strong. Also the magic happens when more diversification is done in various sectors under various scripts with equal money invested in each N500 scripts.
The real deal is when to purchase and where to purchase the stock. That is where Breakout study comes into play.
LET'S PUMP IN SOME MONEY AND REVOLUTIONIZE THE NATION'S ECONOMY!

Amazing breakout on Weekly Timeframe - PAGEINDCheckout an amazing breakout happened in the stock in Weekly timeframe, macroscopically seen in Daily timeframe. Having a great favor that the stock might be bullish expecting a staggering returns of minimum 25% TGT. IMPORTANT BREAKOUT LEVELS ARE ALWAYS RESPECTED!
NOTE for learners: Place the breakout levels as per the chart shared and track it yourself to get amazed!!
#No complicated chart patterns
#No big big indicators
#No Excel sheet or number magics
TRADE IDEA: WAIT FOR THE STOCK TO BREAKOUT IN LOWER TIMEFRAME AND RETRACE IF NEEDED. SL IS NEARER SUPPORT ZONE IN Daily TIMEFRAME.
Checkout an amazing breakout happened in the stock in Weekly timeframe.
Breakouts happening in longer timeframe is way more powerful than the breakouts seen in Daily timeframe. You can blindly invest once the weekly candle closes above the breakout line and stay invested forever. Also these stocks breakouts are lifelong predictions, it means technically these breakouts happen giving more returns in the longer runs. Hence, even when the scrip makes a loss of 10% / 20% / 30% / 50%, the stock will regain and turn around. Once they again enter the same breakout level, they will flyyyyyyyyyyyy like a ROCKET if held in the portfolio in the longer run.
Time makes money, GREEDY & EGO will not make money.
Also, magically these breakouts tend to prove that the companies turn around and fundamentally becoming strong. Also the magic happens when more diversification is done in various sectors under various scripts with equal money invested in each N500 scripts.
The real deal is when to purchase and where to purchase the stock. That is where Breakout study comes into play.
LET'S PUMP IN SOME MONEY AND REVOLUTIONIZE THE NATION'S ECONOMY!

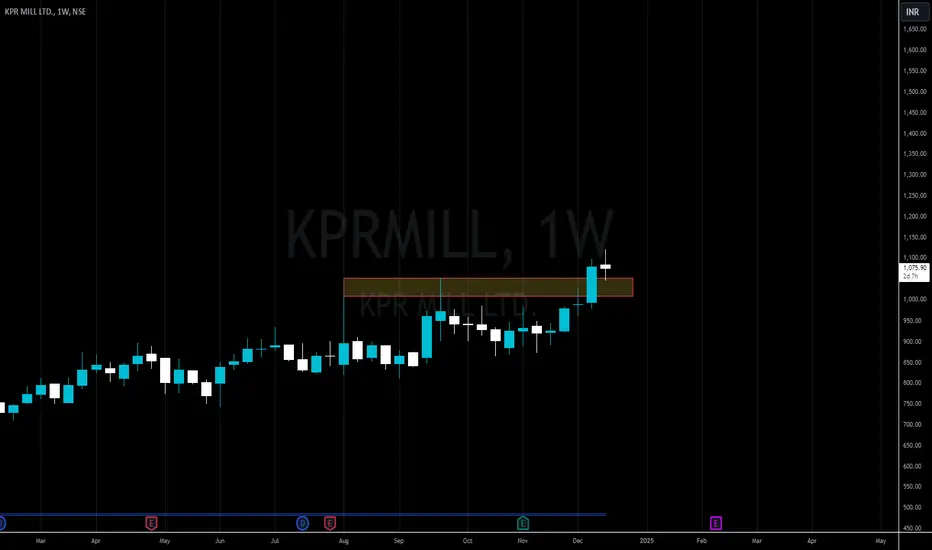
Amazing breakout on Weekly Timeframe - KPRMILLCheckout an amazing breakout happened in the stock in Weekly timeframe, macroscopically seen in Daily timeframe. Having a great favor that the stock might be bullish expecting a staggering returns of minimum 25% TGT. IMPORTANT BREAKOUT LEVELS ARE ALWAYS RESPECTED!
NOTE for learners: Place the breakout levels as per the chart shared and track it yourself to get amazed!!
#No complicated chart patterns
#No big big indicators
#No Excel sheet or number magics
TRADE IDEA: WAIT FOR THE STOCK TO BREAKOUT IN LOWER TIMEFRAME AND RETRACE IF NEEDED. SL IS NEARER SUPPORT ZONE IN Daily TIMEFRAME.
Checkout an amazing breakout happened in the stock in Weekly timeframe.
Breakouts happening in longer timeframe is way more powerful than the breakouts seen in Daily timeframe. You can blindly invest once the weekly candle closes above the breakout line and stay invested forever. Also these stocks breakouts are lifelong predictions, it means technically these breakouts happen giving more returns in the longer runs. Hence, even when the scrip makes a loss of 10% / 20% / 30% / 50%, the stock will regain and turn around. Once they again enter the same breakout level, they will flyyyyyyyyyyyy like a ROCKET if held in the portfolio in the longer run.
Time makes money, GREEDY & EGO will not make money.
Also, magically these breakouts tend to prove that the companies turn around and fundamentally becoming strong. Also the magic happens when more diversification is done in various sectors under various scripts with equal money invested in each N500 scripts.
The real deal is when to purchase and where to purchase the stock. That is where Breakout study comes into play.
LET'S PUMP IN SOME MONEY AND REVOLUTIONIZE THE NATION'S ECONOMY!