#Dash to 128: Is a Rocket Launch Imminent?I think it is possible for #doordash to have a significant run to the upside considering the dovish-neutral stance from the fed, if it can break and close the week above 103.16 in my opinion.
Breakoutsignal

Gail is about to give a BrakOut and continue it's RALLY!!Gail is about to give a Breakout and continue it's RALLY!!
IF there is a BO with huge volume that would be a great choice to enter as it could give us another 8-10%

golden crossstock tarding at golden cross over
run-away gap in chart
last time run awy gap give big move
so same can be accepted.

licwooo
stock at best level to add
volume, helping stock move up
market is bullish, so may get stock help
quantity must be maintained and accumulate at dip
no recognition for buy and sell

Breakout in PolycabThe day has arrived. Breakout in Polycab....targets are in line as posted earlier.

potential PSIL breakout from descending wedge. 5:1 RR, PSIL etf looks to be breaking out above the descending wedge it has been consolidating in. Top holding for the ETF (CYBN) is holding a meeting on Nov 30, 2023 to go over results of their clinical study on depression. Could be a breakout time for the psychedelic sector. Waiting for some confirmation on a breakout, and could take profit at 2.25 level.
Disclosure: amateur swing trader, not a pro yet

Long Trade in RIOTCrypto stocks are on the move, and Riot Blockchain (RIOT) is setting up for a potential breakout buy here. The stock carries a relative strength rating of 98/100, putting it in the top 2% of stocks based on performance.
Crypto and digital payment companies was the top-performing sector over the last 2 months and ranked 2nd over the last 3 months. In other words, there is tremendous group strength here.
What I want to see is a strong move through the $12 area on above-average volume. This would be my trigger to buy in anticipation of a quick rally higher.

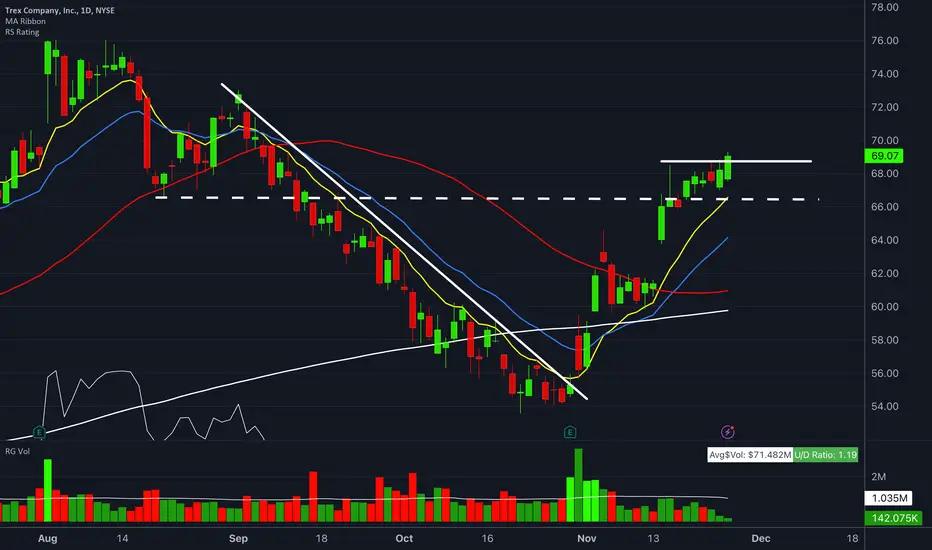
Long Trade in TREXTREX looks buyable here as it breaks through the pivot at $69.
TREX is a building products company - specifically decking materials. Construction and related stocks have surged the last several weeks after Wall Street interpreted the latest Fed meeting as a pivot away from raising rates. the 10-yr bond yield has fallen 0.50% over the last few weeks and mortgage rates have come down with it.
The boom in construction, which has been fueled by a lack of housing supply in the used market, is likely to accelerate further if rates continue falling as many banks currently forecast.
And Trex Company will benefit from this trend.
After a structured downtrend in August and September, TREX has ripped higher on big volume. It now trades above all its moving averages and has another 10% to go before reaching its 52-week highs at $76.
But TREX is well below its all-time highs. Shares traded at $140 in late 2021 - double its current price. So it looks like there appears to be plenty of upside left on this one.
📈 TradingView Analysis: $APE/USDT Falling Wedge Breakout! 🚀Chart Analysis:
Pair: $APE/USDT
Timeframe: 4-Hour Chart
🔍 Technical Overview:
APE/USDT has been forming a clear falling wedge pattern.
Price has recently broken out above the upper trendline of the falling wedge.
📉 Previous Price Action:
The falling wedge has been a consistent pattern, indicating a period of consolidation.
A series of lower highs and lower lows were observed within the wedge.
🚀 Breakout Confirmation:
The recent breakout above the upper trendline suggests a potential trend reversal.
Volume confirmation during the breakout adds strength to the bullish case.
💡 Key Levels to Watch:
Resistance: The next resistance level to watch is at .
Support: The previous resistance, now turned support, is at .
📊 Indicators:
RSI: Showing signs of bullish divergence, indicating strengthening buying pressure.
MACD: Bullish crossover, signaling a potential shift in momentum.
📅 Upcoming Events:
Keep an eye on upcoming events, announcements, or catalysts that could impact the price.
🔒 Risk Management:
Set stop-loss orders to manage risk in case of unexpected price movements.
Adjust positions according to your risk tolerance and trading strategy.
📈 Conclusion:
The breakout from the falling wedge pattern suggests a potential bullish trend for $APE/USDT. However, always exercise caution and conduct thorough analysis before making trading decisions.
📣 Disclaimer:
This is not financial advice. Trading involves risk, and it's important to conduct your own research. The breakout scenario is based on technical analysis, and market conditions can change rapidly.
👥 Join the Discussion:
Share your thoughts on the $APE/USDT falling wedge breakout. What's your price target, and how are you approaching this trade?
🚀 Happy Trading! 📈✨

Linear Regression Second Derivative and Breakout Signal ScriptsUsing Linear Regression of Second Derivative script, we can see that the momentum is down, but that down momentum is actually decreasing, as the downward histogram is making a higher low compared to prior histogram. Also, Breakout Signals script is showing yellow squares at the bottom. This means that the EMAs are stacked correctly, there is a compression(it’s getting ready for a move), the velocity is increasing(price is accelerating) and the DI+ is increasing and DI- is decreasing. All these factors, when combined, give us a high probability that the coin will go up(although nothing is guaranteed in trading which is why we are using stops to protect ourselves from losses)
Our Target is the top of that Keltner Channel which has a length of 21, multiplier of 2.86 and ATR length of 14.

Low price Good chart set-up
Ascending triangle chart set-up
Risk reward super
18 stoploss 24 Target 1:4
No recommendation for buy and sell

A Clean Breakout Stock for Week AheadAfter giving more than 19% upside yesterday, AGRITECH has broken all records.
Can be added at CMP.
Is it another Tata Investment? Reply awaited.

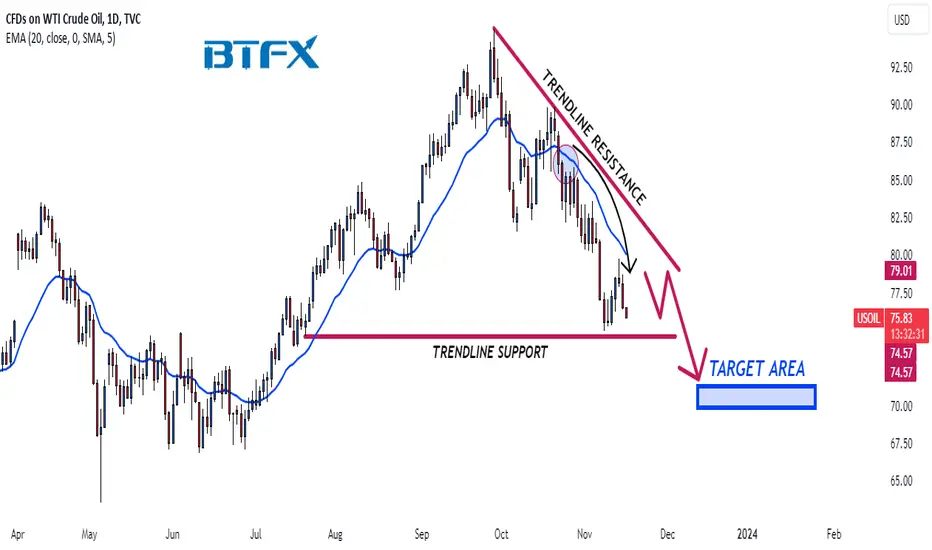
BluetonaFX - USOIL Descending Triangle PatternHi Traders!
The bearish price action continues on the USOIL 1D chart, and there may be possible opportunities for short entries.
Price Action 📊
The market has had lower highs and lower lows since breaking below the 3-month low and 20 EMA, creating a descending triangle pattern on the chart.
We are looking for further bearish momentum to break and close the trendline support line and continue to the downside.
Fundamental Analysis 📰
The market's outlook on USOIL is currently negative due to continuing dips in oil prices following tensions in the Middle East.
Support 📉
74.57: TRENDLINE SUPPORT
Resistance 📈
79.01: TRENDLINE RESISTANCE
Risk ⚠️
No more than 2% of your capital.
Reward 💰
At least 4% of your capital.
Please make sure to click on the like/boost button 🚀 as your support greatly helps.
Trade safely and responsibly.
BluetonaFX
AUDJPY Counter Trendline BreakoutWe expect further upside on this pair, signalled by the breakout of the counter trendline. We can also see the breakout, close and retest of price above a key level further supporting our directional basis.

breakout Ashiana's core business model is to buy land, turn it into a residential building, and sell it. Inventories should be liquidated in a 5-7 year timeframe. Management targets projects with gross margins over 30%.
2017-year high breakout with volume
380 targets with stop loss of 170
no recommendation for buy and sell

BTC ANALYSIS🔮 #BTC Analysis - Breakout Trading
🌟🚀 #BTC was trading in a rising wedge pattern and now we can see a perfect breakout. But there is an immediate resistance in #BTC. If daily candle closes above resistance then after that a bullish scenario will be created.📈📈
🔖 Current Price: $37000
⏳ Target Price: $42500
⁉️ What to do?
- We have marked crucial levels in the chart . We can trade according to the chart and make some profits. 🚀💸
🏷Remember, the crypto market is dynamic in nature and changes rapidly, so always use stop loss and take proper knowledge before investments.
#BTC #Cryptocurrency #Breakout #DYOR

Stock at break up level This stock
When it sustain 390 level above it will touch life time High level so participate in rally by adding small small portion
My Target 500+
No recommendation for buy and sell
Take own analysis or SEBI registration advice
No responsibility from my side for profit or loss
I'm not recommending to participate in rally just education purpose

BLS International - Looks Good!The price has recently broken out to the upside after a period of consolidation, indicating that the prior upward trend is likely to continue.
A Symmetrical Continuation Triangle with a bullish bias is characterized by two converging trendlines. During this formation, prices make lower highs and higher lows, creating a tightening range. As the pattern evolves, trading volume tends to decrease, reflecting market uncertainty and indecision. It's important to note that the breakout occurs before the triangle reaches its apex, the point where the trendlines meet.
What's particularly noteworthy is that the price breaks above the upper trendline with a noticeable surge in trading volume, serving as confirmation that the pattern is a signal for a continuation of the previous uptrend. This breakout suggests that the market sentiment has shifted back to a more bullish stance, potentially leading to further price appreciation.
Note at below RSI Vs Price divergence also noticed!
PLEASE NOTE THAT:
This chart analysis is only for reference purpose.
This is not buying or selling recommendations.
I am not SEBI registered.
Please consult your financial advisor before taking any trade

AUDUSD Symmetrical Triangle BreakoutWe expect further upside on this pair, signalled by the symmetrical triangle channel pattern breakout. We can also see the formation of a new high which signals a change in trend from bearish to bullish as well as a breakout of a key level which further supports our directional basis.

DOGE ANALYSIS🔮 #DOGE Analysis 💰💰
🌟#DOGE was trading in a falling wedge pattern and gave a breakout. Also it retests the levels, now we can see a bullish move in #DOGE📈📈
🔖 Current Price: $0.06872
⏳️ Target Price: $0.09360
⁉️ What to do?
- We have marked some crucial levels in the chart. We can trade according to the chart and make some profits in #DOGE. Keep your eyes on the chart, observe trading volume and stay accustom to market moves.🚀💸
🏷Remember, the crypto market is dynamic in nature and changes rapidly, so always use stop loss and take proper knowledge before investments.
#DOGE #Cryptocurrency #Breakout #DYOR

Canara Bank Again a Nice BreakoutCanara Bank touched a convergence of a support and a rising trendline, a reversal done, and a breakout above the short-term falling trendline, but today it failed to cross the previous high, and following the resistance, it cooled off a bit. But looking at the candles of the last Days, we may expect it to breakout and move higher. My Expectations for Targets 416 and 466 in the Coming Months

DUSK MANIPULATION TRIANGLE PATTERN 🏴DUSK Network (DUSK) has something remarkable unfolding on its weekly chart. It has artfully painted a substantial bullish pennant pattern, complete with a fakeout move to the downside. Now, it's poised for a genuine upward surge. The key to entering this market? Patience and a confirmation through a flag retest. 📊🏴
The Bullish Pennant Emerges:
DUSK has illustrated a spectacular bullish pennant pattern on its weekly chart. This pattern consists of a strong upward move (the flagpole) followed by a consolidation phase marked by lower highs and higher lows (the flag). It's a classic indicator of impending bullish momentum. 📈🚩
The Fakeout Element:
What makes this scenario even more intriguing is the fakeout move to the downside. It's a tactical maneuver to shake off traders prematurely entering short positions. But for the astute trader, this can be seen as an opportunity. 🃏
Entering the Market:
For those eyeing a position in DUSK:
Wait for the Flag Retest: The prime entry point is after DUSK retests the lower border of the flag. This can act as a confirmation of the bullish intent.
Risk Management: Implement solid risk management strategies, including stop-loss orders, to protect your investment.
Stay Informed: Keep an eye on DUSK's fundamentals and any news that could impact its price action.
Conclusion:
The cryptocurrency market is a realm of intricacies, where patterns like the bullish pennant can offer insights into potential price movements. However, it's important to approach it with both caution and knowledge.
The fakeout move might have left some traders bewildered, but it also creates opportunities. The key is to be patient, wait for confirmations, and be prepared for the genuine upward movement.
As always, adapt your strategy to the ever-evolving market conditions, stay informed, and trade wisely.
❗️Get my 3 crypto trading indicators for FREE! Link below🔑

Beautiful breakout Weekly chart analysis
1) my Target 1280-1300
2) stock beautiful breakout 980 resistance
3) now stock may face sentimental resistance of 1000
4) when it sustain above sentimental resistance
5) it can go as my 🎯
6) keep Stop loss of 850
7) manage quantity for better results
8) symmetrical triangle breakout in stock
9) good volume build-up in stock
10) we not recommend any stock and this stock also, I'm trying to show case my knowledge in yours
11) risk is yours I'm not responsible for any stock buying and selling
