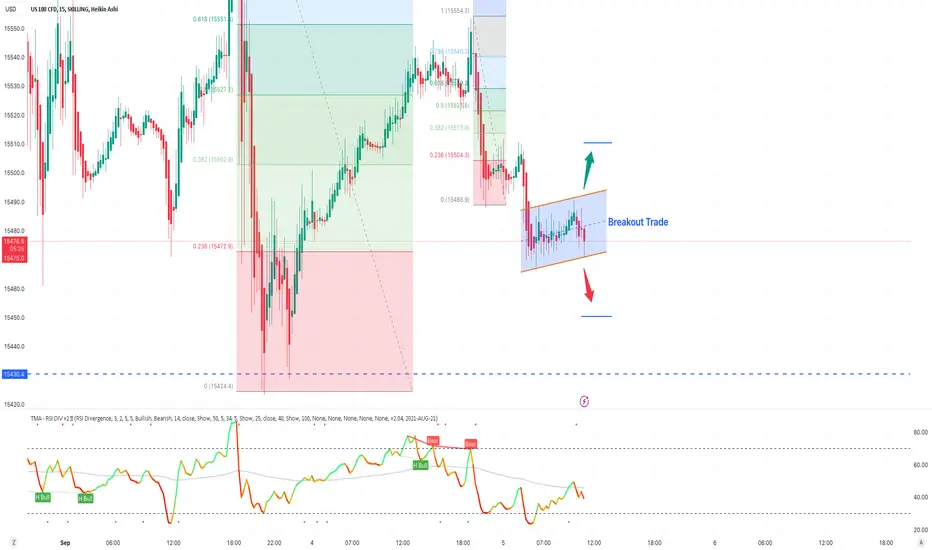
BTCUSD Parallel Channel Breakout TradeNASDAQ wait for breakout and trade in the direction of breakout or place your buy and sell stop.
Manage your risk according to account size!
Breakoutsignal

Ye Bandhan toh pyar ka Bandhan haiThe stock price has retraced above 50% from the previous downtrend in the daily time frame. It has formed an ascending triangle formation with a flat resistance and higher lows in support trendline with an increase in volume. The breakout from this pattern can take the stock its recent high levels again.
Entry - Abouve 246
Target - 272
Stop Loss - 229

Big upside for PersistentThe stock has made a rounding bottom for a while, it has given a breakout from the neckline now positioning itself ready for a good upside with a favorable risk-to-reward ratio.
Entry - Between 5370-5375
Stop Loss - Below 5145
Target - 5900

Honda PowerCMP 2869
Consistent increase in volume
Cup & Handle formation on weekly charts
Break out will trigger a quick up move of 10%
Looks bullish, Consistent HL and HH

Bearish Trend XAGUSDBearish Trend XAGUSD After Analysis found in 1 hour chart Bearish Divergence, and the trend is bearish as well,Entry Point is also defined and TP1 & TP2 is set as well,

NASDAQ Parallel Channel Breakout TradeNASDAQ wait for breakout and trade in the direction of breakout or place your but and sell stop.
Manage your risk according to account size!
NTPC Trade Plan with Fresh breakout1. Trend - Bullish
2. Strength - Very strong
3. Breakout - Confirmed
4. Consolidation before breakout

Gail Trade plan for 145+ Target1. Trend Bullish
2. Market recovering
3. Simple lines can make money, stay tune for more.

Bhel Trade plan for 180+ Target1. Trend - Bullish
2. Strength - Strong
3. 1 day move is 12%, so that retailer can not participate and wait for retest, but before it come for retest, chances are high it may touch 180+

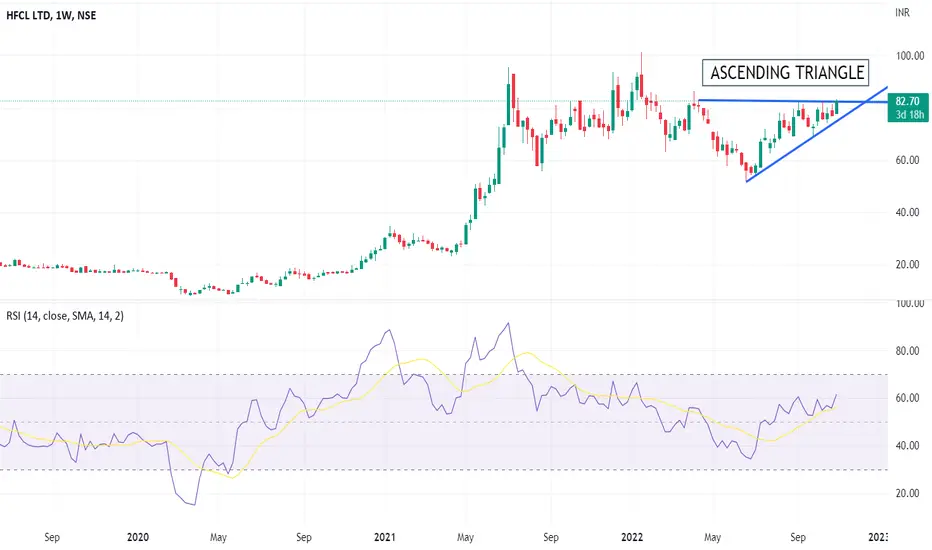
HFCL - Double Digit + Smallcap + Breakout Soon📊 Script: HFCL (HFCL LIMITED)
📊 Nifty50 Stock: NO
📊 Sectoral Index: NIFTY 500 / NIFTY SMALL CAP
📊 Sector: Telecommunication
📊 Industry: Telecom - Infrastructure
DAILY TIMEFRAME
Key highlights: 💡⚡
📈 Script is trading at upper band of Bollinger Bands (BB) and giving breakout of it.
📈 MACD line is taking support of signal line and bounce back from there.
📈 Double Moving Averages already giving crossover.
📈 Volume is increasing along with price which is volume breakout.
📈 Script is going to give breakout of ascending triangle in Weekly and Daily chart.
📈 Current RSI is around 64.
📈 One can go for Swing Trade.
⏱️ C.M.P 📑💰- 82.70
🟢 Target 🎯🏆 - 95
⚠️ Stoploss ☠️🚫 - 75
⚠️ Important: Always maintain your Risk & Reward Ratio.
⚠️ Purely technical based pick.
✅Like and follow to never miss a new idea!✅
Disclaimer: I am not SEBI Registered Advisor. My posts are purely for training and educational purposes.
Eat🍜 Sleep😴 TradingView📈 Repeat🔁
Happy learning with trading. Cheers!🥂
ICICIPRULI looking good !!NSE:ICICIPRULI trading @ above resistance level which is already tested.
Expecting good move upside and all the potential levels marked.
Show some love and like the chart to support sharing !!

NSE:GREENPANEL Cup&Handle BO !!NSE:GREENPANEL formed beautiful Cup&Handle BO and looking good.
All the potential levels marked !!!

RUNE: Breakout after BreakoutHello friends!
Few days ago I've put BINANCE:RUNEUSDT on my list cause I've seen it to be close to the breakout of the new short-term resistance formed on 1h TF. Interestingly enough, it had just broke out of the long going resistance level two weeks ago, went through the point of BoS (Breaking of structure) (by creating the new higher high after the one that has been under that previous resistance at 1.969) and by this moment it is creating the new Higher Low.
Again, interestingly enough, while forming the new lower low it is creating the new zone of interest by creating this new resistance I was talking about and actually breaking through it. At this particular moment, the breakout isn't yet totally confirmed cause it hasn't gone through the new BoS, but this point might be this new higher low.
So:
If you are risky enough, consider the Entry 1 Zone with the Stop Loss below the previous Low. In case if the Higher Low isn't yet catched, the price can go to the zone of $1.2-1. Consider re-entering at that point.
If you don't like the risk - wait until the break of structure will be confirmed and consider Entry 2.
First Targets will be within the fulfilling of the wick that led us to the previous BoS. Fulfilling it strongly will most probably lead RUNE to the next zone: $2.9-3.1

Ibulhsgfin buying opportunityA favorable risk-to-reward ratio opportunity can be seen in this stock which is nearing a breakout from flag pattern with increasing volume support.
Buy Entry - Above 175
Target - 205
Stop Loss - 163

Long term BreakoutThe stock has broken a 4 year downtrend with 7x volumes. Buy ar 112 for a short term target of 158/198/344

Nelco Planning to Launch in the Space after Chandrayan-3 SuccessFalling Wedge Breakout
Fundamentally Strong Company
Target 1: 955
About the Company:
Nelco, a part of Tata Group, started in 1940 as a electronics company. Nelco offers solutions in areas of VSAT connectivity, Satcom Projects and Integrated Security & Surveillance Solutions

EURCAD Short Order 😲Hello everyone,
Short trade/
Trend breakout, in my opinion buy after the market will open in one descending chart.
In my opinion :
TP 1.45500
SL 1.48000
Thank You, and Goodluck.
I will appreciate your Like & Follow us. 💓 💓 💓

Life time High fundamental Let's begin analysis
Today stock SHALBY Ltd
•This stock was listed in DECEMBER 2017 but stock at 210 level work for that time as support but 2018 March this support break down 40 level it's 400+% down from High level.
•after 400% down stock trying hit and breakout 210 level in August 2021 but it work as resistance.
•stock come upto 100 leve from resistance level of 210, from 100 level stock creating higher high and High low formation.
•Now stock break resistance of 210 with High valume, the valumes are given idea about accumulation of the stock.
•keeping 185 as Stop loss get chance 280+, stock life time High also 270
•risk reward ratio 1:2
no recommendation for but and sell

JULY 26 RECOMMENDATION FOLLOW US
Product Portfolio
The Co. is engaged in the manufacturing of agricultural tractors, engines for agricultural tractors, construction, earthmoving and material handling equipment, round and flat tubes, heating elements, double-acting hydraulic shock absorbers for railways coaches, centre buffer couplers, automobile shock absorbers, telescopic front fork & Mcpherson struts, brake block, internal combustion engines and all types of brake used by railways.
Market Share
Agri Machinery: The Co. has a ~10.3% domestic market share in the manufacturing of tractors as of March 2022 against 11.3% in March 2021. The capacity utilization in FY22 stood at 75%.
Construction Equipment: The Co. has a market share of ~43% in the manufacture of Cranes and 12.6% market share in the manufacture of compactor and 2.3% market share in the manufacturing of BHL. During FY22, the segment operated at a capacity utilization of 42%.

EURUSD Still downtrendShort Position in my opinion.
EURUSD Still downtrend.
Break some important area.

Breakout stock life time High Weakly chart
1) Life time High working as resistance for the stock but now breakout at 228-230 level.
2) Channel pattern follow and now breakout.
3) Higher high and higher low formation.
4) 2018 and channel pattern breakout with High valume
5) global market in down but this stock breaking life time High so the have potential to create new life time High
6) stock may be take advantage of government development just resently announced by PM Modi
7) keep stop loss of 175-180
8) my Target to be 500 is the sentiments resistance
9) risk reward fit 1:6
10) 50SMA 170 this can be considered for stop loss
11) SMA 100 152
12) SMA 200 98
NO RECOMMENDATION FOR BUY OR SELL

BTCUSDT heavy dump ahead Soon last support zones here will break and after that heavy dump is ahead like the red arrows on chart and first support is 29K$ support zone and the second one is green trendline.
DISCLAIMER: ((trade based on your own decision))
<

How to trade Fake Breakouts in the range Range trading, characterized by price oscillations within defined support and resistance levels, offers traders a structured approach in sideways markets. However, even within these stable waves, deceptive price movements known as fake breakouts can occur. These false signals can lead traders astray if not properly recognized and managed. In this article, we'll delve into the world of fake breakouts within range trading, equipping you with strategies to identify and navigate these misleading market dynamics.
Understanding Fake Breakouts:
A fake breakout occurs when price seemingly breaches a support or resistance level but quickly reverses back into the established range. These deceptive moves often trigger stop-loss orders and entice traders into taking positions in the direction of the apparent breakout, only to experience a sudden reversal against their trades. Fake breakouts are fueled by market manipulation, emotional trading, or sudden news events.
Here are few examples of fake breakouts in big Time-frames :
Often, this is not enough for entering a position.
Combine this with divergences on RSI or other factors for entry.
Key Characteristics of Fake Breakouts:
Swift Reversal: A true breakout sustains its direction, while a fake breakout swiftly reverses back into the range.
High Volatility: Fake breakouts often coincide with spikes in volatility due to market confusion and emotional reactions.
Trapped Traders: Traders who entered positions based on the fake breakout are "trapped" when the market reverses, leading to potential losses.
Navigating Fake Breakouts:
Confirmation Through Candlesticks: Wait for candlestick confirmation beyond the breakout level. A close above resistance or below support lends greater credibility to the breakout.
Increased Volume: Look for a surge in trading volume accompanying the breakout, indicating genuine market participation.
Use of Indicators: Rely on technical indicators like the Relative Strength Index (RSI) or Moving Average Convergence Divergence (MACD) to validate breakout momentum.
Strategies for Trading Fake Breakouts:
False Breakout Reversal: Enter positions in the opposite direction of the fake breakout when price returns to the range, targeting a retracement towards the opposite boundary.
Wait-and-Watch Approach: Allow the breakout to develop and wait for confirmation before entering a trade, avoiding pre-mature positions.
Risk Management When Dealing with Fake Breakouts:
Tight Stop-Loss: Set a tight stop-loss order beyond the breakout point to limit potential losses if the breakout reverses.
Position Sizing: Allocate a smaller portion of your capital to trades involving potential fake breakouts due to the increased risk.
Pros and Cons of Trading Fake Breakouts:
👍 Pros:
Opportunities in Deception: Skilled traders can capitalize on market deception by trading against fake breakouts.
Enhanced Risk Management: Proper identification of fake breakouts allows traders to minimize losses through tight stop-loss orders.
👎 Cons:
Increased Complexity: Identifying fake breakouts requires additional analysis and indicators.
Risk of Mistakes: Mistaking a genuine breakout for a fake one or vice versa can lead to missed opportunities or losses.
