ETHUSD Potential Breakout Trade SetupETHUSD breakout trade on either side, if broke resistance or support. Place TP and SL with buy stop and sell stop orders.
Breakoutsignal

USDJPY Trend Shift Short Trade SetupOn the 1 hour timeframe USDJPY has shifted from making higher highs and higher lows to barely making any higher highs and now broke the recent swing high.It also found resistance at an important level and made fake higher highs which immediately reversed.The uptrend has ran out of steam and a new downtrend has started.I believe it now a good time to take a short trade and profit from this downtrend as it is still early and at the time of writing this we have a retest at the previous support level that has turned to resistance.There is also a clear RSI divergence emphasising the bearish market.As for stop loss I recommend you set it at around the 141.760 level above the wick of the red candle and for take profit price previously struggled to break a resistance level at around the 140.240 level so this is where I have set my take profit.
This is not a financial advice.Always do your own research.

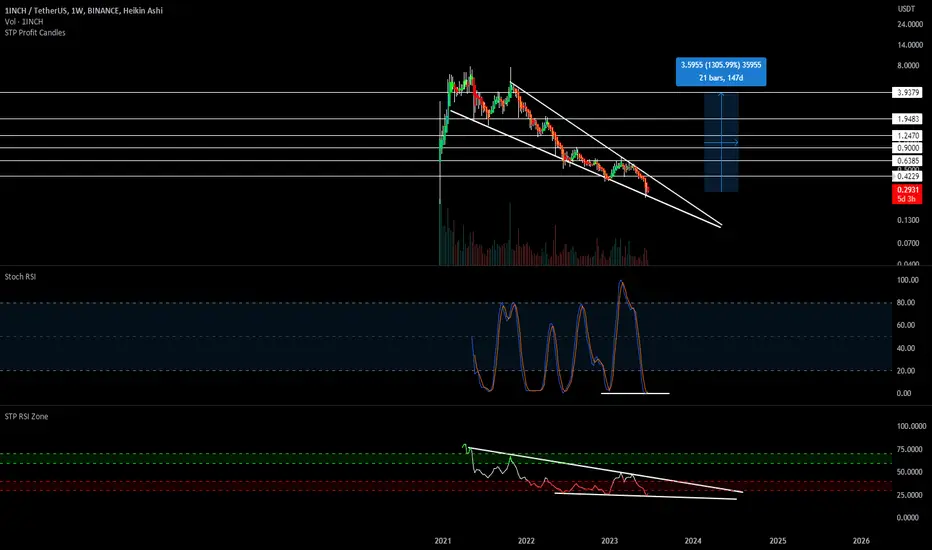
📉 Falling Wedge Alert on $1INCH! Reversal Potential!Hey traders! Today, I want to discuss an intriguing chart pattern I've identified on $1INCH. Let's explore the falling wedge pattern and its implications, particularly in relation to the parabolic trend. 📊💡
Pattern: Falling Wedge 📉🔽
Symbol: CRYPTOCAP:1INCH 💰
Overview:
A falling wedge is a bullish chart pattern characterized by converging trendlines, with the upper trendline sloping downward and the lower trendline sloping upward. The presence of the parabolic trend further adds to the potential reversal scenario. Let's delve into the falling wedge pattern on CRYPTOCAP:1INCH in more detail. ⚡💹
Key Features of the Falling Wedge on CRYPTOCAP:1INCH :
Converging Trendlines: The upper trendline connects lower highs, while the lower trendline connects higher lows, indicating a potential shift in market sentiment. 📈📉
Parabolic Trend Support: Notice that CRYPTOCAP:1INCH is currently holding the parabolic trend, which reinforces the bullish outlook and strengthens the potential reversal signal. 🚀📈
Breakout Expectations:
Falling wedge patterns often precede bullish breakouts. To confirm the pattern, traders typically look for a decisive move above the upper trendline. It is essential to wait for a confirmed breakout before considering any trades. 🚀📈
Trading Strategy:
Entry Point: Consider entering a long position once CRYPTOCAP:1INCH successfully breaks above the upper trendline of the falling wedge pattern, supported by the parabolic trend. This breakout could indicate a potential reversal and continuation of the upward trend. ⬆️💰
Stop-Loss: To manage risk, set a stop-loss order below the lower trendline, protecting against potential downside. ⛔️📉
Target Levels: Identify key resistance levels or previous swing highs as profit targets. Adjust your position size and take profits accordingly. 🎯📈
Risk Management:
Implement proper risk management techniques, such as position sizing, setting stop-loss orders, and adhering to your trading plan. Always be aware of the inherent risks associated with trading cryptocurrencies like $1INCH. ⚠️💼💡
Disclaimer: Trading cryptocurrencies carries risks, and it is crucial to conduct thorough analysis and seek professional advice before making any investment decisions.
#FallingWedge #1INCH #Cryptocurrency #ParabolicTrend #BullishReversal #TradingStrategy #TechnicalAnalysis #ProfitTargets #RiskManagement
In conclusion, the falling wedge pattern identified on CRYPTOCAP:1INCH , combined with the parabolic trend, suggests a potential bullish reversal. Exercise caution and wait for a confirmed breakout before making any trading decisions. Stay tuned for further updates on $1INCH! 🚀💹
(Note: This post is for informational purposes only and should not be considered as financial advice.) 💡💼📚
SPY - Rising Trend Channel [MID TERM]🔹Breakout the rising trend up in the medium long term.
🔹Support at 430 and resistance at 460.
🔹Positive signal from rectangle formation at 436 breakup, continue looking at next resistance 477.
🔹Short-term momentum is positive with RSI above 70.
🔹Technically positive for medium-term long-term.
Chart Pattern;
🔹DT - Double Top | BEARISH | 🔴
🔹DB - Double Bottom | BULLISH | 🟢
🔹HNS - Head & Shoulder | BEARISH | 🔴
🔹REC - Rectangle | 🔵
🔹iHNS - inverse head & Shoulder | BULLISH | 🟢
Verify it first and believe later.
WavePoint ❤️

TQQQ - Rising Trend Channel [MID TERM]🔹TQQQ has broken the rising trend up in the medium long term
🔹Broken up through resistance 39.
🔹Support at 39.
🔹Short-term momentum is positive with RSI above 70.
🔹Technically positive for medium-term long-term
Chart Pattern;
🔹DT - Double Top | BEARISH | 🔴
🔹DB - Double Bottom | BULLISH | 🟢
🔹HNS - Head & Shoulder | BEARISH | 🔴
🔹REC - Rectangle | 🔵
🔹iHNS - inverse head & Shoulder | BULLISH | 🟢
Verify it first and believe later.
WavePoint ❤️

AUDUSD POTENTIAL FOR HIGHER HIGH!!Check the chart for the Description.
Audusd shows strong bullish momentum and pushing towards a higher high. Soon to break, wait for market to RETEST then make your decision based on the candle sticks that show

GBPUSD I Bearish breakout scalping ideaWelcome back! Let me know your thoughts in the comments!
** GBPUSD Analysis - Listen to video!
We recommend that you keep this pair on your watchlist and enter when the entry criteria of your strategy is met.
Please support this idea with a LIKE and COMMENT if you find it useful and Click "Follow" on our profile if you'd like these trade ideas delivered straight to your email in the future.
Thanks for your continued support!

GE POWER double bottom breakoutCMP 156.15 | Strong Momentum: Price above short, medium and long term moving averages | RSI indicating price strength
*Not recommendation. Do your due diligence
👉All updates/posts are only for education and learning purpose and are personal views
👉 Always Consult your financial advisor before taking trades or investment decisions

EURGBP I Headed to retest demand zone and will possibly break itWelcome back! Let me know your thoughts in the comments!
** EURGBP Analysis - Listen to video!
We recommend that you keep this pair on your watchlist and enter when the entry criteria of your strategy is met.
Please support this idea with a LIKE and COMMENT if you find it useful and Click "Follow" on our profile if you'd like these trade ideas delivered straight to your email in the future.
Thanks for your continued support!

XAUUSD Potential Breakout TradeGold testing againg major resistance of 1967 and if breaks we can see gold around 1973.

Good prospect on Suryarosni for longCould see it took support on trend line looking towards resistance break around 854-860 .
If it breakout then it can rally till 1050.
Note: this is only for learning purpose and not for any recommendations.

NZDCAD Potential Breakout Trade SetupNZDCAD is about to break its range please place buy and sell order to take trade.
Manage your risk accordingly.

$ANF bullish breakout positive earnings reactionNYSE:ANF - many bullish indication and price action.
Possible resumption of Stage 2 uptrend
Teal moving average line is 30MA
Bottom panel: Mansfield Relative Strength

SAND Looks Ready to Breakout!Traders,
SAND is in prime position to move even higher than it already has these past few weeks. I haven't entered this trade yet but may soon pending these occurrences:
I want to see a move above the 200 day ma with confirmation
I want to see a break above the red descending TL
I want to see a move above the Ichimoku cloud
What we have:
A breakout of the triangle in Logarithmic View. Click the "Log" text in the bottom left corner of the chart to see this view.
What I don't like:
RSI nearing oversold
Let me know in the comments if/when you decide to enter this trade.
Stew

MRVL - Breakout Falling Trend Channel🔹MRVL has broken through the ceiling of a falling trend channel in the medium long term.
🔹MRVL has broken the resistance at 52.82 of a rectangle pattern, which signals a further rise.
🔹The short term momentum of the stock is strongly positive, with RSI above 70.
🔹Overall assessed as technically positive for the medium long term.
Chart Pattern;
🔹DT - Double Top | BEARISH | 🔴
🔹DB - Double Bottom | BULLISH | 🟢
🔹HNS - Head & Shoulder | BEARISH | 🔴
🔹REC - Rectangle | 🔵
🔹iHNS - inverse head & Shoulder | BULLISH | 🟢
Verify it first and believe later.
WavePoint ❤️

AMZN - Breakout Rising Trend Channel🔹AMZN has broken the rising trend up in the medium long term.
🔹The moving average indicator has also given a positive signal.
🔹AMZN has support at 113 and resistance at 136.
🔹Overall assessed as technically positive for the medium long term.
Chart Pattern;
🔹DT - Double Top | BEARISH | 🔴
🔹DB - Double Bottom | BULLISH | 🟢
🔹HNS - Head & Shoulder | BEARISH | 🔴
🔹REC - Rectangle | 🔵
🔹iHNS - inverse head & Shoulder | BULLISH | 🟢
Verify it first and believe later.
WavePoint ❤️

MSFT - Breakout Rising Trend Channel🔹MSFT has broken the rising trend up in the medium long term, which indicates an even stronger rising rate.
🔹Positive volume balance, with high volume on days of rising prices and low volume on days of falling prices, strengthens the stock in the short term.
🔹RSI is above 70 after a good price increase the past weeks.
🔹High RSI may be a sign that the stock is overbought and that there is a chance of a reaction downwards.
🔹Overall assessed as technically positive for the medium long term.
Chart Pattern;
🔹DT - Double Top | BEARISH | 🔴
🔹DB - Double Bottom | BULLISH | 🟢
🔹HNS - Head & Shoulder | BEARISH | 🔴
🔹REC - Rectangle | 🔵
🔹iHNS - inverse head & Shoulder | BULLISH | 🟢
Verify it first and believe later.
WavePoint ❤️

Necklace Pattern Series- "Bector Foods"How nicely Necklace Pattern is being shaped.
A Necklace is when stock goes down 90% & reaches back to its old lifetime High...Monthly TF clearly indicates target above Life Time High! Its re-claiming its past glory!
This is also called as rounded bottom, but since its re-claiming its old High, its no more a bottom, right?

Trapped Gold has No Look, it has no Where to Go!!!!!!
These zones and perspectives offer valuable insights on how to trade within this area. They present opportunities for quick scalping trades, taking advantage of short-term price movements. Additionally, when the price reaches favorable trade-up zones, it is advisable to consider holding positions and potentially increasing trade size through scaling in. This approach allows for potential profit maximization in these advantageous areas.

ABFRL POSSIBLE WAVE COUNTS - ADITYA BIRLA FASHION AND RETAILHello Friends,
Today I am sharing my view on Aditya Birla Fashion And Retail Limited.
ABFRL is now ready for new long positions as per Elliot Wave structure.
It is suppose to complete WAVE ABC as Expanded Flat Correction which usually comes in 3-3-5 waves.
Now price is in 5th wave of corrective wave ABC which any time get reversal from downtrend to uptrend.
MACD showing strength as price is making lower low but macd makiing higher low
similar Scenario with RSI
confirmation of reversal
One can make new long positions in ABFRL after the breakout of wedge pattern.
Disclaimer
I am not SEBI registered analyst.
all the studies are for educational purposes.
I am not responsible for any kind of your profits and losses.

MU - Breakout Falling Trend Channel- MU has broken through the ceiling of a falling trend channel in the medium long term.
- MU is moving within a rectangle formation between support at 59.43 and resistance at 64.83.
- MU has given a positive signal from the rectangle formation by a break up through the resistance at 63.13.
- The stock is testing resistance at 64.00.
- Overall assessed as technically neutral for the medium long term.
*EP: Enter Price, SL: Support, TP: Take Profit, CL: Cut Loss, TF: Time Frame, RST: Resistance, RTS: Resistance to be Support LT TP: Long Term Target Price
*Chart Pattern:
DT - Double Top | BEARISH | RED
DB - Double Bottom | BULLISH | GREEN
HNS - Head & Shoulder | BEARISH | RED
REC - Rectangle | BLUE
iHNS - inverse head & Shoulder | BULLISH | GREEN
Verify it first and believe later.
WavePoint ❤️

Solana following Elliot triangle (ABCDE)Solana might be following the Elliot triangle (ABCDE). At the end of E it will follow a strong uptrend that can go from around 17 upto 50 USD value.

GOOG - Breakout Falling Trend Channel- GOOG has broken through the ceiling of a falling trend channel in the medium long term.
- This indicates a slower falling rate initially, or the start of a more horizontal development.
- GOOG has support at 106 and resistance at 123.
- Positive volume balance strengthens the stock in the short term.
- Overall assessed as technically neutral for the medium long term.
*EP: Enter Price, SL: Support, TP: Take Profit, CL: Cut Loss, TF: Time Frame, RST: Resistance, RTS: Resistance to be Support LT TP: Long Term Target Price
*Chart Pattern:
DT - Double Top | BEARISH | RED
DB - Double Bottom | BULLISH | GREEN
HNS - Head & Shoulder | BEARISH | RED
REC - Rectangle | BLUE
iHNS - inverse head & Shoulder | BULLISH | GREEN
Verify it first and believe later.
WavePoint ❤️
