$ENZ to $2.94 LONG - Monthly setup is strong3/16/23 - Enzo Biochem (ENZ) stock is rising higher on an asset sale agreement.
It’s selling its Clinical Laboratory division to Labcorp (LH).
3/20/23 - Monthly GD on MC.
8/23/23 - $3 per share.
Breakoutsignal

AUDNZD: Weak Order BlockWhen price is delivered to a demand zone with compression, it suggests the zone will not hold.
I will be selling past this block either now or when we clear the 'x' point.
Updates to follow.


after result wage breakout nas100hello traders i have played the breakout on nas100 i sometimes enter on the break or the prebreak depending on how comfortable i am all trades smashed today it is possible once you learn it and get the right information from the right people then trading will be less stressful follow more

BTC 26800 to Pullback to 22600 after Recent Bullish Momentum?Bitcoin has experienced a sudden bullish reaction, breaking through the 26k level, which is a positive sign for buyers who gain more confidence in the current market. However, although the price managed to surpass the important resistance at 26,400, it failed to close above this level. The day closed at a range of 24,680, indicating that buyers are likely to experience a short-term sideways movement at this resistance range.
During this period, the bulls may still reach the 26,800 price range, but this could also result in a pullback to 22,600, which will be a decision point for the current bullish momentum. If the momentum continues, Bitcoin could reach the 28k to 32k resistance area. The current week started on a bullish note, and the closing of the current weekly candle will determine if this is a sustainable trend or a trap. There is a possible technical analysis (TA) of 28k next if the 26,800 resistance is conquered.
Shorting the current price reaction to 26,400 may fail, as the current hanging man on that resistance is not enough assurance that the price will get rejected immediately. However, if the buyers fail on the second rejection, this could lead to a deeper pullback with a TA of 22,600 and 20,800.

MSFT - Falling Trend [MIDTERM]- MSFT has broken the ceiling of the falling trend in the medium long term, which indicates a slower initial falling rate.
- MSFT has broken up through resistance at 257.
- This predicts a further rise.
- Positive volume balance indicates that buyers are aggressive while sellers are passive, and strengthens the stock.
- MSFT is overall assessed as technically positive for the medium long term.
*EP: Enter Price, SL: Support, TP: Take Profit, CL: Cut loss, TF: Time Frame, RST: Resistance, LT TP: Long term target price

CABLE STR INCOur cable trade from several days ago is playing out BEAUTIFULLY
lets see if we can get some SUPPORT STRUCTURE tomorrow with CPI
Hopefully anyone who missed out can get in before the main rally

WELL - keep an eye on thisIf breaks upper resistance - could push up hard...
Details on the chart,
Good luck traders

ESFB (Long)Good volume build up in this stock
Breakout of resistance zone
Best Q3 results
Great Potential stock
Face value 10 so can split in future
Great promoter and MF holdings
Cmp 69
Initial target 75 then trail SL
Initial Sl below 63

HAVELLS Bullish Trendline Breakout
Havells is ready to continue its bullish trend with trendline breakout on daily chart

NATIONALUM Daily Chart - Accumulation Zone Breakout
National Aluminium has given breakout of 9 months old trendline as well as the accumulation zone. for nearest target of 98-100.


META Simple Chart AnalysisMeta - Rst 196.9 Supp 167.6
Meta will retest back 196.9 area here & attempt a breakout.

AUDJPY: Supply vs Demand Battle Price has rejected, manipulated and trapped sellers multiple times from this supply, sweeping liquidity from the zone.
The only liquidity left will be the stops trapped above the zone.
I don't think we will penetrate these stops immediately.
I believe price will compress into the demand and liquidate that zone aggressively before returning to purge sellers, as illustrated on my chart.

BTCUSD BUY!!!Bitcoin has been bullish for the past few days. Lets wait for a break above 23350 then we take buys. I already took buys at the current market position.
Lets use proper risk management, risk no more than 2%.
TAKE PROFIT WILL BE AT THE NEXT RESISTANCE POINT : 24800


GMM next push up possible soonCoiling up after an amazing run-up. Set alerts, could be really profitable.
Details on the chart
Good luck traders

SUSHI USDT BULLISH TREND IN I HR TFBINANCE:SUSHIUSDTPERP Bullish Trend 1 HR TF, wait for break the level.

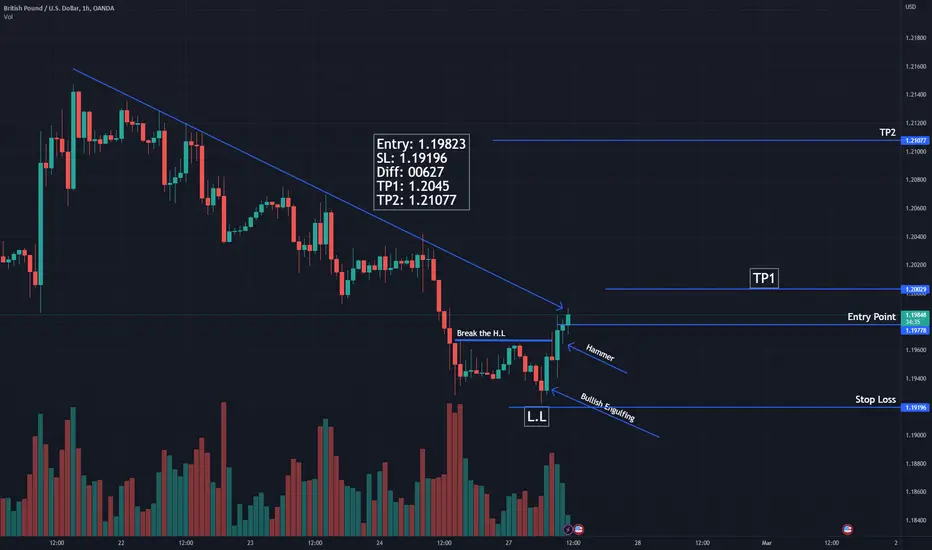
GBPUSD Bullish Trend Start in 1 HR TF.OANDA:GBPUSD On this chart, the first candle is a Bullish Engulfing Candle, and the second candle is a Hammer Candle. Mean buyers dominate the market at this time. GBP IUSD Break of previous Higher Low
Xau/UsdHello traders! In my opinion, this pair is sell.
Targets:
Sell 1786.50 (pivot)
Sell 1760.00
Sell 1720.00
Be careful and wait for a confirmation!
Don`t forget to look at the economic calendar!
MAKE MONEY AND ENJOY LIFE 💰
THANK YOU!
GOOD LUCK!
🙏🏻🙏🏻🙏🏻

PAYTM Expecting paytm to make a fresh move from here with the rumour of airtel investment in paytm.
Neat and clean Breakout on weekly chart with completion of retest done ✅
Breakout Volume Increase 💪
CMP 623
TGT 750-800+
Note: Just an idea not any recommendation to buy or sell the particular stock.

OGNUSDT needs the breakout!OGNUSDT is testing the descending channel below the static resistance level.
A descending channel is a technical analysis pattern that consists of two downward sloping trendlines. The upper trendline represents resistance, while the lower trendline represents support. In this case, the price of OGNUSDT is testing the lower trendline of the descending channel, which indicates a bearish trend.
Additionally, the static resistance level indicates an area where sellers are likely to take control of the price, making it difficult for buyers to push the price higher. If the price of OGNUSDT breaks above this level, it could signify a shift in momentum and the potential for a bullish trend.
To confirm a bullish trend, traders would need to wait for a breakout from the descending channel that satisfies Plancton's rules. Plancton's rules are a set of technical analysis guidelines that aim to identify high-probability trading opportunities. These rules include looking for strong trends, clear price patterns, and confirmation.
In summary, the current situation for OGNUSDT suggests a bearish trend within a descending channel below the static resistance level. Traders should watch for a breakout from the descending channel that satisfies Plancton's rules before entering a long position.
–––––
Follow the Shrimp 🦐
Keep in mind.
🟣 Purple structure -> Monthly structure.
🔴 Red structure -> Weekly structure.
🔵 Blue structure -> Daily structure.
🟡 Yellow structure -> 4h structure.
⚫️ Black structure -> <= 1h structure.
Follow the Shrimp 🦐

FCPO PALM CRUDE OIL INDEX BURSA MALAYSIABottom reversal pattern has been form on week 03-Oct-2022
Currently FCPO price in sideway range between 3730 (support)- 4500 (resistant)
Trade Strategy: (BUY / CALL)
Once FCPO price break out & goes beyond price 4500 with increasing volume.
TP1: 4990
TP2: 6230
CL: 3730
Risk Ratio Reward - 1 : 2
Fact supporting indicator:
Smart Money Pro bullish Profit-Chip (red bar) continuous increases for 3weeks and crossed over Profit-Chip Moving Average line.
#bursasaham #malaysiastockmarket #fcpo #palmcrude #bursamalaysia #malaysia #bursa
#trendline #trendanalysis #technicalanalysis #chartpattern #trendpattern #uptrend #bullbear
#supportresistance #technicalindicator #indicator #waveanalysis #bottomcatch #reversalsignal
Disclaimer:
This published Idea is solely for the purpose of education and opinion sharing, and should not be construed as investment advice or recommendations to buy or sell any security.
Get your trade advise from a legit broker, you are responsible on your own trade.
