TRADE ALERT LONG YFI
Position = YFI
Entry = 10131
Stop Loss = 7737
Final Target = 19437
Risk/Reward = 6/1
Leverage = 3x
Profit Potential = +150%
Breakoutsignal

Lt chart breakoutLt given breakout at resistance level.
If closes at day high.. Net target will be 2030 and 2070.
This is for study purpose only

MACRO TECH(LODHA) ANALYSIS!!i have drawn perious waves, to understand how the stock moved.
plus the rectangle figure is the range for the breakouts.
i have even put the moving averages for your analysis .
(red one- 50MA, blue one - 100MA).

XRP: If we break we buy!!XRP
Intraday - We look to Buy a break of 0.3601 (stop at 0.3544)
A break of bespoke resistance at 0.3600, and the move higher is already underway. Short term bias is mildly bullish. Trading has been mixed and volatile. Our short term bias remains positive.
Our profit targets will be 0.3749 and 0.3799
Resistance: 0.3600 / 0.3700 / 0.3800
Support: 0.3500 / 0.3450 / 0.3400
Please be advised that the information presented on TradingView is provided to Vantage (‘Vantage Global Limited’, ‘we’) by a third-party provider (‘Signal Centre’) . Please be reminded that you are solely responsible for the trading decisions on your account. There is a very high degree of risk involved in trading. Any information and/or content is intended entirely for research, educational and informational purposes only and does not constitute investment or consultation advice or investment strategy. The information is not tailored to the investment needs of any specific person and therefore does not involve a consideration of any of the investment objectives, financial situation or needs of any viewer that may receive it. Kindly also note that past performance is not a reliable indicator of future results. Actual results may differ materially from those anticipated in forward-looking or past performance statements. We assume no liability as to the accuracy or completeness of any of the information and/or content provided herein and the Company cannot be held responsible for any omission, mistake nor for any loss or damage including without limitation to any loss of profit which may arise from reliance on any information supplied by Signal Centre.

SAND- Lets All Play In The SandboxAnalysis:
- Support & Resistance
- Trend Line
- Supply & Demand
- Fibonacci Retracement
- Order Block Flow
T1: Target 1
T2: Target 2
B: Bottom / End of Correction / Beginning of Bull Run
S: Support
:) Breakout / Bull Run
Opinion:
The correction for Sandbox is over and price will rise the next few weeks/months

LATENT View is on verge of breakout Volumes increasing
Given downtrend breakout
A close about 430 can take it to 465 in no time
stay tuned

BEL - Possible move towards ATH Key highlights:
⚡️ Symmetrical Triangle
⚡️ Support from Flip zone
⚡️ Bullish market structure
⚡️ Volume expansion
A logical setup is to enter on the retest of 240 zone on lower time frames.
Aggressive stoploss: 237
Safe stoploss: 230
Disclaimer : This is NOT investment advice. This post is meant for learning purposes only. Invest your capital at your own risk.
Happy learning. Cheers!
Rajat Kumar Singh (@johntradingwick)
Community Manager (India), TradingView

GLMR BREAKOUT GLMR in the push for a breakout from this triangle... Not bad looking volume.
Good luck traders

URA etf Ready to breakout from resistanceURA ETF Ready to breakout from multi month resistance resistance. This group is one of the leading groups next to solar.

TAN Solar Etf Breakout readyTAN Solar Etf Breakout ready. Since market is better perhaps we will see a nice breakout. Solar is Leading market group.

RUN ready to breakout of stage 1RUN ready to breakout of stage 1. Part of the solar group leading the market. See TAN etf ready to break out.

ENPH waiting for another breakout attemptEHPH building nice congestion on WK. Can be considered a flag on D. IBD highly rated stock. Part of TAN etf (Solar group) congesting after diagonal breakout.

Valiant Cup and Handle breakout coming soonReversal pattern found in Valiant Organic
Cup and handle
Breakout above 735
Stay tuned

TRADE ALERT - LONG CULTTraders,
If I can actually hold this to my final target, I would be looking at %135 gainz! Sounds unbelievable right? Well, CULT has done it before and with a great support floor beneath it, entry into the higher risk #altcoin becomes much easier!
Position = CULT
Entry = .00000864
Stop Loss = .0000075
Final Target = .000019806
Risk/Reward = 13/1
Leverage = 1x
Profit Potential = +135%
Best of luck traders!
Stew

CARE Flag, Cup and handle brokenCanslim IBD A+ stock broke handle. If market good tomorrow. Classic cup and handle

SHLS close to diagonal resistance.SHLS close to diagonal resistance. IBD A+ stock. If it goes over resistance its a buy. Watch for few days

Inverted head and shoulder spottedInverted head and shoulder spotted
stay tuned with a close above 770
Decent volumes

FACT looks like have further upside possibleSomething is cooking here
Volumes increasing, have given an trendline breakout already
Resistance breakout
Have retested the support/resistance

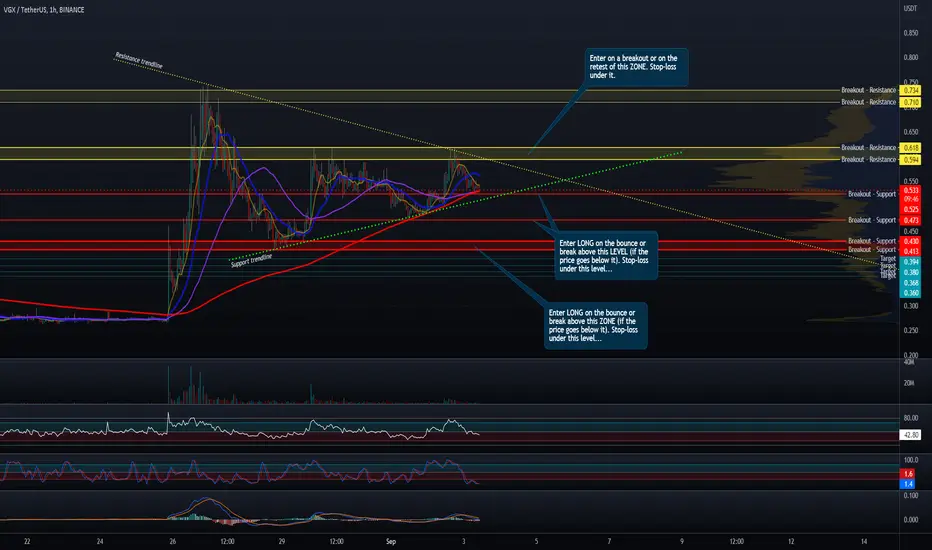
Symmetrical or ascending?Ascending triangle could be forming inside a symmetrical one... VGX gave us 20% in the last trade, and this could be a nice one also... Levels and instructions are on the chart...The hourly oscillator looks ready.. Set alarms, weekend action...
Good luck traders!
NIACL looks good for 10%A trend reversal spotted breakout of resistance
and breakout of trendline
with volumes

W pattern breakout on the way !!Csb bank look very good at technical chart we see in day chart of csb Bank 2 thinks 1st was W pattern and 2nd was cup handle pattern in 1day chart
buy it above 220
Target 230 240 263
Sl 195/194
It was very good for long term
Must buy it after the breakout!!

MHRIL - Mahindra Holidays Looking good with good volume
tracking for short to mid term..multiyear breakout
*Not recommendation. Please do your due diligence

VGXLook interesting, can move nice... Watch for support resistance levels. Best entry at support bounce or trendline breakout. Set alarms for this one, It might take some time
Good luck traders
