Bearish Divergence on Weekly TF but... there is a Breakout..Bearish Divergence on Weekly TF.
However, Breakout on Daily TF from 452 - 453.
Weekly Closing above this level would
be a positive sign.
Upside Targets can be around 495 - 500
& if this level is Sustained, with Good
Volumes , we may witness 540 - 550.
Should not break 400, otherwise, we may see
heavy Selling pressure.
Breakoutsignal

BreakoutBreakout on Daily TF.
Good Buying Range: 98 - 99
It has the potential to touch
110 - 113 initially.

Big pump incoming for XRPI send a signal for all to buy XRP as i said big changes is coming and the end of lawsuit with SEC had came to an end !!
XRP will hit over 3$ then passed over 5$ qnd its possible possible will hit 10$ worth of XRP.
Keep holding and dont sell

Gold (XAU/USD) Trade Update**Gold (XAU/USD).
### **Key Observations:**
✔ **Uptrend Strength:** Gold had a strong bullish move earlier, with a notable spike in volume.
✔ **Support & Resistance:**
- **Immediate support:** Around **$2,932 - $2,928** (black moving average line).
- **Resistance:** Around **$2,936 - $2,940**, where price struggled to break higher.
✔ **Moving Averages:**
- The **short-term (red & blue)** moving averages are trending upwards, signaling ongoing bullish momentum.
- The **long-term (black) moving average** remains below, supporting the uptrend.
### **Potential Scenarios:**
📈 **Bullish Case:** If Gold breaks above **$2,936 - $2,940**, it could re-test **$2,950** and move toward higher highs.
📉 **Bearish Case:** A break below **$2,928** could trigger a retest of lower supports near **$2,920 - $2,912**.

#BANANAUSDT maintains bearish momentum📉 Short BYBIT:BANANAUSDT.P from $14.905
🛡 Stop loss $15.490
🕒 1H Timeframe
⚡️ Overview:
➡️ The main POC (Point of Control) is at 16.112, indicating the area with the highest trading volume.
➡️ The 15.490 level acts as a local resistance, as the price previously faced selling pressure there.
➡️ The volume and market profile highlight areas of high trader activity, especially in the 14.250 – 15.500 range.
➡️ The chart shows a potential decline after an impulse move and profit-taking.
🎯 TP Targets:
💎 TP 1: $14.580
💎 TP 2: $14.250
💎 TP 3: $13.920
📢 Monitor key levels before entering the trade!
📢 If 15.490 is broken upward, the trade may be invalidated.
📢 If the price continues to decline and breaks through TP 1, the downside potential remains.
BYBIT:BANANAUSDT.P maintains bearish momentum — expecting further downside movement!

#RUNEUSDT is showing signs of growth📈 Long BYBIT:RUNEUSDT.P from $1.161
🛡 Stop loss $1.140
🕒 1H Timeframe
⚡️ Overview:
➡️ The main POC (Point of Control) is at 1.08, indicating the area with the highest trading volume.
➡️ The 1.154 level acts as a local support, as the price previously bounced from this zone.
➡️ The volume and market profile highlight areas of high trader activity, especially in the 1.100 – 1.161 range.
🎯 TP Targets:
💎 TP 1: $1.174
💎 TP 2: $1.185
💎 TP 3: $1.195
📢 Monitor key levels before entering the trade!
📢 If 1.140 is broken downward, the trade may be invalidated.
📢 If the price holds above 1.161 and continues rising, the bullish momentum remains intact.
BYBIT:RUNEUSDT.P is showing signs of growth — expecting further upside movement!

#XLMUSDT is showing signs of growth📈 Long BYBIT:XLMUSDT.P from $0.26325
🛡 Stop loss $0.25955
🕒 1H Timeframe
⚡️ Overview:
➡️ The main POC (Point of Control) is at 0.25511, indicating the area with the highest trading volume.
➡️ The 0.25955 level acts as a local support, as the price previously bounced from this zone.
➡️ The volume and market profile highlight areas of high trader activity, especially in the 0.24984 – 0.26325 range.
➡️ The chart shows a forming bullish structure, confirming the potential for further upward movement.
🎯 TP Targets:
💎 TP 1: $0.26630
💎 TP 2: $0.26930
💎 TP 3: $0.27240
📢 Monitor key levels before entering the trade!
📢 If 0.25955 is broken downward, the trade may be invalidated.
📢 If the price holds above 0.26325 and continues rising, the bullish momentum remains intact.
BYBIT:XLMUSDT.P is showing signs of growth—expecting further upside movement!

Possible rise in the US30 indexHello traders
The current impulse wave is upward and the correction is over. Another impulse wave may start upward from here.

GOLD TRADE UPDATE – Crucial Breakout Levels to Watch### **🚀 GOLD TRADE UPDATE – Crucial Breakout Levels to Watch ! 📊**
Gold is currently trading at **2915**, consolidating between **key support at 2912** and **resistance at 2920**. This means the market is at a critical decision point, and a breakout in either direction will determine the next major move.
---
## **📈 Bullish Scenario – Buy Setup**
If gold **breaks and closes above 2920**, it will confirm a **strong bullish momentum** and indicate that buyers have taken control. In this case:
🔹 **Entry:** Buy after a confirmed breakout above 2920
🔹 **Target 1 (TP1):** 2927
🔹 **Target 2 (TP2):** 2932
🔹 **Final Target (TP3):** 2937
### **Why?**
- A breakout above 2920 suggests strength in buyers and a continuation of the uptrend.
- The price could push toward higher resistance levels due to increased buying pressure.
---
## **📉 Bearish Scenario – Sell Setup**
If gold **breaks below 2912**, it confirms **bearish momentum**, signaling that sellers have taken over. In this case:
🔹 **Entry:** Sell after a confirmed breakdown below 2912
🔹 **Target 1 (TP1):** 2905
🔹 **Target 2 (TP2):** 2900
🔹 **Final Target (TP3):** 2895
### **Why?**
- A break below 2912 indicates weakness, pushing the price lower.
- The selling pressure could increase, leading to a drop toward the lower support levels.
---
## **📌 Trading Plan & Risk Management:**
✅ **Wait for a confirmed breakout (above 2920 for buy OR below 2912 for sell).**
✅ **Use stop-loss to avoid false breakouts (recommended SL: 10-15 pips from entry).**
✅ **Secure partial profits along the way to protect gains.**
✅ **Trade with proper risk management—never risk more than you can afford to lose.**
---
### **🔥 Final Thoughts:**
Gold is at a **critical level**, and the next move depends on whether the price **breaks support or resistance**. Be patient, wait for confirmation, and trade smartly to maximize profits while minimizing risk.
🚀 **Stay focused, manage risk, and catch the next big move!** 📈📉

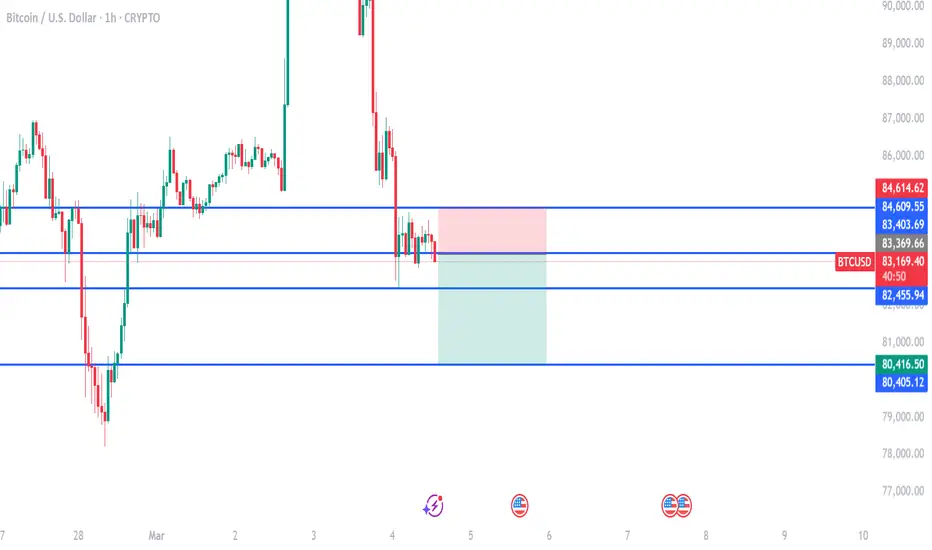
btc on bearish#BTCUSD price retrace back 95k which results in a failed bullish strength, now back at 83500.
Firstly we wait for breakout below 83400 to sell, take profit 82300-80400, stop loss 84600.
Above 84600 on double breakout have a strong bullish to recorrect 88k to 90k limit.
BTCUSD UPCOMING TREND UPWARD READ IN CAPTION Bitcoin (BTC/USD)* currently at *83,918*, with key levels marked for potential trades. The *resistance* is at *92,026*, while the *support zone* is near *76,129*. The price is expected to test the *resistance* before potentially moving down to the support. Watch for a possible *bullish move* towards *92,026* or a *downward correction* to *76,129

#IPUSDT – Long Setup, Testing Resistance ZoneLONG BYBIT:IPUSDT.P from $7.0000
🛡 Stop Loss: $6.6900
⏱ 1H Timeframe
✅ Market Analysis:
📍 The BYBIT:IPUSDT.P price is showing strong upward momentum, breaking key resistance levels.
📍 The asset has held above the $6.8982 level, which may confirm a continuation of the uptrend.
📍 POC (Point of Control) at $4.8742 – the highest volume area, previously serving as a consolidation point.
🎯 TP Targets:
💎 TP 1: $7.3100
🔥 TP 2: $7.6200
⚡ TP 3: $7.8600
📢 Holding above $6.8982 could confirm trend strength.
📢 A dip toward $6.6900 (stop loss) could be a fakeout – monitoring price action is crucial.
📢 The $7.3100 level is the first TP, where a retracement may occur before further upside.
📢 If the price breaks $7.6200, the move toward $7.8600 becomes more likely.
🚀 BYBIT:IPUSDT.P is showing strength – monitoring the $7.0000 breakout and securing profits as the price moves up.

#DOGEUSDT remains weak📉 SHORT BYBIT:DOGEUSDT.P from $0.23740
🛡 Stop Loss: $0.24040
⏱ 1H Timeframe
✅ Overview:
➡️ BYBIT:DOGEUSDT.P broke support and exited the rising wedge, signaling a bearish trend shift.
➡️ POC (Point of Control) at $0.25386 now acts as key resistance.
➡️ The price dropped sharply with increased volume, confirming strong selling pressure.
➡️ Liquidity has shifted lower, increasing the probability of continued downside movement.
⚡ Plan:
➡️ Enter short at $0.23740 after confirming downward momentum.
➡️ Stop-Loss set at $0.24040, above the nearest resistance level.
🎯 TP Targets:
💎 TP1: $0.23410
🔥 TP2: $0.23155
🚀 BYBIT:DOGEUSDT.P remains weak — expecting further decline toward key targets!

#ADAUSDT is forming a strong bullish trend📈 LONG BYBIT:ADAUSDT.P from $0.8110
🛡 Stop Loss: $0.8046
⏱ 1h Timeframe
🔹 Overview:
➡️ Price is showing a strong uptrend after a correction, forming a support zone and bouncing off the local trendline.
➡️ POC (Point of Control) at $0.7826 highlights the key volume area where the reversal occurred.
➡️ Key resistance levels are marked, indicating potential price targets.
➡️ Volume spikes confirm increased buyer interest, signaling momentum.
➡️ An impulse breakout is possible if buying pressure sustains at TP levels.
⚡ Plan:
➡️ Main scenario – long position with profit-taking at TP levels.
➡️ Expecting a breakout above $0.8110 and resistance level tests.
🎯 TP Targets:
💎 TP 1: $0.8160
🔥 TP 2: $0.8210
🚀 TP 3: $0.8262
📢 BYBIT:ADAUSDT.P is forming a strong bullish trend — preparing for resistance breakouts!

#ARCUSDT - Monitor this asset closely📈 LONG BYBIT:ARCUSDT.P from $0.25588
🛡 Stop Loss: $0.24176
⏱️ 1H Timeframe
✅ Overview:
➡️ BYBIT:ARCUSDT.P has broken out of a Falling Wedge pattern and is following an upward trend.
➡️ The POC (Point of Control) at $0.24041 confirms liquidity in this zone, potentially acting as strong support.
➡️ The key resistance is at $0.25588; if the price holds above this level, it may lead to further gains.
➡️ Increased volume signals strong buyer activity and a high probability of continuation.
⚡️ Plan:
➡️ Important: Set an order in advance to ensure execution when the price reaches the entry level!
➡️ Enter long above $0.25588.
➡️ Stop-Loss placed at $0.24176 for risk management.
🎯 TP Targets:
💎 TP1: $0.26618
🔥 TP2: $0.27640
⚡️ TP3: $0.28670
🚀 BYBIT:ARCUSDT.P - Monitor this asset closely!
🚀 Place your order in the listing so that it executes automatically when the breakout occurs.

$NYSE:BBAI 72% Upside - Breaking double bottom resistanceLooks like NYSE:BBAI is finally breaching the double bottom resistance line.
Volume is respectable, relatively higher.
Squeeze is starting to expand
MACD and Williams %R are also flowing in the right direction.
Entry point - anything after the stock closes above $4.81
Initial Price target is ~$8
72% Upside

$NASDAQ:APPS Breaking Out on Massive Volume 73%++ upsideNASDAQ:APPS is breaking out, having closed above the double bottom pattern resistance (at $4.64).
Entry: Any point now. If you want to get it at a more affordable price point, this may retest $4.64.
Price Targets:
$8.06 to complete the Double Bottom pattern 73% upside
$9.91 to complete the Falling Wedge pattern 113% upside

#AIXBTUSDT: Get Ready for a Breakout! Short Still the Priority?BYBIT:AIXBTUSDT.P is showing significant weakness after a prolonged downtrend, and now the market is at a critical level. Buyers failed to initiate even a minor rebound, indicating strong selling pressure.
🔎 Key Factors Right Now:
✔ Current Price: $0.23480
✔ Daily Change: -10.76%
✔ Key Levels:
🔹 Resistance: $0.38080, $0.31670
🔹 Support: $0.22063
━━━━━━━━━━━━━━━━━━━━━━
💡 Main Signals Influencing the Market:
📌 No rebound after the drop – the lack of buying pressure increases the chances of further decline.
📌 Empty space ahead – below $0.2206, there are no strong support zones, meaning a sharp drop could follow.
📌 Closing near a critical level – price remains at risk, increasing the likelihood of a breakdown.
📌 Breakout from consolidation – the asset has left its range, signaling the potential formation of a new trend.
━━━━━━━━━━━━━━━━━━━━━━
📉 Main Scenario: Continued Decline
🔻 If BYBIT:AIXBTUSDT.P breaks below $0.2206, the market may accelerate downward:
✅ Target 1: $0.2100 – the nearest technical support.
✅ Target 2: $0.1955 – a zone where a short-term bounce could occur.
✅ Target 3: $0.1780 – a major support level where stronger buyer resistance is expected.
📢 Short remains the priority as long as price stays below $0.2300.
A breakdown of $0.2206 could trigger liquidations and accelerate the drop.
Be cautious with long positions – there are no strong reversal signals yet.
━━━━━━━━━━━━━━━━━━━━━━
🟢 Alternative Scenario: Bullish Reversal
If BYBIT:AIXBTUSDT.P holds above $0.2300 and starts to recover, potential targets include:
✅ Target 1: $0.2700 – a local resistance zone.
✅ Target 2: $0.3167 – a level where a pullback is likely.
✅ Target 3: $0.3800 – a key resistance, breaking which could change the overall trend.
📢 A long entry is only valid if price holds above $0.2400.
Reversal confirmation requires an increase in volume and stability above $0.2500.
📢 As long as the price is below $0.2300 – long positions remain risky.
Conclusion : Critical Moment! Be Ready for a Sharp Move!
📌 BYBIT:AIXBTUSDT.P is at a make-or-break level – any move could lead to an explosive price shift.
📌 Sellers remain in control, but if $0.2300 holds, an unexpected rebound could happen.
📌 Short remains the main scenario, unless price successfully stabilizes above $0.2400.
🚀 Get ready for a major move! Watch $0.2206 closely – this level will determine BYBIT:AIXBTUSDT.P is next direction! 🔥

LAZR consolidation complete! Strong buy setup!Solid base built over last several weeks.
Consolidation now complete. Ready to run to 12.8$ target likely into March timeframe given today’s breakout above 6.20
Will likely consolidate a bit more after 12.8 is reached, before continuation to 20-22$ buy-side targets later in 2025.
Great longer term swing trade from here!

#BILLYUSDT remains in a downtrend signal📉 SHORT BYBIT:BILLYUSDT.P from $0.0036300
🛡 Stop Loss: $0.0036860
⏱ 1H Timeframe
✅ Overview:
➡️ BYBIT:BILLYUSDT.P continues its downward trend, testing the $0.0036300 level as a potential short entry point.
➡️ POC (Point of Control) at $0.0040257 indicates the highest liquidity zone, located significantly above the current price, confirming seller dominance.
➡️ The price failed to hold above $0.0038700, reinforcing the bearish scenario.
➡️ If the price breaks below $0.0036300, a further decline towards the target levels is likely.
⚡ Plan:
➡️ Enter short below $0.0036300, confirming further downside movement.
➡️ Risk management via Stop-Loss at $0.0036860, placed above the nearest resistance.
➡️ Primary downside targets:
🎯 TP Targets:
💎 TP1: $0.0034890
🔥 TP2: $0.0033642
🚀 BYBIT:BILLYUSDT.P remains in a downtrend — expecting further decline!
📢 BYBIT:BILLYUSDT.P is under strong selling pressure with no signs of buyer recovery.
📢 If $0.0036300 breaks with increasing volume, a move towards $0.0034890 – $0.0033642 becomes more likely.
📢 However, if the price rebounds above $0.0036860, the scenario may change.

$TPL Ready for a Major Move....🔥 Texas Pacific Land Corporation ( NYSE:TPL ) Ready for a Major Move! 🔥
This weekly chart is showing a breakout pattern, with 63%+ upside potential to $2,258.15!
📊 Current Price: $1,381.19 (+2.67%)
📈 Target: $2,258.15 🎯🔥
🚀 Potential Gain: +879 points (+63.75%)
Will TPL hit new highs? Drop your predictions below! ⬇️
💬 #Stocks #Trading #Breakout #Investing

#SWELLUSDT longsignal📉 LONG BYBIT:SWELLUSDT.P from $0.01928
🛡 Stop Loss: $0.01890
⏱ 1H Timeframe
✅ Overview:
➡️ BYBIT:SWELLUSDT.P is showing a strong upward movement after breaking out of consolidation. The price has broken key resistance levels and is now forming a retest zone, confirming bullish strength.
➡️ POC (Point of Control) is located at $0.01175, far below the current price, indicating a shift to a new accumulation phase.
➡️ Trading volumes have increased significantly, which could further strengthen the upward impulse.
⚡ Plan:
➡️ Enter LONG at $0.01928 after confirming the breakout level.
➡️ Stop-Loss set at $0.01890 to protect against false breakouts.
➡️ Primary targets – $0.01967, $0.02013, and $0.02065, where partial profit-taking is possible.
🎯 TP Targets:
💎 TP1: $0.01967
🔥 TP2: $0.02013
⚡ TP3: $0.02065
🚀 Expectation: If the current trend holds, BYBIT:SWELLUSDT.P may continue its upward movement towards $0.02065 and beyond.

$NASDAQ:RR Double Bottom Breakout Setup - 50-80% upsideNASDAQ:RR looks like it's setting up for a possible breakout.
What to look for:
Price closes above the breakout threshold ($3.90)
Volume is spiking - looking at recent spikes, looks to be ~60++M shares
Squeeze is expanding in a positive direction (UP!)
MACD is signaling BUY
William %R is pushing into oversold territory (~20% or less)
Entry:
Depending on your risk threshold there are a couple of places that I'd suggest...
Current price - more risk, but higher reward ~85% upside
Price after closing above $3.90, less risk, but lower reward ~50% upside
Price Target:
As shown on the chart $5.83
