[BTC/USD] What's happening with BITCOIN!?Hello traders! Here we have BTC/USD. As you can see from TA we are fighting with the downtrend resistance line (dotted red line). (red dotted line) is showing a forming a descending wedge'ish pattern - I think, it's more likely, that we will follow this path down to around ~7,300USD levels (red dotted line) and then see a spike in price.
MACD & RSI indicators are starting to gain momentum.
RSI is near oversold mark.
MACD is below average.
Breakouttrade

CTIC major Huge breakout possibleCTIC has a major resistance point and the current price is near the resistance. On Monday the 26, unless something drastic happens over the weekend, it will show some major movement, either a breakout or just an annoying. If anyone is a penny stock trader, MAKE SURE YOU HAVE THIS ON YOUR WATCHLIST! Something will happen! Let me know what you think in the comments and also, the one minute time interval graph is clear so if anyone is interested, make sure you check it out. Have a nice weekend and lets see what happens on Monday. Also see NASDAQ: AEMD, similar situation.

EUR/USD: Rising Channel / Ascending Wedge - BE PATIENT!Not the best currency pair to be getting involved with at the moment. There is a lot of possible scenarios developing and no clear direction. Not only are we within a range, but also in the middle of Channels, which is not an ideal entry point.
Identified are: 1) Ascending Wedge Pattern; 2) Channel #1; Channel #2;
At the time of this post, on a slow post xMas session, the market is range bound (Grey box). In short, a break above the range, followed by a pullback to the Mov Avg and bounce back up stands as a good bullish entry with TP at the red resistance levels. The opposite below the grey range would be a good short opportunity to the bottom trendines of the channels.
The trend is clearly bullish since retesting the support levels at 1.1720. The dotted ascending trend line and relatively low RSI level makes a good case for a Wedge pattern which would take the pair up towards the 3 red resistance levels to finish out the pattern. This upwards strength is also backed up by the retesting of the Mov Avg followed by strong pushes up forming candles with long tails.
On the other hand, if the wedge is merely apparent and we are within a Channel, the lower 1.18's stand as a good Long entry point when coinciding with the trendiness to then go back up to the red resistance levels within the plotted channels.
Staying patient will yield the most profit right now.
How we would take this trade:
Agressive Approach: Wait for the market to breakout of the Range. Wait for the pullback to Mov Avg and Support or Resistance levels of range (depending on the direction of the breakout) and get in there to the designated TPs (Red Resistance if bullish breakout, bottom of Channels if bearish breakout)
Safer Approach: Let the market reach the extremes of the channels and enter a trend reversal trade (Short at the top of Channels coinciding with resistance levels, Long at bottom of channel coinciding with Support).
Stay patient. Good Luck. Low Volume market right now, which can surprisingly be volatile when you least expect it and fake you out.

Daily Mean Extension with Bearish Conf. on Lower TF's (GBPJPY)On the daily TF for the GBPJPY the bullish impulse has been stalling and we are now consolidating in an area well extended from the 200 SMA. On the 4HR, there has been several attempts from the bears to break below the 200 SMA and have held, but now we have had a big impulse down, through the 200 SMA with a bullish correction. This is more easily seen on the 1HR, but regardless a sell stop has been placed below the low of the bearish candle. (148.665 - a few pips) (A bearish MACD signal on the 1HR, CCI breaking below -100, etc. could also do instead of trading the breakout below the candle.) Partial TP at 147.029 as its been a significant level in the past, and it would be smart to trail the rest of the trade on its way back to the mean on the Daily.

$DERM is breaking out$DERM looking really good to go higher. Chart is showing that it is beginning to breakout.


Do we have a Huge flag here? At an important S/R???So, here's what I see:
Price is forming lower highs and higher lows. In stocks this is usually a good sign for a breakout to the top. Since I am quite new to cryptos, I'd like to hear what you guys think?
If everything goes as I would read from the chart, then price will soon rocket away with one big push.
For education, I'd be glad to hear your opinions about this analysis! Help me out!
I will enter a small long position here, while price keeps consolidating.
Thank you for your support!

4hr Bull FlagThis chart has been very vertical.. Take a look at the Bull Flag forming on the 4hr chart. 1 to 1 move puts the completion right into a HTF Resistance Zone.

POSITIONAL LONG EIHOTELEI HOTEL ACTUALLY HAD A GREAT RUN FROM 102 LEVELS. AFTER THAT THERE HAS BEEN IN A CONSOLIDATION OR RANGEBOUND PHASE IN THE PAST MONTH OR SO. TODAY IT BROKE OUT WITH VOLUME IF YOU SEE THE CHART. RSI IS ALL SET TO GO ABOVE 70.
IM BUYING AT CURRENT LEVELS OF 139.70-140 AND ABOVE WITH A STOP OF AROUND 130 LEVELS.
TARGET WILL BE ABOVE 170 LEVELS . IL BE TRAILING MY STOPS AS THE STOCK GOES UP.

AUDCAD corrective structure downsideHi Guys, looking for another downside in corrective structure or complete break to downside

Support structure-AUDUSDPrice hitted Daily support area with an oversold RSI. Probably we will see some rebound on this pair till the hourly trend.(0,752 aprox). Then we should wait for a breakout to project the bullish movement till the next maximum level(0,758).

USDCAD Sell the breakoutHello folks, nice trendline play, sell the breakout to lower trendline resistance. gl/

GBPNZD Great Trade in making, watch for breakout of correction.Hello folks, watch for it, It has very high chance of breaking below, I'm seeing everything justifying this breakout it will be big, so look for it, good luck post new ideas soon.

Target almost hit! => +400 PipsAs advised 23/03. breakout out of Feb low price resulted in a sell of right towards the massive support area 107 - 106. Only 1/2 position invested as price never retraced to the 2nd entry. Prepared to take of position at 107.5 and look for long short term entries.
Another +250 Pips potentially to be earned on the pullback out of the above mentioned support area

Potential bullish movement- USDJPYPotential double-bottom pattern. If price stops at the minimum of today we will have some potential bullish movement till the first resistance. Then, if this resistance is broken , the double-bottom pattern will be confirmed and bullish movement will appear till the 4h resistance.

Breakout setup-USDCHFPrice has rejected bearish trend line and broken bullish hourly trend. We can expect bearish movement till the next support level (0,995). Then, if prices breaks that support level, we can extend that bearish movment till next minimum.


NZD/USD 4HR, NEUTRALHi Traders,
NZD/USD PAIR CONSOLIDATING WITHING THE TREND LINES.
Once the price breaks above or below the specified trend lines we can have a direction as to where the market can potentially go to. If we break the Resistance Trend Line the pair will find the next resistance at 0.7044 and if the market decides to go bearish and breaks the Support Trend line, the price will find support at 0.6884.
Good luck.
Follow and Like to get my analysis as soon as I come up with one.

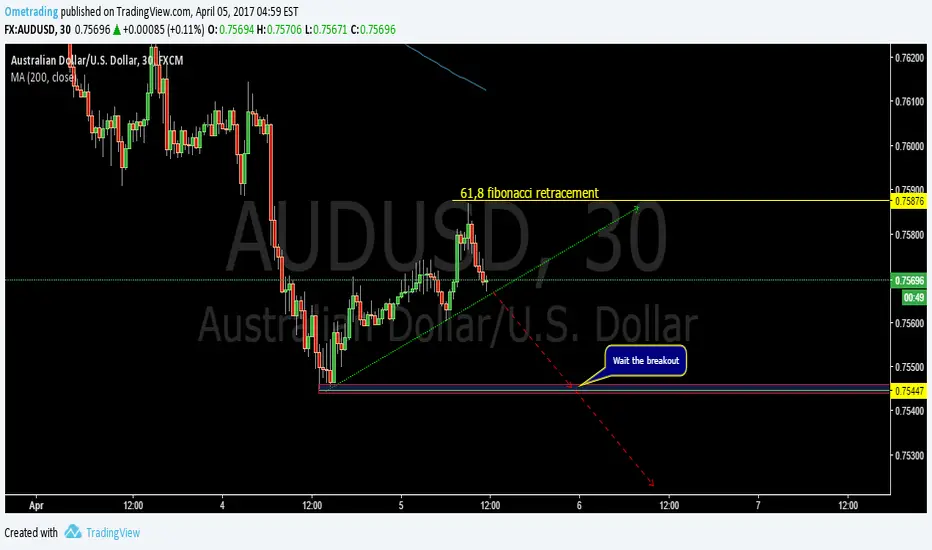
Support setup-AUDUSDPrice hitted daily support level. We can expect some rebound in this pair till bearish hourly trend. Then, if price breaks it, we can project it till 61,8 of fibonacci retracement.

GBP/USD NEUTRAL, 4HRGBP USD Consolidating in structure and trend lines, if the price breaks bullish we will be looking to find resistance at 1.2575 and if price breaks bearish we will be looking to find support at 1.2400. Lets wait and see what market decides to do.


USDJPY - Long opportunity06/04/2017 - FX:USDJPY
Daily
The Bullish wedge is signalling a high probability rally. With NFP looming tomorrow there will definitely be some momentum that could potentially strengthen the greenback.
4hr
The 4hr or 1hr timeframe might signal the opportunity to go long and provide a worthwhile Risk to Reward on a break and test. We are trading above 110.00 which has held firm and is another confluence that supports this idea.
There are more confluences and correlations that support this idea that I haven't mentioned.

61,8 fibonacci rejected- AUDUSDPrice has rejected 61,8 fibonacci retracement. Now is testing 1 hour bullish trend. Waiting for a break to go short