Einsteinium / Bitcoin - Breakout of 'head and shoulders' patternEntry:
If the price breaks above the last high (shown by comment A) we can think about buying. I already have a buy-stop in place for this.
The initial stop will be under the current range (shown by comment B).
Exit:
We're going to manage the trade by moving a stop up under the lows on the daily timeframe. If the price makes any substantial move in one day we can break down to a smaller timeframe to make sure we capture some profit before it collapses (something common in these cryptos)
What analysis i'm doing:
If we break above the last high the price will be forming a reverse head and shoulders pattern.
More important for me is the general shape the price is forming (shown by the blue curved line). Although a bit messy the price is stopping moving further down slowly giving time to properly reset before moving upwards again. It's good to see the price moving sideways like this above the last lows. The market is accepting the the current higher price as a new base.
We already have two good wicks on the last lows and a high low (shown by comment C)
The moving averages arecrossing and the price is holding, more or less, above the faster one.
We can get some really good risk to reward on these cryptos so attempting an early buy like this can pay off.
i'll consider this setup invalid if the price breaks below the range, and will then have to re-asses.
Good luck everyone!
Mark
Breakouttrade

Pascal/Bitcoin triangle breakout - PASC/BTCI'm going to prepare for a breakout of this triangle pattern if the price goes above the last high. Hopefully the price will consolidate more and we can cancel this trade and get one with a tighter stop and therefore a better risk to reward. EDIT: We just broke above as i was writing this, so we're in the trade now. Let's set the stoploss and see what happens
What I'm looking for on this set up:
- The overall trend is upwards and is moving between consistent higher lows and triangle patterns. for me this is the most easily predictable form of price movement and is why i like cryptos so much for trading.
- The triangles are great as after this kind of consolidation the price will usually pop in the direction of the break and you can get a really goo risk to reward. If we get a similar move to the last triangle we could be looking at 10:1 risk/reward or more.
- When these new coins get added to Poloniex there is often a hype about them creating massive volume and liquidity, as well as an overall buy panic. With this you get these really nice patterns and minimal erratic price movements. Pretty good because you can safely use a smaller stop (better R/R) without worrying that the price will suddenly drop and take out your stop.
Gonna move up a stop up under the 30 min or 1 hour swing lows and if we get a sudden large move upwards, i'll probably break down to a lower timeframe and move a stop under the lows there instead.
Hope this goes well for anyone involved...good luck!
Mark


USD/CAD Triangle Breakout 15minDon't try to trade the range. The breakout should be close as we are coming to the end of the triangle.

GBPUSD Possible Breakout 1 hr chartBearish Flag / Breakout Possible on the Hour chart,
We have come down and retraced to the 618 on the Impulse leg.
The fib extention of 1.27 and fib inversion of 1.414 line up with the lowest pin bar on the daily.
We are oversold in the RSI as well

SHORT USDCAD i am currently short on usdcad after breaching, retesting and closing below the retest with a bearish engulfing. price has since retreated to retest a key level so we will see how this goes. expected strong Canadian data out later today also was part of my thinking for this trade so we will see how this goes.

GBPUSD, waiting for a corrective structure and buy!There is potential for a breakout trade when the corrective pattern is formed. Keep a lookout for it.
It might happen within the next few hours. Don't miss the trade. Thank you

AUDUSD 4 Hr breakout / harmonic move I still think we have more downside to come.
Looks to me like an outside return and now a possible breakout into a harmonic move like we just had.
This also puts us in the area of a D Completion leg for a Bullish Bat on the Daily and a area of support which saw the pair move to recent highs
Looking on the monthly chart its still looking like a bear flag formation imo

NZDUSD Sell the Breakout Looks ready to moved lower, we have broken below the daily trend see further downside from these levels

AUDNZD buy setupSimilarly to the NZDCAD, we have another setup developing on the AUDNZD.
Let's wait for the breakout with confirming indicators.

NZDCAD sell setup A sell setup is developing on the NZDCAD but we need a nice break with confirming indicators to get involved.

NZDCAD Channel Short - Waiting for Breakout on upward trend linePrice action has reached upper channel limits at aprox 98.30 level. Strong upward trend. Spinning tops and reversal candlestick may indicate a reversal. Wait for price action to break out of upward trend line to place trade.
Target = aprox 95.00

Breakout structure - Good upside potentialThis pair has been forming a bullish breakout structure and price is pushing against the 86.000 handle. Good upside pontential with primary target around the 88.000 handle. Long entries can be taken on the breakout or after the breakout on the re-test.

USDJPY 60min Preparing for a BreakoutUSDJPY on the 60min in consolidating in the shape of a Descending Triangle. These patterns tend to cause large breakout moves in the markets. I'll be watching this pattern and will be waiting for a Break & Close out of the pattern to give me direction. As of right now I have no idea which direction it will break, so I will not involve myself until I get my signal.
Also we are at a Major Support Level in the market. I love finding these patterns at higher time frame structure levels.

Brent Crude Oil - Daily (Neutral)Triangle pattern in Brent. Will be looking to trade a breakout by entering on a retest of support or resistance (role reversal), depending upon the direction of the move. Not much else to say here really - just a visual aid by which to look at price action in the coming few weeks.

USD/CAD going downUSD/CAD going down.
Indicator used : RSI at 65
target 1.30 & then sell at 1.32 or above

AUD/CAD - Daily Chart Analysis - Waiting a BreakoutAUD/CAD - Daily Chart Analysis - Waiting a Breakout
If the price broke the trend line with a breakout candle, enter LONG .
Take profit 1: @0.99860
Stop loss @0.95160
If the price bounce on the trend line enter SHORT .
Take profit1: 1st support @0.94500
Take profit2: 2nd support @0.93400
Stop loss: @0.9800
Have a nice trading! gg.

EURGBP 4 Hr Possible Breakout TradeI have a Long view on this pair up to the D point of the possible cypher.
Looking at how we may get there, as you can see the previous candle came all the way down to previous support and rejected this are and moved up. This current candle is in or around another are of previous support.
If we see the candle close above the trend line I feel we will see a move to the upside

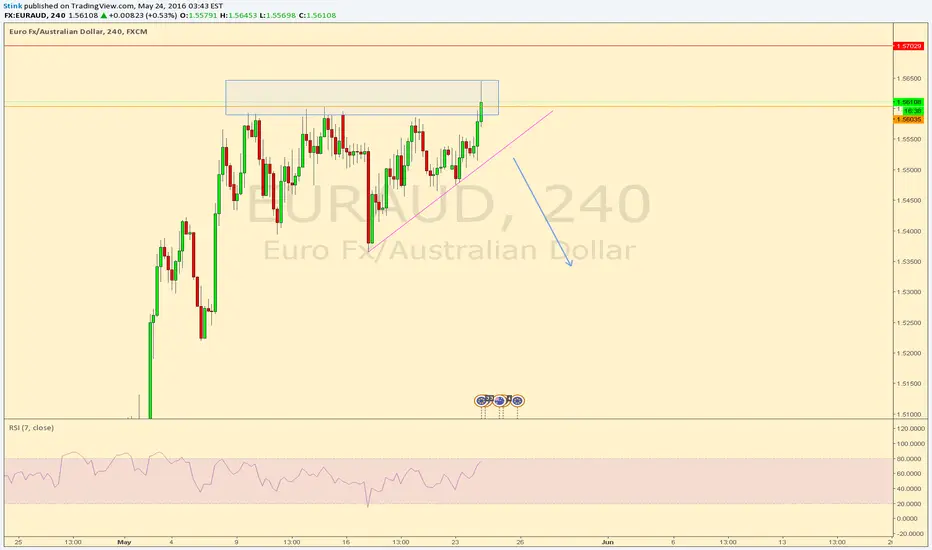
EURAUD breakout possiblityIm already short on this pair but looking at other areas to watch
'IF' the current candle closes below the orange line a valid double top could form and if we see a candle close below the pink line further downside.
Now we are in/close to the oversold area on several of the time frames.
All in my opinion of course


GOLD - buy the break up or sell the break downThis is an ascending triangle but given the split opinion in the market over the future direction of gold (some people are majorly bullish, others are majorly bearish, one week the global markets excel, the next they are doing poorly) I would trade based on both a break above or a break below.
Look for a close above or below the support/resistance.
If it breaks below there is opportunity for a strong move down.

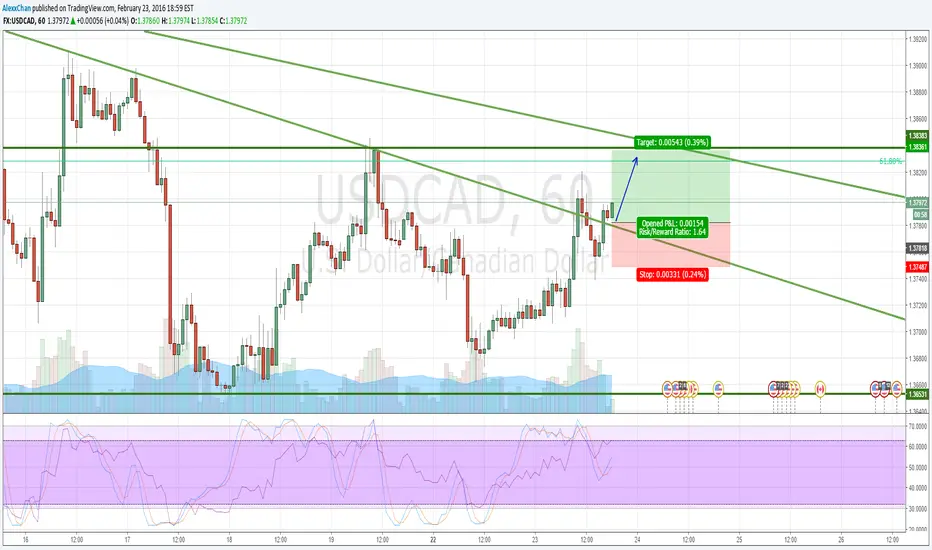
USDCAD heading higher to 1.38361With a break of an 1hr trend line, I'm placing my bets that USDCAD is going to reach higher to at 1.3836 before making it's next move.