Gold - Heading Higher For Another +30%!Gold ( TVC:GOLD ) won't stop any time soon:
Click chart above to see the detailed analysis👆🏻
Back in 2015 we witnessed a significant rounding bottom formation on Gold, starting the next major bullrun. With the all time high breakout back in the end of 2023, this rally was just confirmed and after the recent trendline breakout, Gold can still head much much higher.
Levels to watch: $4.000
Keep your long term vision,
Philip (BasicTrading)
Breakouttrading

Breakout Retest Possible?431 - 433 is a Good Support level as of now.
However, Extreme Pressure may bring the price towards
420 - 429 which is also the breakout re-test level.

Still Bullish.Still Bullish.
Long Consolidation Box - Breakout
Still has the potential to touch 26 - 27
Huge Volumes; though candle of 24-03-2025
closed red due to heavy selling but...

Bullish Flag / Pennant Pattern Formation appearing.
Bullish Flag / Pennant Pattern Formation appearing.
87 - 88 is the Breakout Level; but Important Resistance
lies around 90 - 92
Closing above 100 - 101 would trigger more positivity.
Crossing & Sustaining this level may expose new Highs
around 130.
However, it should not Break 73.

Breakout Retest done?Retested previous Breakout level around 93 - 94.
For Fresh Entry, 105 - 106 is the watchout level.
Immediate Targets then can be around 112 - 113
initially.

Will Gold Retest 3170 ATHs in Sight Amid Rising Global TensionsXAU/USD has decisively broken above the significant 3170 resistance level, confirming bullish momentum and signaling a potential continuation of its long-term uptrend. This breakout is not just technical—it's backed by a growing fundamental storm.
With escalating geopolitical tensions, the ongoing trade war rhetoric surrounding Trump’s tariff policies, and persistent global macro uncertainty, gold is once again asserting its role as a premier safe haven asset. These drivers are creating the perfect backdrop for further upside, possibly pushing gold toward new all-time highs.
Currently, price is in a healthy correction phase, pulling back toward the former resistance zone at 3170, which now acts as strong support. A retest and confirmation in this area may offer a high-probability long setup for trend-followers and breakout traders alike.


Bullish on Bigger Time Frames.Bullish on Bigger Time Frames.
but Important Resistance area is around 145 - 148.
Crossing this rangewith Good Volumes will expose
the levels around 170 & then 190.
132 & 125 are important Support levels as of now.

Breakout trading
(Title)
Breakout trading starts with finding support and resistance points
-------------------------------
Hello, traders.
If you "Follow", you can always get new information quickly.
Please click "Boost" as well.
Have a nice day today.
-------------------------------------
I will take the time to talk about breakout trading.
This is my opinion, so the content may be lacking.
The reason I did not explain what other people say with examples is because trading is a psychological battle.
Most of the content in books or on the Internet is explained with patterns.
However, it is not easy to find patterns when checking the movement of a real-time chart.
Therefore, I think it is more important to understand why such movements occur than to explain them with patterns.
Therefore, I think it is better to create a trading strategy by finding support and resistance points and checking whether or not they are supported by the support and resistance points rather than memorizing patterns.
Breakout trading refers to starting a transaction after checking whether there is support at a point or section when the price rises above a certain point or section, and there is a possibility of a larger rise.
If you do a breakout trade incorrectly, you may end up buying at a high point, which could result in a large loss, so it is recommended to always keep a stop loss point when trading.
In order to reduce the stop loss, you need to make an effort to lower the average purchase price by selling in installments when the price rises after purchasing and buying in installments when the price falls again.
Therefore, the stop loss point is when it is beyond the range you can handle.
-
Let's take the BTCUSDT 1D chart as an example.
It has fallen after renewing the ATH.
Looking at the current price position, it feels like it will fall further.
However, if the price rises to around the HA-Low indicator on the 1D chart, that is, around 89294.25, you will feel like it will turn into an uptrend.
Even if you think that you won't feel that way now, you will feel that way after it rises.
Therefore, the most important thing in breakout trading is to find important support and resistance points.
To find support and resistance points, you need to basically understand candles.
Any book or video about candles will do.
I recommend that you don't try to memorize the content in it, but read or watch it repeatedly several times.
In my case, after watching the video about candles about 3 times, my understanding of the chart became easier.
The reason for finding support and resistance points is to select a trading point.
What you need to find support and resistance is a horizontal line.
It is not easy to start trading with chart tools that are not horizontal lines but diagonal lines or curves.
The reason is that when you try to start a trade, you are more likely to miss the timing because your psychological state is added.
-
You can see that the uptrend started when it broke through the 73072.41 point.
Therefore, you can see that it is possible that the uptrend will start when it breaks through the 106133.74 point this time as well.
However, in this case, since it is rising while renewing the ATH, it is a point where it is thought to be difficult to actually start trading.
In other words, it is likely that you will be reluctant to trade because it is thought to be a high point.
Therefore, as I mentioned earlier, the actual breakout trade will be conducted when it breaks through the 89294.25 point.
Then, even if it rises to around the 106133.74 point, you will be more likely to respond stably without feeling much psychological anxiety.
-
However, there is one problem.
That is, the StochRSI indicator is currently in the overbought zone.
Therefore, when it rises near the 89294.25 point and confirms support, the StochRSI indicator should show a downward trend from the overbought zone.
Otherwise, the 89294.25 point is likely to act as a resistance point.
Even if the market is messy and difficult to predict, you should not be too busy finding support and resistance points.
After all, you need to have a standard for creating a trading strategy to start trading.
It is better to create a trading strategy and respond at the support and resistance points you have selected if possible.
Even if you suffer a loss, if you continue to trade, you will be able to better organize the support and resistance points.
For reference, the indicators that can create a trading strategy on my chart are the HA-Low and HA-High indicators.
-
Thank you for reading to the end.
I hope you have a successful trade.
--------------------------------------------------

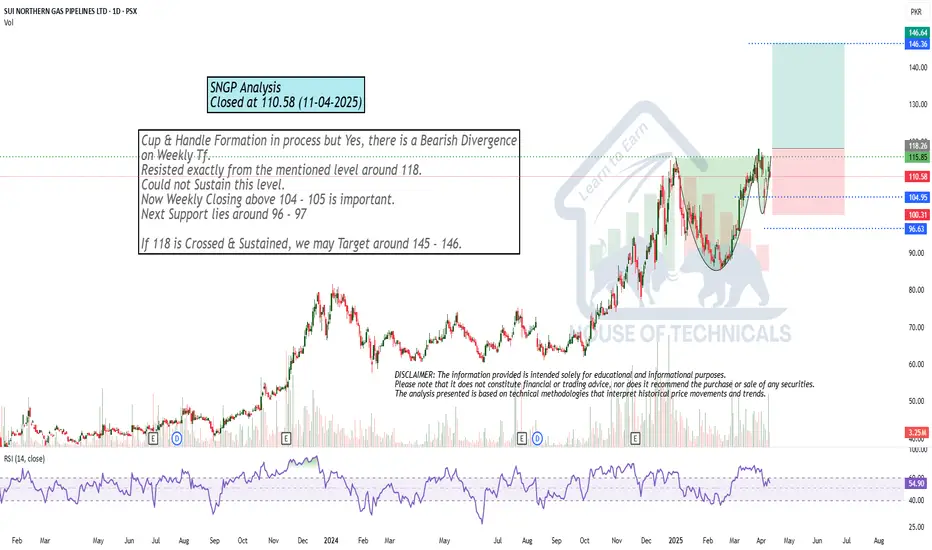
Cup & Handle Formation in process but Cup & Handle Formation in process but Yes, there is a Bearish Divergence
on Weekly Tf.
Resisted exactly from the mentioned level around 118.
Could not Sustain this level.
Now Weekly Closing above 104 - 105 is important.
Next Support lies around 96 - 97
If 118 is Crossed & Sustained, we may Target around 145 - 146.
GBP/JPY Triangle Breakout (11.04.2025)The GBP/JPY Pair on the M30 timeframe presents a Potential Selling Opportunity due to a recent Formation of a Triangle Breakout Pattern. This suggests a shift in momentum towards the downside in the coming hours.
Possible Short Trade:
Entry: Consider Entering A Short Position around Trendline Of The Pattern.
Target Levels:
1st Support – 184.40
2nd Support – 182.60
🎁 Please hit the like button and
🎁 Leave a comment to support for My Post !
Your likes and comments are incredibly motivating and will encourage me to share more analysis with you.
Best Regards, KABHI_TA_TRADING
Thank you.

XAUUSD Analysis Falling Wedge breakout Setup to Target🔍 1. Market Context & Structure
Gold has recently experienced a sharp decline, as evident from the aggressive bearish candles leading into the consolidation phase. Following this downward momentum, the market began to consolidate, forming a Falling Wedge pattern—a bullish reversal structure that often signals an impending upside breakout, especially after a strong bearish trend.
📉 2. Falling Wedge Pattern
The wedge is formed by two downward-sloping trendlines that converge, containing price within lower highs and lower lows.
Notice how price is respecting both boundaries, confirming the validity of the pattern.
The pattern also features a series of higher lows, showing a loss of bearish momentum.
🟩 3. Support and Resistance Levels
Resistance Zone: Around $3,035 to $3,045 — This level previously acted as a strong supply zone where price was rejected multiple times.
Support Zone: Around $2,972 to $2,985 — Clearly marked area where buyers stepped in strongly during the sharp pullback.
These levels are critical to observe for any breakout or breakdown confirmation.
📊 4. Trade Plan Based on the Chart
✅ Bullish Bias:
Given the falling wedge setup and slowing bearish pressure, the trade idea favors a breakout to the upside.
🔵 Entry Point:
A confirmed breakout above the wedge’s upper boundary (around $3,030–$3,035), ideally on strong bullish volume.
🎯 Target:
The first take profit level is marked at $3,078.438, aligning with a prior resistance and measured move projection from the wedge’s height.
🔴 Stop Loss:
Positioned just below the most recent swing low and wedge boundary at $3,013.707, offering protection if the breakout fails.
🧠 5. Why This Setup Matters
Wedge patterns are high-probability when they form after a sharp move, as seen here.
Volume confirmation on the breakout would solidify this as a reliable opportunity.
Risk-to-reward ratio appears favorable, with a tight stop and a higher projected upside.
🧭 Conclusion
This is a textbook falling wedge breakout scenario. The consolidation after a bearish leg, narrowing price action, and repeated support reactions indicate that bulls are gearing up. If Gold breaks above the wedge with momentum, there’s potential to ride the move toward $3,078. Always wait for confirmation and manage your risk accordingly.

Can EURUSD Take Out the Major High 1.12000?EURUSD Major Forex Pair
Following Trump’s tariff policies announced on Friday, the price of the EURUSD forex pair broke the daily higher high structure and is now returning to retest that level. This morning, the price bounced off the 0.618 daily Fibonacci level, suggesting that it may move upward again, potentially reaching the major high around 1.12000 or hitting one of the Fibonacci extension levels.
Price Action on the 4-Hour Chart
I have shifted down to the 4-hour chart to analyze the price action in more detail. While it appears somewhat chaotic due to Friday's news and the aggressive bullish impulse, it’s encouraging that the price broke through the higher high structure and is now retesting it.
At this point, I would like to see the price remain above the 0.618 daily Fibonacci level and stay within the upward trendline. Additionally, the price is forming a symmetric triangle. Once it breaks out of this pattern, I plan to enter a buy position with a risk-to-reward ratio of 1:2, targeting the supply area near the major high.
I will provide an update as more price action develops later in the week, so stay tuned!

Dogecoin - You Should Not Be Afraid!Dogecoin ( CRYPTO:DOGEUSD ) could reverse right now:
Click chart above to see the detailed analysis👆🏻
Four months ago Dogecoin perfectly retested the previous all time high and is now creating the anticipated bearish rejection. However during every bullish cycle we saw a correction of at least -60%, which was followed by a parabolic rally, so there is no reason to be worried at all.
Levels to watch: $0.2, $0.5
Keep your long term vision!
Philip (BasicTrading)

It's about to explodeThe British Pound looks very strong across the board. Check my post of GPBCHF lines below. Is forming a bullish flag at the monthly resistance to break it up violently. If it pulls back I'll add more. SL triggers is a weekly candles closes under the bottom of the flag but I hardly doubt it. I'm almost all in on the British Pound.

"ETH/USD: Breakout Incoming? Buy Signal from Falling Wedge!"It illustrates a downward trend with a falling wedge pattern, which is a bullish reversal pattern.
Key Observations:
Falling Wedge Pattern:
The price has been trading within a downward-sloping channel.
The wedge pattern suggests a potential breakout to the upside.
Breakout Opportunity:
The price is currently near the lower boundary of the wedge, suggesting a potential buying opportunity.
A buy signal is indicated at a key support level.
Target Price:
The chart has a target zone around $2,531 – $2,562, which suggests an expected upward move.
Technical Indicators:
The price is currently around $1,815, indicating a possible bottom formation.
A bullish move from this level is expected.
Trading Idea:
Entry: Buy near the current price ($1,815).
Target: $2,531 – $2,562.
Stop-Loss: Below $1,723 for risk management.
This analysis suggests a bullish reversal with a potential breakout from the falling wedge. However, traders should confirm with volume and other indicators before entering a trade.

Enterprise Products Partners L.P. 5 Day Long Swing IdeaI found a good stock, and I shared my target profit and stop loss in the video. Also, I shared the screener I use alongside in a kangaroo market.

#HIVEUSDT is maintaining a bearish structure📉 Short BYBIT:HIVEUSDT.P from $0.2424
🛡 Stop loss $0.2455
🕒 1H Timeframe
⚡️ Overview:
➡️ The POC (Point of Control) is at 0.2527, marking the area with the highest trading volume and now acting as major resistance.
➡️ The 0.2455 level serves as local resistance — price has already started to decline from that zone.
➡️ Price BYBIT:HIVEUSDT.P is steadily moving lower and staying below volume clusters, confirming the bearish structure.
➡️ A breakdown below $0.2424 could lead to acceleration toward target zones.
🎯 TP Targets:
💎 TP 1: $0.2399
💎 TP 2: $0.2379
💎 TP 3: $0.2366
📢 Watch for confirmation of the $0.2424 breakdown — it’s key for continuation.
📢 If price reclaims $0.2455, the short setup becomes invalid.
BYBIT:HIVEUSDT.P is maintaining a bearish structure — expect quick target reaction if the signal confirms.

XAUUSD Breakout Trade – Target Hit!In this trade, we identified a downtrend breakout on Gold (XAU/USD) using the 1-hour chart. A descending trendline was broken, signaling a shift in momentum. After price retested a key support zone around $3,023.75, buyers stepped in, confirming the breakout.
A long position was taken with a stop loss below the recent lows, ensuring a safe risk-to-reward ratio. The trade played out beautifully, with strong bullish momentum pushing the price towards our take profit (TP) level at $3,057.37.
This setup highlights the power of trendline breaks and retests, offering high-probability entries for traders. With gold showing strength, we’ll watch for further bullish continuation or potential pullbacks for new opportunities.
📊 Key Takeaways:
✔ Trendline breakout confirmed by retest
✔ Strong bullish momentum
✔ TP hit successfully for solid profits
#Gold #XAUUSD #ForexTrading #BreakoutStrategy #TradingSuccess

Gold (XAU/USD) – Triangle Breakout & Bullish Trade Setup Overview
This 1-hour Gold Spot (XAU/USD) chart showcases a well-defined symmetrical triangle pattern, which has successfully broken out to the upside. This breakout indicates strong bullish momentum, setting up a potential rally towards $3,107 and beyond.
The analysis below will cover:
✅ Triangle Pattern Formation & Breakout Explanation
✅ Key Technical Levels (Support, Resistance, ATH)
✅ Entry, Stop Loss, & Take Profit Strategies
✅ Risk Management Considerations
✅ Final Trade Setup & Market Sentiment
Let’s dive into the details.
1️⃣ Chart Pattern: Symmetrical Triangle Formation
What is a Symmetrical Triangle?
A symmetrical triangle is a common continuation pattern in technical analysis that forms when price consolidates within two converging trendlines. This structure indicates a period of indecision in the market before a potential breakout occurs.
When price breaks above the upper trendline, it signals a bullish continuation.
If price breaks below the lower trendline, it suggests a bearish move.
In this case, gold has broken above the upper resistance trendline, signaling a continuation of the existing uptrend.
Pattern Breakdown (Step by Step):
Triangle Formation: The price made higher lows and lower highs, compressing within the pattern.
Price Squeeze: As the market approached the apex of the triangle, volatility decreased, indicating an imminent breakout.
Breakout Confirmation: A strong bullish candle closed above the resistance trendline, validating the pattern and confirming bullish momentum.
2️⃣ Key Technical Levels & Zones
🔹 Support & Resistance Zones:
Support Level: $3,012 - $3,020 (Highlighted as a strong demand zone where buyers stepped in).
Resistance Level: $3,080 (Previously acted as strong resistance but has now turned into support post-breakout).
All-Time High (ATH): Marked just below $3,090, where price previously struggled to break through.
🔸 Breakout Target & Price Projection
Breakout Level: The breakout happened above $3,080, confirming an uptrend continuation.
Target Calculation:
The height of the triangle is projected upwards from the breakout point.
This gives us a price target of $3,107 - $3,120 in the short term.
3️⃣ Trading Strategy Based on Breakout
✅ Entry Strategy:
Aggressive Entry: Entering immediately after the breakout candle closes above $3,080, riding the momentum.
Conservative Entry: Waiting for a potential pullback to $3,080 (now acting as support) before entering a long position.
⛔ Stop Loss Placement:
Ideal Stop Loss: Below the previous support zone at $3,012, ensuring protection against fake breakouts.
Tighter Stop Loss: Just below the breakout point at $3,065, in case of a minor retracement before moving higher.
🎯 Profit Target Strategy:
Short-Term Target: $3,107, based on the triangle’s measured move.
Extended Target: If momentum sustains, $3,120+ could be achieved, aligning with previous bullish trends.
4️⃣ Risk Management & Market Considerations
Risk Factors to Monitor:
🔸 Volume Confirmation: A breakout with high trading volume is a stronger signal than one with low volume.
🔸 Market Fundamentals: Events like US inflation data, Federal Reserve rate decisions, and geopolitical tensions can impact gold prices.
🔸 False Breakout Risk: If price falls back below $3,080, the breakout might be invalid, signaling a potential reversal.
Risk-Reward Ratio:
📌 Entry: $3,080
📌 Stop Loss: $3,012 (Approx. 68 points risk)
📌 Target: $3,107 - $3,120 (Approx. 27-40 points reward)
📌 Risk-to-Reward Ratio: 2:1+, making this a favorable trade setup.
5️⃣ Market Sentiment & Final Trade Setup
📈 Bullish Outlook:
The successful breakout above the symmetrical triangle signals continued bullish strength.
Price is holding above the previous resistance zone at $3,080, now acting as support.
The next resistance target is $3,107 - $3,120, aligning with previous swing highs.
🔴 Bearish Scenario (If Invalidated):
If price falls back below $3,080, it could indicate a false breakout.
A break below $3,065 might lead to a retest of the $3,012 support zone.
📊 Final Trading Plan:
✅ Buy (Long) at: $3,080 - $3,085
🎯 Target 1: $3,107
🎯 Target 2: $3,120+ (Extended Target)
⛔ Stop Loss: $3,012
🔥 Conclusion: Bullish Bias with Caution
Gold (XAU/USD) has successfully broken out of the symmetrical triangle, signaling a strong bullish continuation. As long as price holds above $3,080, the bias remains bullish, targeting $3,107 - $3,120.
💡 Key Takeaway: Watch for a pullback and retest of $3,080 before entering, ensuring confirmation before committing to the trade.
🚀 Final Outlook: Bullish – Gold is positioned for further upside if momentum continues!

Gold (XAU/USD) Bullish Retest SetupMarket Structure & Analysis:
Uptrend Confirmation: Price has been in a strong bullish trend, forming higher highs and higher lows.
Resistance & Retest: The price recently hit a resistance zone around $3,054 and pulled back for a retest.
Support Zone: A key support level is marked at $3,010, which has held multiple times.
Bullish Retest Setup: If the price successfully retests this support level and confirms bullish momentum, we can anticipate a potential move toward the next resistance level.
Target Levels:
First Target: $3,054 (recent high)
Final Target: $3,089 (next major resistance)
Trading Plan:
Buy Setup: Enter after confirmation of bullish price action at the support level ($3,010).
Stop Loss: Below $3,010 to avoid false breakouts.
Take Profit:
TP1: $3,054
TP2: $3,089
Risk Factors:
If the support at $3,010 breaks, price may drop toward the next major support at $2,911, invalidating the bullish setup.
Economic events (such as FOMC meetings, CPI data, or geopolitical risks) may cause unexpected volatility in gold prices.

USDJPY 18K PROFIT LIVE TRADE AND BREAK DOWNUSD/JPY rebounds toward 150.50 on risk recovery
USD/JPY is bouncing back toward 150.50 in Wednesday's Asian session. The pair reverses US President Trump's fresh tariff threats and hawkish BoJ commentary-led drop, tracking the rebound in risk sentiment and the US Dollar. All eyes stay on US tariffs, data and Fedspeak.

Ethereum (ETH/USD) Bullish Breakout – Eyes on $2,500+ Target 📈 Chart Overview:
Timeframe: 4H (Ethereum/USDT)
Trend Reversal: Ethereum has broken out of a falling wedge pattern, indicating a shift from bearish to bullish momentum.
Support Level: Around $1,800 - $1,900, where price previously found strong buying interest.
Retest Confirmation: ETH successfully retested the breakout level (~$2,020), confirming a potential bullish continuation.
Resistance Zone: The next key resistance area is around $2,250, followed by a potential move towards the $2,530 - $2,550 target zone.
📊 Trade Setup:
Bullish Bias: Price action suggests an upward move towards $2,250 and potentially $2,530.
Risk Management: A stop-loss can be set below $2,020 to minimize downside risk.
🔥 Conclusion: If Ethereum maintains momentum above the retest zone, it could see a strong rally in the coming days! 🚀
