XAUUSD NEXT MOVE (READ CAPTION)Hi trader's. what do you think about gold market
current price : 3354
gold Friday breakout sell trade and gold breakout resistance 3345 and close above 3345 and gold just retest downside then he taking support and pump upside gold breakout 3365 then gold next move 3395
support zone: 3343:3330
resistance zone :3365
target 3395
stop loss: 3310
please like comment and follow thank you
Breakouttrading

SBIN , 1W , Bullish As the Pattern is Formed and given Breakout , enter after strong candle close in weekly Timeframe and put SL below Swing low . follow proper risk management
follow for more swing ideas like this

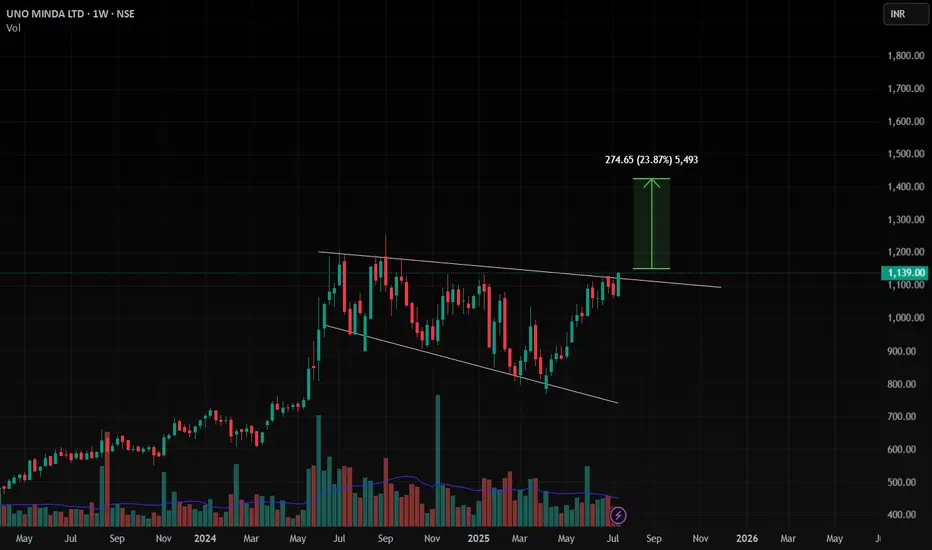
UNOMINDA , 1W , Bullish The pattern is channel , it is ready to Breakout , Enter after only clear confirmation in weekly strong close then enter , follow proper position sizing and risk management
follow for more swing Ideas like this
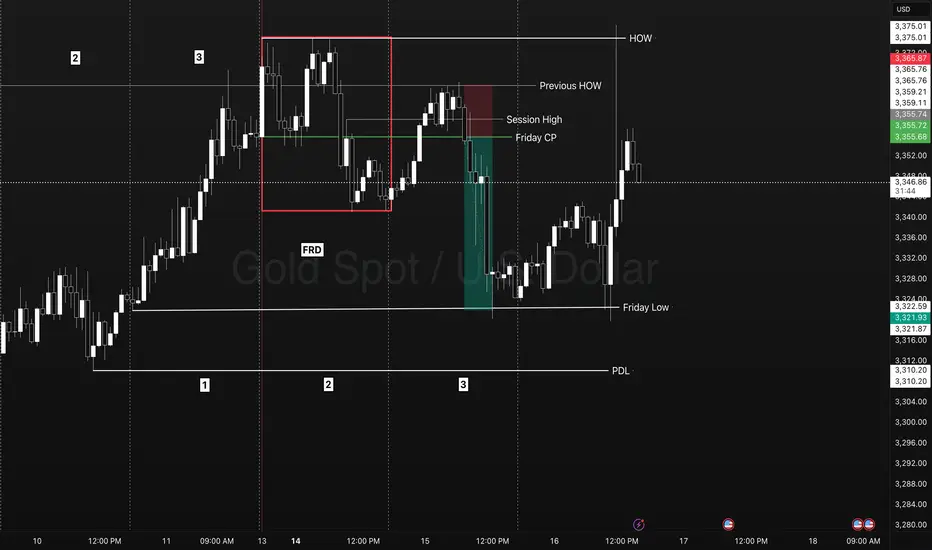
XAUSD - Using HOW levels for a break and retest!Identify what signal a market is showing you.
TYPES IOF SIGNAL DAYS
- First red/green day
- Dump/Pump
- Inside day
Frame the Trade play
- Reversal
- Continuation
Identify the Levels
- HOW/LOW
- Session High/LOW
- Friday Closing Price.
Trade Explanation
On the previous week FOREXCOM:XAUUSD triggered 3 days of breakout traders into the market closing in breakout. On Monday we have a FRD signal that sets up a next day trade opportunity. A retest of a previous weeks high gave us an indication of a retest/reversal trade on day 3 below Fridays closing price. Into the NY session this market quickly displaced back to Friday day 1 LOD level. Going into Tuesday day 2 we had the test of a weekly level and reversal above a session high closing below the Friday closing price. The break of a previous weeks high triggered more breakout traders into the market however it failed. We know day 2 typicall expands the range on Monday for a great parabolic trade setup right to as previous days low.
NO GUESSING, NO FOMO, NO FEAR, NO STRESS!
- Friday Closing Price (Entry)
- Previous HOW (Stop)
- PDL (Target)
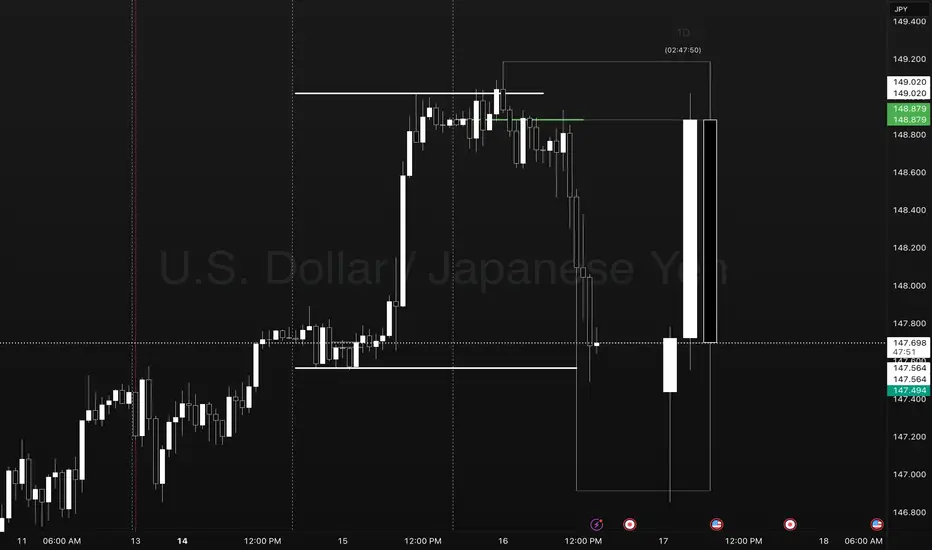
Pump Coil Dump Day 1-2-3 USDJPYUSDJPY Reversal Trade.
Points to Notice
Day 1 - Sets the new week high and low. Establishes a new week closing price as a target for a day 3 setup.
Day 2 - Typically expands Mondays range in the direction of the underlying oder flow. This occurs as a pump/ dump leading to the Asia and London coil sideways.
Day 3- We take note of the previous day high and low to observe price going into the NY session. In this case Price gave signs of a coiling reversal into the evening setting up for the move below Day 2 closing price.
Ideally what you want to see in this template is traders faked into a breakout move in the direction of the pump. This can present as a candle close above yesterdays high or closing price.
After trapping traders in we see the change in order flow creating a new lower low. This is the confirmation to look for an entry at the previous days closing price.
We set a stop at the high of day 3 level or at the previous days high with a target at the previous days low. In extreme cases we may see a setup that expands to the LOW level.
THE ONLY IMPORTANT DATA POINTS.
- PREVIOUS DAY HIGH AND LOW
- CLOSING PRICE
- LOW HOW LEVELS
- DAY COUNT
MARKETS ONLY DO TWO THINGS
- BREAKOUT, FAIL, REVERSE
- BREAKOUT, RETEST, TREND.
ONLY LEVELS THAT ARE TRADED
- PREVIOUS DAY HIGH (STOP LOSS)
- PREVIOUS DAY CLOSING PRICE (ENTRY)
- PREVIOUS DAY LOW (TARGET) CMCMARKETS:USDJPY FX:EURUSD OANDA:USDJPY
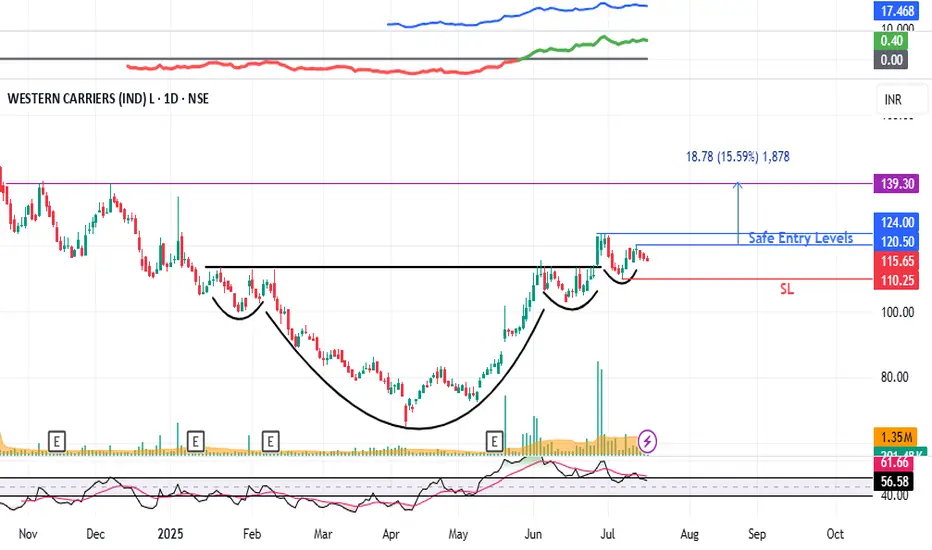
Western Carriers (WCIL) : Breakout Candidate#WCIL #patterntrading #breakout #breakoutstock #inverseheadandshoulder #swingtrading
WCIL : Swing Trade
>> Low PE Stock
>> Inverse Head & Shoulder pattern visible
>> Breakout & Retest Done
>> Ready for New Highs
>> Low Risk High Reward Trade
Swing Traders can lock profits at 10% & Keep Trailing
Pls Comment , Boost and Follow for more such Analysis
Disc : Charts shared are for Learning Purpose and not a Trade recommendation, Consult your Financial afvisor or a SEBI Registered Advisor before taking postion in it.
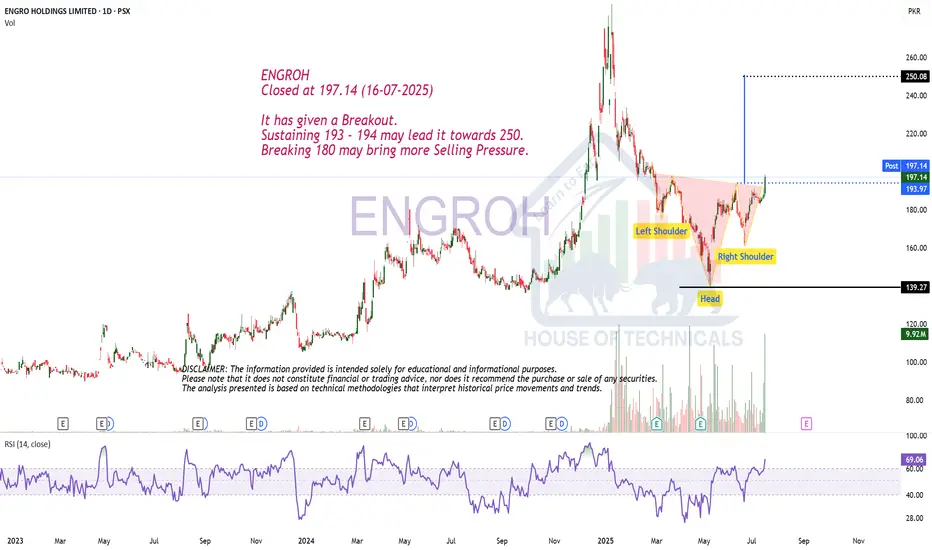
Breakout..ENGROH
Closed at 197.14 (16-07-2025)
It has given a Breakout.
Sustaining 193 - 194 may lead it towards 250.
Breaking 180 may bring more Selling Pressure.
sportking technical breakout gain 30% sportking technical breakout gain 125 is major support and tgt is 30% gain at cmp price , cmp price is 132.65, please check

EDELWEISSAfter a strong uptrend , Price consolidated near the resistance forming a tight closing base
Price is breaking out of the range.

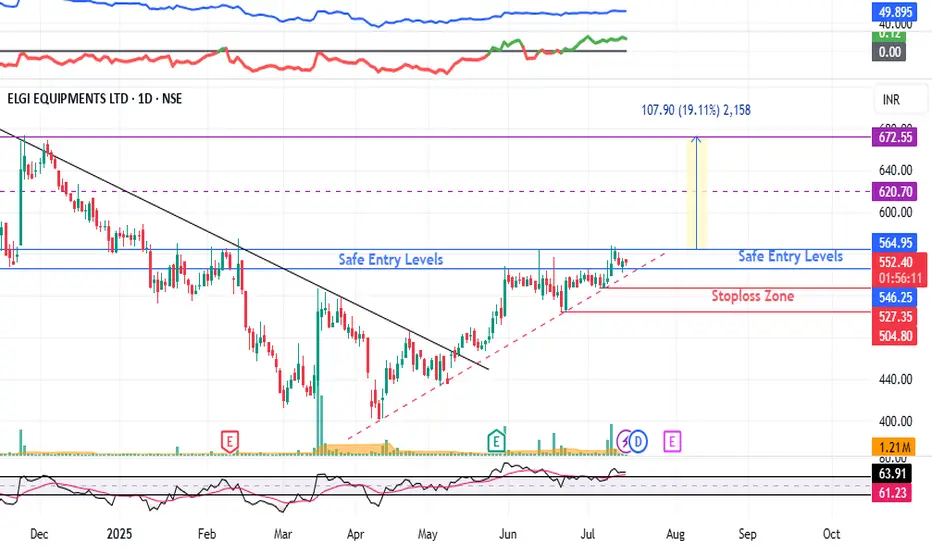
ELGIEQUIP : Breakout Soon#ELGIEQUIP #breakoutstock #swingtrade #trendingstock
ELGIEQUIP : Swing Trade
>> Breakout candidate
>> Trending changing happening
>> Good strength & Volume
>> Risk Reward Favorable
Swing Traders can lock profit at 10% and keep trailing
Pls Boost, Comment & Follow for more analysis
Disc : Charts shared are for Learning purpose not a Trade Recommendation, Take postions only after consulting your Financial Advisor or a SEBI Registered Advisor.
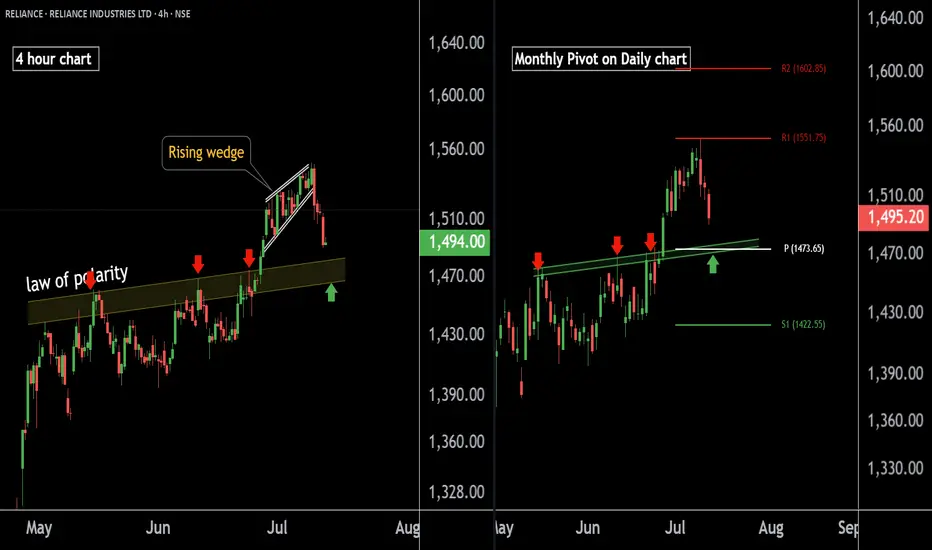
RELIANCE INDUSTRIES at Best Support !! Keep It On Your Radar !!There are two chart of RELIANCE INDUSTRIES on Daily and 4 hour Timeframe.
On the 4-hour timeframe, Reliance is likely to respect its LOP (Line of Polarity) as support, with the support range near 1460-1475.
On the Daily timeframe, the monthly pivot is also positioned around 1473, reinforcing this level as a potential halt or reversal zone.
If this level is sustain we may see higher prices in RELIANCE INDUSTRIES.
Thank You !!!
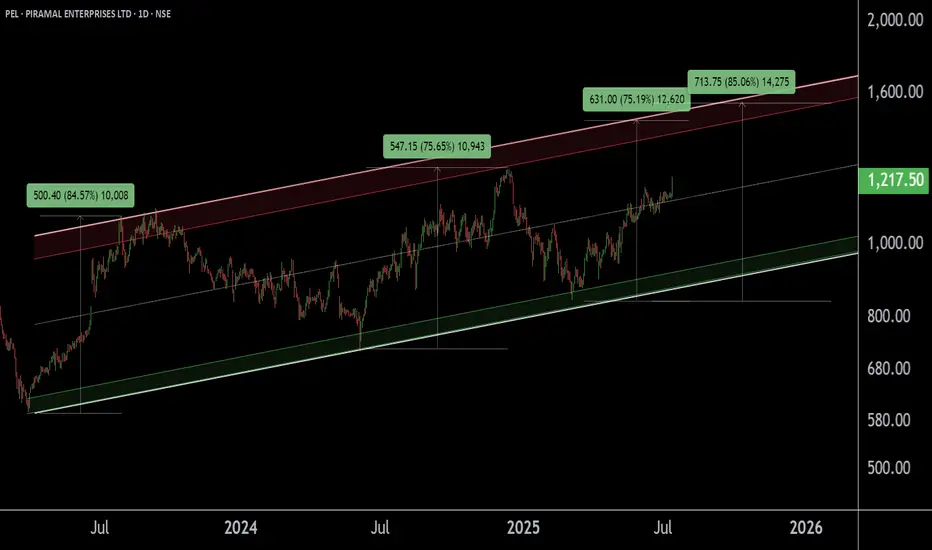
PEL !! PIRAMAL ENTERPRISES LTD appear to be in a Breakout phase This is the Daily Chart of PIRAMAL ENTERPRISES LTD.
PEL is trading above the midline of its ascending parallel channel, with strong support in the ₹1080–₹1150 zone. Historically, whenever it sustains above the midline, it tends to retest the upper boundary resistance of the channel near at 1500 -1540.
If this level is sustain then we may see higher prices in PEL.
Thank You !!
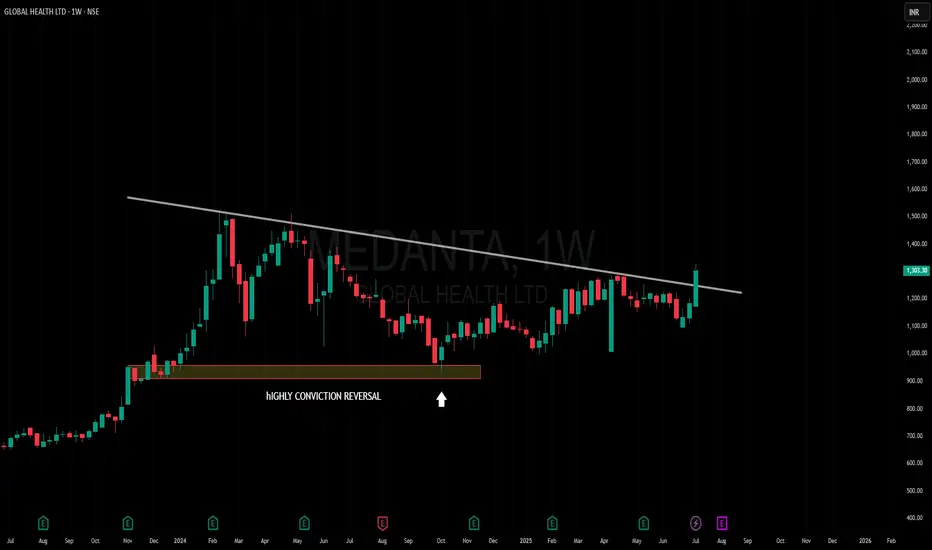
Amazing breakout on WEEKLY Timeframe - MEDANTACheckout an amazing breakout happened in the stock in Weekly timeframe, macroscopically seen in Daily timeframe. Having a great favor that the stock might be bullish expecting a staggering returns of minimum 25% TGT. IMPORTANT BREAKOUT LEVELS ARE ALWAYS RESPECTED!
NOTE for learners: Place the breakout levels as per the chart shared and track it yourself to get amazed!!
#No complicated chart patterns
#No big big indicators
#No Excel sheet or number magics
TRADE IDEA: WAIT FOR THE STOCK TO BREAKOUT IN WEEKLY TIMEFRAME ABOVE THIS LEVEL.
Checkout an amazing breakout happened in the stock in Weekly timeframe.
Breakouts happening in longer timeframe is way more powerful than the breakouts seen in Daily timeframe. You can blindly invest once the weekly candle closes above the breakout line and stay invested forever. Also these stocks breakouts are lifelong predictions, it means technically these breakouts happen giving more returns in the longer runs. Hence, even when the scrip makes a loss of 10% / 20% / 30% / 50%, the stock will regain and turn around. Once they again enter the same breakout level, they will flyyyyyyyyyyyy like a ROCKET if held in the portfolio in the longer run.
Time makes money, GREEDY & EGO will not make money.
Also, magically these breakouts tend to prove that the companies turn around and fundamentally becoming strong. Also the magic happens when more diversification is done in various sectors under various scripts with equal money invested in each N500 scripts.
The real deal is when to purchase and where to purchase the stock. That is where Breakout study comes into play.
Check this stock which has made an all time low and high chances that it makes a "V" shaped recovery.
> Taking support at last years support or breakout level
> High chances that it reverses from this point.
> Volume dried up badly in last few months / days.
> Very high suspicion based analysis and not based on chart patterns / candle patterns deeply.
> VALUABLE STOCK AVAILABLE AT A DISCOUNTED PRICE
> OPPURTUNITY TO ACCUMULATE ADEQUATE QUANTITY
> MARKET AFTER A CORRECTION / PANIC FALL TO MAKE GOOD INVESTMENT
DISCLAIMER : This is just for educational purpose. This type of analysis is equivalent to catching a falling knife. If you are a warrior, you throw all the knives back else you will be sorrow if it hits SL. Make sure to do your analysis well. This type of analysis only suits high risks investor and whose is willing to throw all the knives above irrespective of any sectoral rotation. BE VERY CAUTIOUS AS IT IS EXTREME BOTTOM FISHING.
HOWEVER, THIS IS HOW MULTIBAGGERS ARE CAUGHT !
STOCK IS AT RIGHT PE / RIGHT EVALUATION / MORE ROAD TO GROW / CORRECTED IV / EXCELLENT BOOKS / USING MARKET CRASH AS AN OPPURTUNITY / EPS AT SKY.
LET'S PUMP IN SOME MONEY AND REVOLUTIONIZE THE NATION'S ECONOMY!
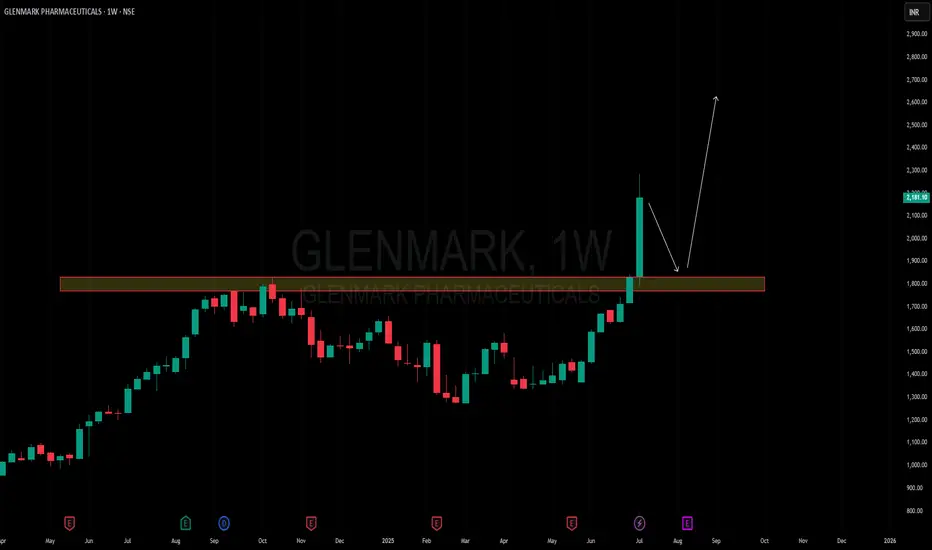
Amazing breakout on WEEKLY Timeframe - GLENMARKCheckout an amazing breakout happened in the stock in Weekly timeframe, macroscopically seen in Daily timeframe. Having a great favor that the stock might be bullish expecting a staggering returns of minimum 25% TGT. IMPORTANT BREAKOUT LEVELS ARE ALWAYS RESPECTED!
NOTE for learners: Place the breakout levels as per the chart shared and track it yourself to get amazed!!
#No complicated chart patterns
#No big big indicators
#No Excel sheet or number magics
TRADE IDEA: WAIT FOR THE STOCK TO BREAKOUT IN WEEKLY TIMEFRAME ABOVE THIS LEVEL.
Checkout an amazing breakout happened in the stock in Weekly timeframe.
Breakouts happening in longer timeframe is way more powerful than the breakouts seen in Daily timeframe. You can blindly invest once the weekly candle closes above the breakout line and stay invested forever. Also these stocks breakouts are lifelong predictions, it means technically these breakouts happen giving more returns in the longer runs. Hence, even when the scrip makes a loss of 10% / 20% / 30% / 50%, the stock will regain and turn around. Once they again enter the same breakout level, they will flyyyyyyyyyyyy like a ROCKET if held in the portfolio in the longer run.
Time makes money, GREEDY & EGO will not make money.
Also, magically these breakouts tend to prove that the companies turn around and fundamentally becoming strong. Also the magic happens when more diversification is done in various sectors under various scripts with equal money invested in each N500 scripts.
The real deal is when to purchase and where to purchase the stock. That is where Breakout study comes into play.
Check this stock which has made an all time low and high chances that it makes a "V" shaped recovery.
> Taking support at last years support or breakout level
> High chances that it reverses from this point.
> Volume dried up badly in last few months / days.
> Very high suspicion based analysis and not based on chart patterns / candle patterns deeply.
> VALUABLE STOCK AVAILABLE AT A DISCOUNTED PRICE
> OPPURTUNITY TO ACCUMULATE ADEQUATE QUANTITY
> MARKET AFTER A CORRECTION / PANIC FALL TO MAKE GOOD INVESTMENT
DISCLAIMER : This is just for educational purpose. This type of analysis is equivalent to catching a falling knife. If you are a warrior, you throw all the knives back else you will be sorrow if it hits SL. Make sure to do your analysis well. This type of analysis only suits high risks investor and whose is willing to throw all the knives above irrespective of any sectoral rotation. BE VERY CAUTIOUS AS IT IS EXTREME BOTTOM FISHING.
HOWEVER, THIS IS HOW MULTIBAGGERS ARE CAUGHT !
STOCK IS AT RIGHT PE / RIGHT EVALUATION / MORE ROAD TO GROW / CORRECTED IV / EXCELLENT BOOKS / USING MARKET CRASH AS AN OPPURTUNITY / EPS AT SKY.
LET'S PUMP IN SOME MONEY AND REVOLUTIONIZE THE NATION'S ECONOMY!
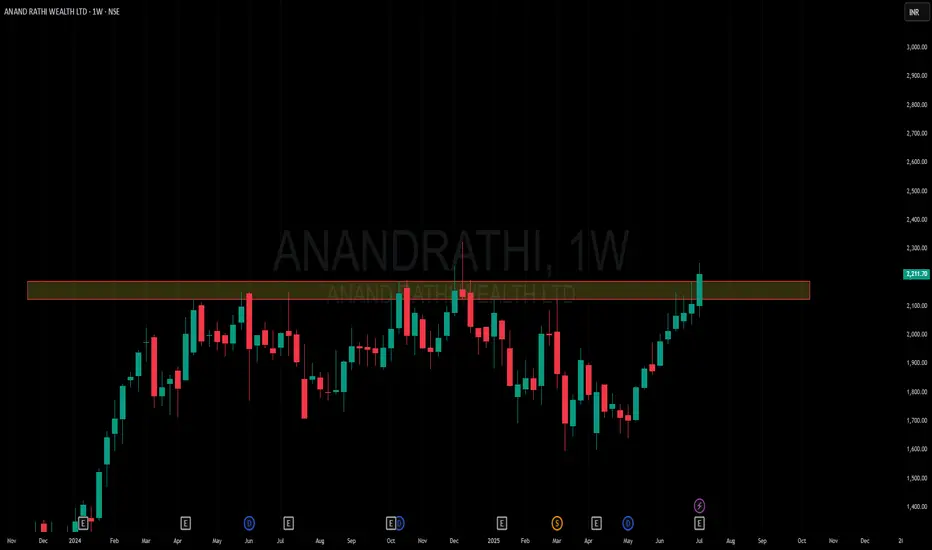
Amazing breakout on WEEKLY Timeframe - ANANDRATHICheckout an amazing breakout happened in the stock in Weekly timeframe, macroscopically seen in Daily timeframe. Having a great favor that the stock might be bullish expecting a staggering returns of minimum 25% TGT. IMPORTANT BREAKOUT LEVELS ARE ALWAYS RESPECTED!
NOTE for learners: Place the breakout levels as per the chart shared and track it yourself to get amazed!!
#No complicated chart patterns
#No big big indicators
#No Excel sheet or number magics
TRADE IDEA: WAIT FOR THE STOCK TO BREAKOUT IN WEEKLY TIMEFRAME ABOVE THIS LEVEL.
Checkout an amazing breakout happened in the stock in Weekly timeframe.
Breakouts happening in longer timeframe is way more powerful than the breakouts seen in Daily timeframe. You can blindly invest once the weekly candle closes above the breakout line and stay invested forever. Also these stocks breakouts are lifelong predictions, it means technically these breakouts happen giving more returns in the longer runs. Hence, even when the scrip makes a loss of 10% / 20% / 30% / 50%, the stock will regain and turn around. Once they again enter the same breakout level, they will flyyyyyyyyyyyy like a ROCKET if held in the portfolio in the longer run.
Time makes money, GREEDY & EGO will not make money.
Also, magically these breakouts tend to prove that the companies turn around and fundamentally becoming strong. Also the magic happens when more diversification is done in various sectors under various scripts with equal money invested in each N500 scripts.
The real deal is when to purchase and where to purchase the stock. That is where Breakout study comes into play.
Check this stock which has made an all time low and high chances that it makes a "V" shaped recovery.
> Taking support at last years support or breakout level
> High chances that it reverses from this point.
> Volume dried up badly in last few months / days.
> Very high suspicion based analysis and not based on chart patterns / candle patterns deeply.
> VALUABLE STOCK AVAILABLE AT A DISCOUNTED PRICE
> OPPURTUNITY TO ACCUMULATE ADEQUATE QUANTITY
> MARKET AFTER A CORRECTION / PANIC FALL TO MAKE GOOD INVESTMENT
DISCLAIMER : This is just for educational purpose. This type of analysis is equivalent to catching a falling knife. If you are a warrior, you throw all the knives back else you will be sorrow if it hits SL. Make sure to do your analysis well. This type of analysis only suits high risks investor and whose is willing to throw all the knives above irrespective of any sectoral rotation. BE VERY CAUTIOUS AS IT IS EXTREME BOTTOM FISHING.
HOWEVER, THIS IS HOW MULTIBAGGERS ARE CAUGHT !
STOCK IS AT RIGHT PE / RIGHT EVALUATION / MORE ROAD TO GROW / CORRECTED IV / EXCELLENT BOOKS / USING MARKET CRASH AS AN OPPURTUNITY / EPS AT SKY.
LET'S PUMP IN SOME MONEY AND REVOLUTIONIZE THE NATION'S ECONOMY!
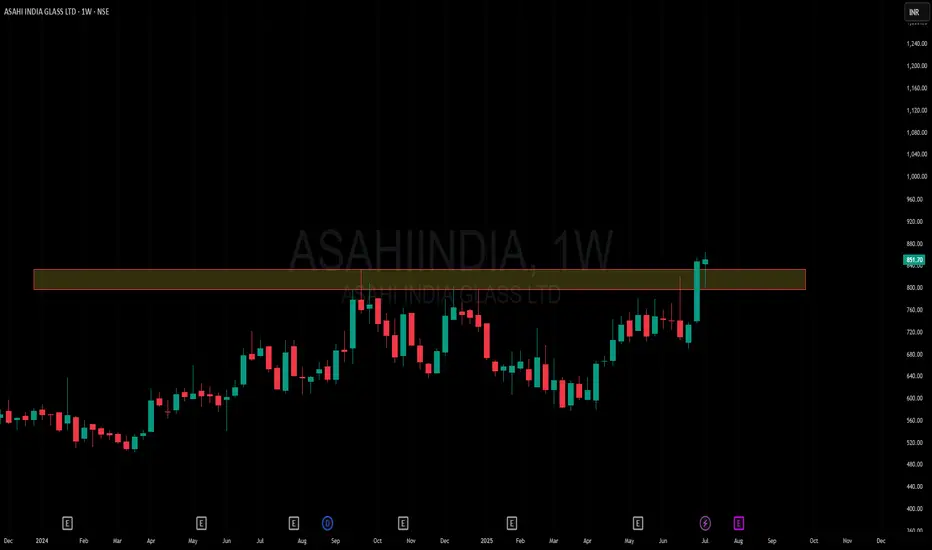
Amazing breakout on WEEKLY Timeframe - ASAHIINDIACheckout an amazing breakout happened in the stock in Weekly timeframe, macroscopically seen in Daily timeframe. Having a great favor that the stock might be bullish expecting a staggering returns of minimum 25% TGT. IMPORTANT BREAKOUT LEVELS ARE ALWAYS RESPECTED!
NOTE for learners: Place the breakout levels as per the chart shared and track it yourself to get amazed!!
#No complicated chart patterns
#No big big indicators
#No Excel sheet or number magics
TRADE IDEA: WAIT FOR THE STOCK TO BREAKOUT IN WEEKLY TIMEFRAME ABOVE THIS LEVEL.
Checkout an amazing breakout happened in the stock in Weekly timeframe.
Breakouts happening in longer timeframe is way more powerful than the breakouts seen in Daily timeframe. You can blindly invest once the weekly candle closes above the breakout line and stay invested forever. Also these stocks breakouts are lifelong predictions, it means technically these breakouts happen giving more returns in the longer runs. Hence, even when the scrip makes a loss of 10% / 20% / 30% / 50%, the stock will regain and turn around. Once they again enter the same breakout level, they will flyyyyyyyyyyyy like a ROCKET if held in the portfolio in the longer run.
Time makes money, GREEDY & EGO will not make money.
Also, magically these breakouts tend to prove that the companies turn around and fundamentally becoming strong. Also the magic happens when more diversification is done in various sectors under various scripts with equal money invested in each N500 scripts.
The real deal is when to purchase and where to purchase the stock. That is where Breakout study comes into play.
Check this stock which has made an all time low and high chances that it makes a "V" shaped recovery.
> Taking support at last years support or breakout level
> High chances that it reverses from this point.
> Volume dried up badly in last few months / days.
> Very high suspicion based analysis and not based on chart patterns / candle patterns deeply.
> VALUABLE STOCK AVAILABLE AT A DISCOUNTED PRICE
> OPPURTUNITY TO ACCUMULATE ADEQUATE QUANTITY
> MARKET AFTER A CORRECTION / PANIC FALL TO MAKE GOOD INVESTMENT
DISCLAIMER : This is just for educational purpose. This type of analysis is equivalent to catching a falling knife. If you are a warrior, you throw all the knives back else you will be sorrow if it hits SL. Make sure to do your analysis well. This type of analysis only suits high risks investor and whose is willing to throw all the knives above irrespective of any sectoral rotation. BE VERY CAUTIOUS AS IT IS EXTREME BOTTOM FISHING.
HOWEVER, THIS IS HOW MULTIBAGGERS ARE CAUGHT !
STOCK IS AT RIGHT PE / RIGHT EVALUATION / MORE ROAD TO GROW / CORRECTED IV / EXCELLENT BOOKS / USING MARKET CRASH AS AN OPPURTUNITY / EPS AT SKY.
LET'S PUMP IN SOME MONEY AND REVOLUTIONIZE THE NATION'S ECONOMY!
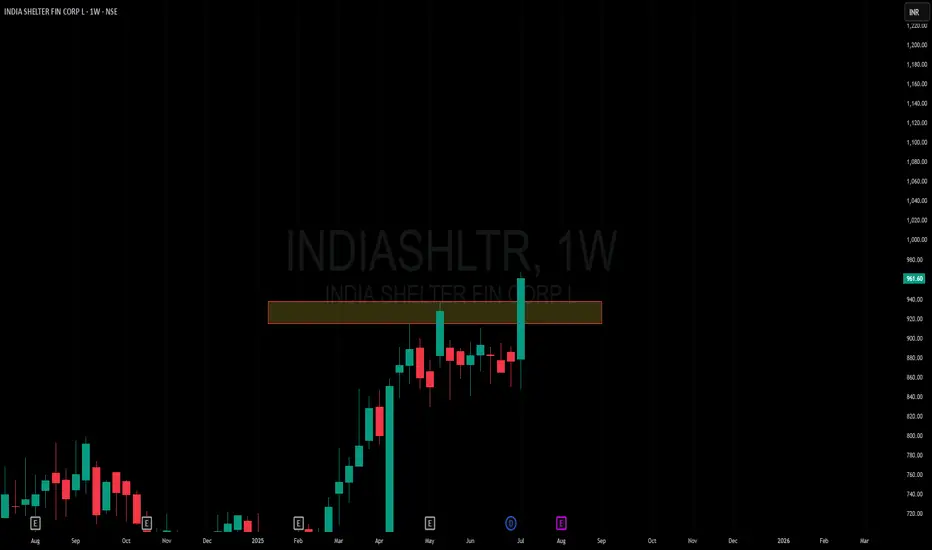
Amazing breakout on WEEKLY Timeframe - INDIASHLTRCheckout an amazing breakout happened in the stock in Weekly timeframe, macroscopically seen in Daily timeframe. Having a great favor that the stock might be bullish expecting a staggering returns of minimum 25% TGT. IMPORTANT BREAKOUT LEVELS ARE ALWAYS RESPECTED!
NOTE for learners: Place the breakout levels as per the chart shared and track it yourself to get amazed!!
#No complicated chart patterns
#No big big indicators
#No Excel sheet or number magics
TRADE IDEA: WAIT FOR THE STOCK TO BREAKOUT IN WEEKLY TIMEFRAME ABOVE THIS LEVEL.
Checkout an amazing breakout happened in the stock in Weekly timeframe.
Breakouts happening in longer timeframe is way more powerful than the breakouts seen in Daily timeframe. You can blindly invest once the weekly candle closes above the breakout line and stay invested forever. Also these stocks breakouts are lifelong predictions, it means technically these breakouts happen giving more returns in the longer runs. Hence, even when the scrip makes a loss of 10% / 20% / 30% / 50%, the stock will regain and turn around. Once they again enter the same breakout level, they will flyyyyyyyyyyyy like a ROCKET if held in the portfolio in the longer run.
Time makes money, GREEDY & EGO will not make money.
Also, magically these breakouts tend to prove that the companies turn around and fundamentally becoming strong. Also the magic happens when more diversification is done in various sectors under various scripts with equal money invested in each N500 scripts.
The real deal is when to purchase and where to purchase the stock. That is where Breakout study comes into play.
Check this stock which has made an all time low and high chances that it makes a "V" shaped recovery.
> Taking support at last years support or breakout level
> High chances that it reverses from this point.
> Volume dried up badly in last few months / days.
> Very high suspicion based analysis and not based on chart patterns / candle patterns deeply.
> VALUABLE STOCK AVAILABLE AT A DISCOUNTED PRICE
> OPPURTUNITY TO ACCUMULATE ADEQUATE QUANTITY
> MARKET AFTER A CORRECTION / PANIC FALL TO MAKE GOOD INVESTMENT
DISCLAIMER : This is just for educational purpose. This type of analysis is equivalent to catching a falling knife. If you are a warrior, you throw all the knives back else you will be sorrow if it hits SL. Make sure to do your analysis well. This type of analysis only suits high risks investor and whose is willing to throw all the knives above irrespective of any sectoral rotation. BE VERY CAUTIOUS AS IT IS EXTREME BOTTOM FISHING.
HOWEVER, THIS IS HOW MULTIBAGGERS ARE CAUGHT !
STOCK IS AT RIGHT PE / RIGHT EVALUATION / MORE ROAD TO GROW / CORRECTED IV / EXCELLENT BOOKS / USING MARKET CRASH AS AN OPPURTUNITY / EPS AT SKY.
LET'S PUMP IN SOME MONEY AND REVOLUTIONIZE THE NATION'S ECONOMY!
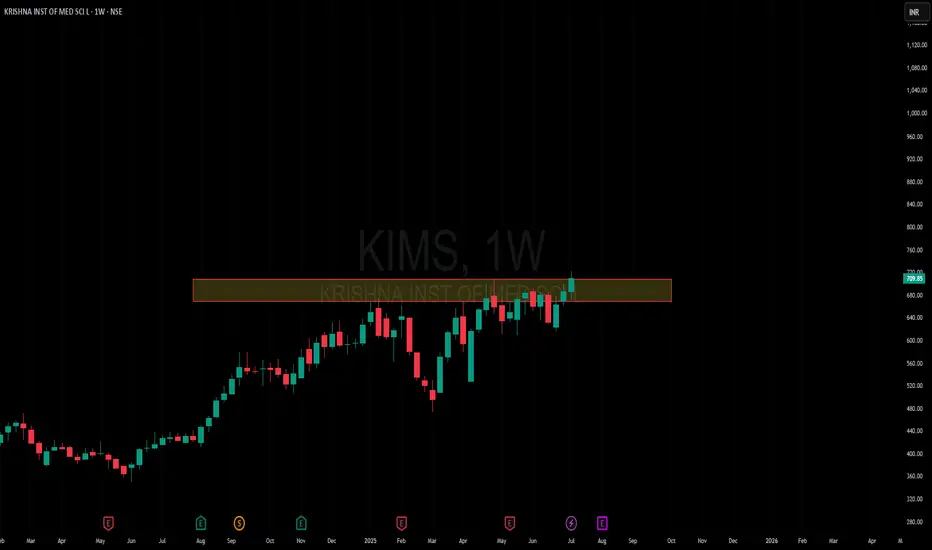
Amazing breakout on WEEKLY Timeframe - KIMSCheckout an amazing breakout happened in the stock in Weekly timeframe, macroscopically seen in Daily timeframe. Having a great favor that the stock might be bullish expecting a staggering returns of minimum 25% TGT. IMPORTANT BREAKOUT LEVELS ARE ALWAYS RESPECTED!
NOTE for learners: Place the breakout levels as per the chart shared and track it yourself to get amazed!!
#No complicated chart patterns
#No big big indicators
#No Excel sheet or number magics
TRADE IDEA: WAIT FOR THE STOCK TO BREAKOUT IN WEEKLY TIMEFRAME ABOVE THIS LEVEL.
Checkout an amazing breakout happened in the stock in Weekly timeframe.
Breakouts happening in longer timeframe is way more powerful than the breakouts seen in Daily timeframe. You can blindly invest once the weekly candle closes above the breakout line and stay invested forever. Also these stocks breakouts are lifelong predictions, it means technically these breakouts happen giving more returns in the longer runs. Hence, even when the scrip makes a loss of 10% / 20% / 30% / 50%, the stock will regain and turn around. Once they again enter the same breakout level, they will flyyyyyyyyyyyy like a ROCKET if held in the portfolio in the longer run.
Time makes money, GREEDY & EGO will not make money.
Also, magically these breakouts tend to prove that the companies turn around and fundamentally becoming strong. Also the magic happens when more diversification is done in various sectors under various scripts with equal money invested in each N500 scripts.
The real deal is when to purchase and where to purchase the stock. That is where Breakout study comes into play.
Check this stock which has made an all time low and high chances that it makes a "V" shaped recovery.
> Taking support at last years support or breakout level
> High chances that it reverses from this point.
> Volume dried up badly in last few months / days.
> Very high suspicion based analysis and not based on chart patterns / candle patterns deeply.
> VALUABLE STOCK AVAILABLE AT A DISCOUNTED PRICE
> OPPURTUNITY TO ACCUMULATE ADEQUATE QUANTITY
> MARKET AFTER A CORRECTION / PANIC FALL TO MAKE GOOD INVESTMENT
DISCLAIMER : This is just for educational purpose. This type of analysis is equivalent to catching a falling knife. If you are a warrior, you throw all the knives back else you will be sorrow if it hits SL. Make sure to do your analysis well. This type of analysis only suits high risks investor and whose is willing to throw all the knives above irrespective of any sectoral rotation. BE VERY CAUTIOUS AS IT IS EXTREME BOTTOM FISHING.
HOWEVER, THIS IS HOW MULTIBAGGERS ARE CAUGHT !
STOCK IS AT RIGHT PE / RIGHT EVALUATION / MORE ROAD TO GROW / CORRECTED IV / EXCELLENT BOOKS / USING MARKET CRASH AS AN OPPURTUNITY / EPS AT SKY.
LET'S PUMP IN SOME MONEY AND REVOLUTIONIZE THE NATION'S ECONOMY!
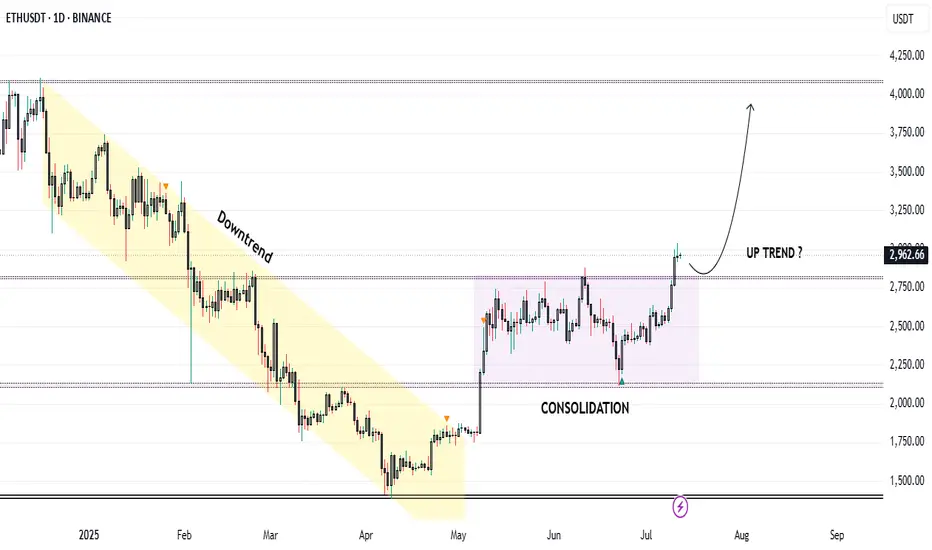
Trend Resumes: Ethereum Breaks Consolidation, Eyes $4050Market Structure Overview:
Markets typically move in two major phases:
🔹 Trend Phase (directional movement)
🔹 Consolidation Phase (sideways movement or accumulation/distribution)
These phases repeat as: Trend → Consolidation → Trend → Consolidation
Ethereum Price Action Breakdown (Daily Timeframe):
Mid-December to End-April: Clear downtrend phase.
May to Early July: Entered a consolidation zone, forming a tight range.
Current Status (July):
🔹 Ethereum has broken out of the consolidation range.
🔹 Currently trading around $3000, confirming strength.
🔹 This breakout may potentially signal the start of Altcoin Season.
Trade Setup – Long Position Idea:
Entry (Buy Zone): Around $2850 (retest of breakout resistance).
Target:
🔹 Primary Target: $4050
🔹 This aligns with a major resistance and Fibonacci extension zone.
Stop Loss: $2600 (below key structure support).
Technical Confluences:
* Breakout above multi-week range.
* Retest of resistance turned support at \$2850.
* Psychological round level near \$3000 acting as a magnet.
* Volume confirmation on breakout (optional to mention if on chart).
Risk Note:
⚠️ Caution: The Market may turn volatile due to unexpected geopolitical or macroeconomic news. Always follow risk management and avoid overleveraging.
Conclusion:
Ethereum’s breakout from a multi-month consolidation phase indicates a potential shift in momentum. If retest levels hold, this could be the beginning of a strong upside rally, possibly leading to a broader Altcoin Season. Traders can position themselves accordingly with a well-defined risk-reward setup.
Forex Market Depth Analysis and Trading StrategiesForex Market Depth Analysis and Trading Strategies
Forex market depth analysis offers traders a deeper understanding of currency market dynamics. It reveals the real-time volume of buy and sell orders at different prices, which is crucial for assessing liquidity and trader sentiment. This article explores how to analyse and use market depth for trading, discussing various strategies and their limitations.
Forex Market Depth Explained
Market depth meaning is the volume of buy and sell orders at different price levels. It's a real-time snapshot of the pair’s liquidity and depth of supply (sell orders) and demand (buy orders). Traders use this information to gauge the strength and direction of a currency pair.
This depth is typically represented through an order book, displaying a currency pair’s existing orders at various price points. This book lists the number of units being bid or offered at each point, giving us insight into potential support and resistance levels. For instance, a large number of buy orders at a certain price level may indicate a strong support area, suggesting that many traders are willing to purchase the currency pair at this price.
Understanding market depth is crucial in assessing the likelihood of trades being executed at desired prices, especially in fast-moving currencies or when trading large volumes. It may help in identifying short-term price movements, offering a more nuanced view of an asset beyond just candlestick charts.
How to Analyse Market Depth
Analysing order flow is a fundamental aspect of market depth trading, providing traders with valuable insights into the supply and demand dynamics of forex pairs. Forex market depth can be assessed using various tools and indicators.
One key tool is the Depth of Market (DOM), which shows the number of buy and sell orders pending at different prices. DOM offers a visual representation of the currency pair’s order book, highlighting potential areas where large orders are placed. We can use such information to identify significant support and resistance levels where the pair might experience a turnaround.
Another essential tool is Level II quotes. These quotes provide detailed information about the price, volume, and direction of every trade executed in real-time. By analysing Level II quotes, traders may be able to identify the pair’s momentum and potential trend shifts. For example, if there is a sudden increase in sell orders at a particular price, it may indicate a potential downward movement, prompting us to adjust our positions accordingly.
Strategies Using Market Depth Analysis
In forex trading, market depth analysis is a crucial tool for understanding and executing a depth of market strategy. Here's how traders can leverage this type of analysis in their strategies:
Scalping Strategy
By closely observing the DOM, scalpers can identify minor price movements and liquidity gaps. For instance, if the DOM shows a large number of sell orders at a slightly higher price, a scalper might open a short position, anticipating a quick downturn. This strategy relies on fast, short-term trades, capitalising on small price changes.
Momentum Trading
Momentum traders use the order book to gauge the strength of a trend. By analysing the order flow and volume, they can determine if a trend is likely to continue or reverse. For example, a surge in buy orders at increasing prices may signal a strong upward momentum, prompting a trader to enter a long position. Conversely, a build-up of sell orders might indicate a potential downward trend.
Support and Resistance Trading
Depth analysis is invaluable for identifying key support and resistance levels. Clusters of orders often act as barriers, influencing price movements. Traders may use these levels to set entry and exit points. For example, a large number of buy orders at a specific price may indicate a strong support zone, reflecting a potentially good entry point for a long position.
Breakout Trading
Traders seeking breakout opportunities can use market depth to spot potential breakout points. A significant accumulation of orders just beyond a known resistance or support level may indicate a potential breakout. If the pair moves past these areas with high volume, it could signal the start of a new trend, potentially offering a lucrative trading opportunity.
Integrating Market Depth with Technical Analysis
Integrating a depth chart trading strategy with technical analysis may enhance decision-making, combining the real-time insights of depth charts with the power of technical indicators. For instance, we can use market depth to confirm signals from technical analysis tools.
If a moving average crossover suggests a bullish trend, a corresponding increase in buy orders in the depth chart may reinforce the signal. Similarly, a significant resistance level identified through technical analysis, such as a Fibonacci retracement level, might be substantiated if there’s a large accumulation of sell orders at that price point.
Risks and Limitations of Market Depth Analysis
While market depth analysis is a valuable tool in forex trading, it comes with certain risks and limitations:
- Dynamic and Fast-Changing Data: Order book data is highly dynamic, often changing within seconds, making it challenging to base long-term strategies solely on such information.
- Lack of Centralisation in Forex: Unlike stock exchanges, the forex market lacks a centralised exchange. This decentralisation means depth data might not represent the entire marketplace accurately.
- Susceptibility to 'Spoofing': Large players might place and quickly withdraw large orders to manipulate market depth perception, misleading other traders. It’s worth noting that spoofing is illegal in many jurisdictions.
- Limited Usefulness in Highly Liquid Markets: In highly liquid pairs, the depth of market data may become less relevant, as large orders are quickly absorbed without significantly impacting prices.
- Dependency on Broker's Data: The reliability of order book data depends on the broker's technology and the size of their client base, which can vary widely.
The Bottom Line
Market depth analysis provides critical insights for forex traders, though it's vital to recognise its dynamic nature and limitations. Integrating it with technical analysis may create robust trading strategies.
This article represents the opinion of the Companies operating under the FXOpen brand only. It is not to be construed as an offer, solicitation, or recommendation with respect to products and services provided by the Companies operating under the FXOpen brand, nor is it to be considered financial advice.

Hindustan Unilever Ltd. – Bullish Breakout with Strong MomentumHindustan Unilever opened the session with a gap-up accompanied by above-average volume, signaling strong buying interest right from the start. While the stock saw some early profit-booking, it quickly regained momentum and is currently trading near the day’s high—an encouraging sign of sustained demand.
Weekly Chart: The formation of a large bullish candle this week suggests aggressive buying and a potential shift in sentiment. This pattern indicates that the bullish momentum is likely to continue into the coming week.
Daily Chart: The stock has successfully broken out above multiple resistance levels, confirming a bullish breakout structure. The breakout is backed by volume, adding credibility to the move.
Trading Strategy:
Given the alignment of bullish signals on both the daily and weekly timeframes, a swing long position is warranted for the upcoming week. Traders may consider the following approach:
Entry: On a minor intraday pullback or a break above the current day’s high for confirmation
Stop-loss: Below the breakout level or this week’s low
Target: Next key resistance or a measured move based on the breakout range , approximately 10% from current levels
The technical setup reflects strong bullish momentum and suggests further upside potential in the near term.

MAHANAGAR GAS at Best Support !! This is the 4 hour chart of MAHANAGAR GAS Ltd.
MGL has given a breakout and successfully completed a retest. The support zone is in the range of 1430 to 1450.
If this level is sustain then we may see higher in prices in MGL.
Thank You !!

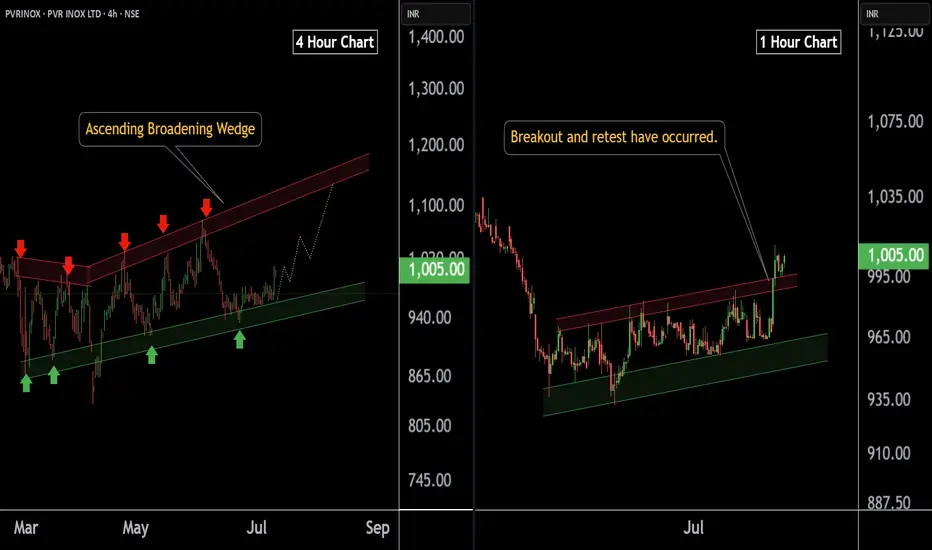
PVR INOX LTD at Best Support !! Breakout Alert !!Here are two charts of PVERINOX — one in the 4-hour timeframe and the other in the 1-hour timeframe.
4-Hour Timeframe Chart:
In the 4-hour timeframe, Power Inox is respecting its lower boundary, with a support range between 930–950.
ChatGPT said:
1-Hour Timeframe Chart:
In the 1-hour timeframe, the stock has given a breakout and has now completed a retest at 980-990 level.
If this level is sustain then , we may see higher in PVRINOX.
Thank you !!