Nvidia - The bullish consolidation flag!Nvidia - NASDAQ:NVDA - is still quite bullish:
(click chart above to see the in depth analysis👆🏻)
After Nvidia retested a major horizontal support just last month, we witnessed an extremely strong bullish reversal candle which resulted in a strong +50% rally. Considering the bullish flag consolidation, a breakout is much more likely, but not in the immediate future.
Levels to watch: $150
Keep your long term vision!
Philip (BasicTrading)
Breakouttrading

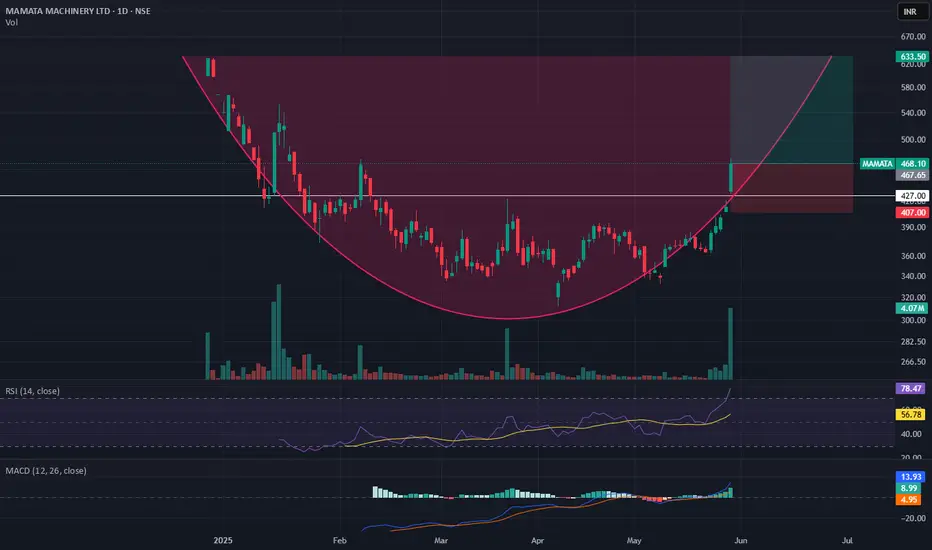
Momentum Trade in Mamata Machinery1. Round Bottom pattern
2. Good Volume
3. HH-HL Structure
4. RSI above 50
5. MACD signal turning green
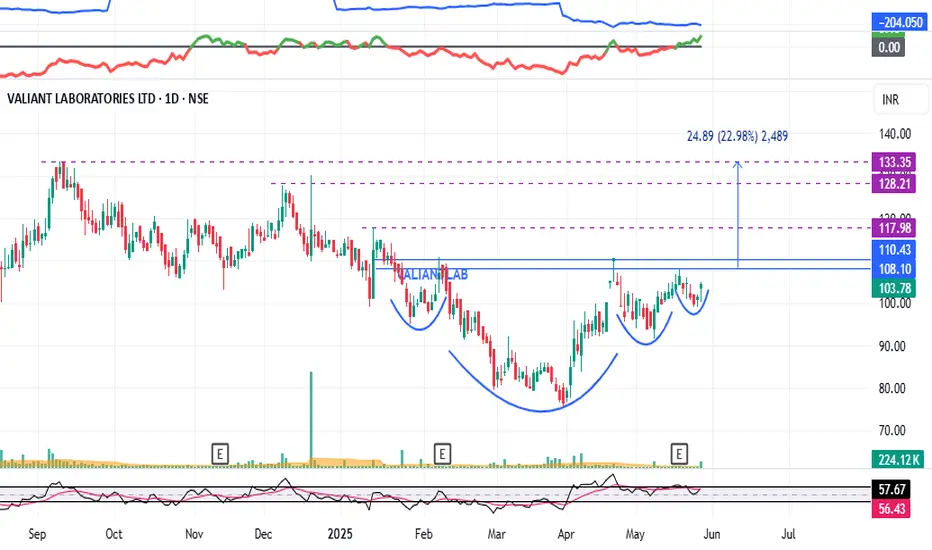
VALIANTLAB : Breakout Candidate (Swing Pick)#VALIANTLAB #swingtrading #breakoutstock #momentumstock
VALIANT LAB : Swing Trade
>> Cup & Handle Formation Visible
>> VCP Structure also Visible
>> Good Strength in stock
>> Volume Contraction seen, Expansion imminent
>> Potential Upside 23%
Swing Traders can lock 10% profit and keep trailing.
Disc : Stock chart shared for Learning Purpose and not a Trade recommendation.
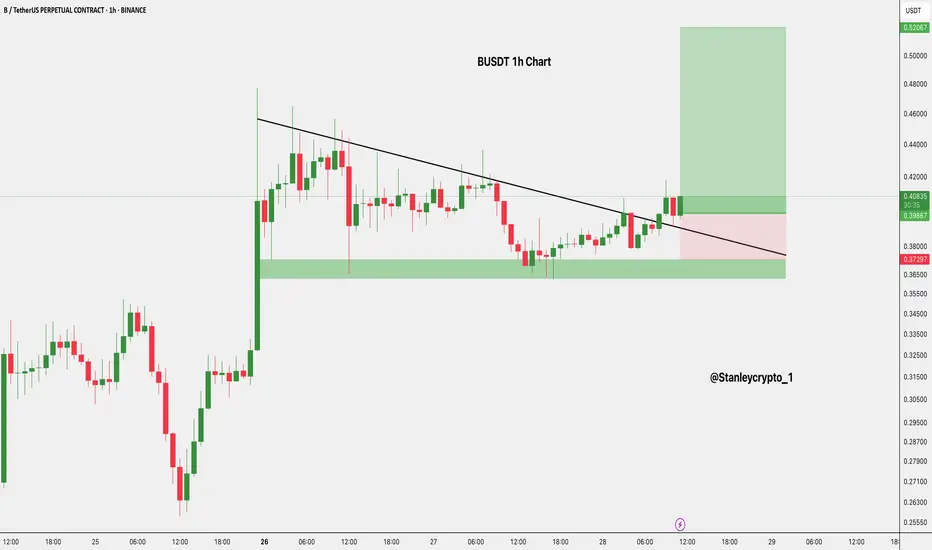
$B Long Setup 1H Chart Price has broken out of the trendline and is retesting the breakout zone
Strong support is seen around the $0.36–$0.37 demand zone.
- Entry: CMP
- Stop Loss: $0.37297
- Targets:
• TP1: $0.44455
• TP2: $0.53243
DYOR | NFA
MAXHEALTHCARE - Could Breakout from DTHMAXHEALTHCARE has resistance weakening on the Daily charts and may give a breakout with good volume in coming days.
The target of this pattern signals an upside potential of 15% from the current price level in the medium term.
The stock is trading above its 50- and 100-day exponential moving averages (EMAS) recently. Look for the range to more than 1.5X, and the Volume 1.5X the average.
CMP- Rs. 1149
Entry Price- 1200
Target Price- Rs1380 (15% upside)
SL- 1142
Need to wait for the entry to get triggered.
Disclaimer: This is not a buy/sell
recommendation. For educational purpose only. Kindly consult your financial advisor before entering a trade.

DEEPAK FERTILIZER - Breaking Out in DTF, New ATHDEEPAKFERT has resistance weakening on the Daily charts and has given a breakout with good volume and making a new ATH.
The target of this pattern signals an upside potential of 20% from the current price level in the medium term.
The stock is trading above its 50- and 100-day exponential moving averages (EMAS). The range is more than 1.5X, and the Volume is also 1.5X the average.
CMP- Rs. 1449.80
Target Price- Rs. 1650 (~20% upside)
SL- 1356
Disclaimer: This is not a buy/sell
recommendation. For educational purpose only. Kindly consult your financial advisor before entering a trade.

INOX WIND BREAKOUT Target Levels
- Short-Term Target: 204–211.
- Medium-Term Target: 261–343
Stop-Loss Levels
- Short-Term Stop Loss: 184.2 near immediate support
- Medium-Term Stop Loss: 157.1–153.8 strong support zone
- Long-Term Stop Loss: 170.6 major trend support

Bitcoin - Approaching the all time high!Bitcoin - CRYPTO:BTCUSD - will break out again:
(click chart above to see the in depth analysis👆🏻)
It has been quite some time since we saw such a strong move on Bitcoin. But finally - not totally unexpected to be honest - Bitcoin is following its destiny and about to create another new all time high. Patience is key and strategy, risk and mindset will help you master the volatility.
Levels to watch: $100.000
Keep your long term vision!
Philip (BasicTrading)

Equity Research Flash – BEML Ltd.CMP: ₹3,242.10 | Breakout From Falling Trendline
BEML has decisively broken out of a falling trendline and is now sustaining above a key consolidation zone. With strong bullish candles, a rising RSI, and healthy volume spike, the stock signals bullish momentum. Immediate resistance lies at ₹3,420–₹3,480. Sustained move above could target ₹3,750+. 20/50 EMA crossover supports the upward trend. Traders may consider entries on dips with SL near ₹3,080.
For educational purposes only

Equity Research Flash – Hexaware Technologies Ltd.CMP: ₹722.35 | Bullish Momentum Post Trend Reversal
HEXT shows a bullish breakout from a falling trendline, with RSI near 60 and strong volume uptick. The price reclaimed the 0.5 Fibonacci level, eyeing next targets at ₹749.85 (0.618) and ₹793.35 (0.786). Fundamentally strong with robust revenue growth, improving ROCE (26.4%), and low debt. A move above ₹750 could trigger further upside. Accumulate on dips with SL at ₹688.
Recommendation: Positive | Buy on Dips Near ₹700
For Education Purpose only

Bullish - Breakout observed from a descending channelEntry Zone: We recommend accumulating FSL in the zone of ₹375 - ₹385.
Target 1 (T1): ₹405
Target 2 (T2): ₹420
Target 3 (T3): ₹450 (If momentum sustains above T2)
Stop Loss (SL): ₹360 (Closing basis)
Rationale:
Channel Breakout: The stock has successfully broken out of a prominent descending channel, indicating a potential shift in momentum from bearish to bullish. This breakout is supported by decent volumes on the breakout candle.
RSI Confirmation: The Relative Strength Index (RSI) has shown a strong move above the 50-mark and is trending upwards, suggesting increasing buying interest and underlying strength.
Support from Previous Levels: The breakout retests appear to hold the previous resistance now acting as support, which is a classic bullish reversal pattern.
Risk-Reward: The current setup offers a favorable risk-to-reward ratio for short-term traders.
Key Risk: A close below ₹360 would negate the current bullish view and could lead to further downside. Traders should adhere strictly to the stop-loss.
Disclaimer: This report is for informational purposes only and does not constitute financial advice. Investors should conduct their own due diligence and consult with a qualified financial advisor before making any investment decisions. Equity investments are subject to market risks.

STAR breakout candidateThis is the chart of Strides pharma science ltd. The stock currently is trading sideways.
Stock has approached the resistance with very high relative volume.
Stock has continuously performed financially well with triple digit earnings growth and margins expansion.
The recent approach to resistance with very high relative volume suggests a high probability for breaking out resistance zone because the stock has very high earnings but not reflected in price hence the reason. Keep watching the stock.

Reversal Trade in ICICI Prudential1. Consolidation breakout
2. Positive Divergence on RSI
3. Volume pop up
4. MACD signal turning green
5. RSI near 70
6. Good weekly close

XAUUSD Bullish Flag Breakout – $4,300 Target in SightGold (XAU/USD) continues its strong bullish momentum in 2025, and the current price structure reveals a classic bullish flag pattern on the daily chart, suggesting further upside. This setup presents a potential continuation of the prevailing uptrend, possibly leading to new all-time highs in the coming months.
🟢 1. Clear Bullish Trend Foundation
Gold has been in a strong uptrend since late 2024, supported by:
Global inflationary pressures.
Geopolitical instability.
Central bank gold purchases and dollar weakness.
This uptrend is visually supported by a well-defined rising structure, with higher highs and higher lows.
📐 2. Bullish Flag Pattern Formation
The current price action has formed a bullish flag, a bullish continuation pattern that appears after a sharp rally. The flag represents a period of consolidation or pullback before the next impulsive move up.
The flagpole is the sharp rally that took place from mid-February to April 2025.
The flag itself is a downward-sloping channel or wedge, indicating temporary profit-taking or market indecision.
Volume typically decreases during the flag formation, then surges on breakout—confirming trend continuation.
This pattern is now showing signs of a breakout to the upside, suggesting the bulls are regaining control.
🔍 3. Key Technical Levels
🔹 Major Resistance Zone (~3,500–3,600):
This zone has acted as a supply region in the past.
Price is now testing this level and attempting a breakout.
A successful retest of this zone as new support will confirm the breakout.
🎯 Projected Target: $4,300+
Measured move target based on the flagpole’s height.
Clean projection points to the 4,300–4,350 area as the next major upside objective.
🛑 Support & Stop-Loss :
Strong support exists around $3,125, aligning with the flag base.
This area is a logical stop-loss zone for traders entering on the breakout.
🔁 4. Expected Price Behavior
Breakout: Price is expected to break above the flag resistance and the horizontal supply zone.
Retest Phase: A pullback toward the breakout zone (~3,600) could occur before the next impulsive move. This would offer a prime buy-on-dip opportunity.
Final Impulse: A sharp rally could follow, targeting the 4,300+ region.
💡 5. Trading Psychology Behind the Setup
During the flag formation, short-term traders take profit, and new buyers hesitate due to perceived overbought conditions.
However, the overall market sentiment remains bullish, with larger players accumulating during dips.
Once the resistance breaks, fear of missing out (FOMO) often drives prices sharply higher.
⚠️ 6. Risk Factors to Watch
Sudden USD strength or rising real yields.
Geopolitical de-escalation that reduces safe-haven demand.
FOMC rate surprises or unexpected hawkish policy shifts.
✅ Conclusion: Bullish Breakout Setup in Play
Gold is poised for another leg up after completing a textbook bullish flag pattern. With macroeconomic tailwinds and a solid technical base, this setup offers a high-probability long opportunity targeting the $4,300 zone. Watch for a confirmed breakout and possible retest to load long positions with solid risk-reward.

Higher High Higher Low intact!BFBIO Closed at 185.09 (25-05-2025)
Important to Cross & Sustain 188 - 189
o Monthly basis; only then it may move towards
215+
On the flip side, Important Support seems to be
around 164 - 169 and then 156 - 157

Momentum Trade in Dam Capital1. Resistance breakout
2. Positive Divergence on RSI
3. Volume pop up
4. MACD signal turning green
5. RSI near 70

HDFC BANK ANALYSIS – 1H TIMEFRAMENSE:HDFCBANK
Symmetrical Triangle Pattern Forming
A breakout or breakdown is likely soon. Price is consolidating within the triangle range.
HDFC BANK ANALYSIS ON 1 HOUR TIME FRAME
IMPORTANT LEVELS TO WATCH:
Resistance: 1941 – 1958 – 1970
Support: 1913 – 1898 – 1885
📌 Chart Pattern: Price is forming a symmetrical triangle which indicates a potential breakout or breakdown.
A breakout above 1941.75 (purple line) can trigger a bullish move.
A breakdown below 1913.25 (purple line) can attract sellers.
📌 Wait for a breakout confirmation before entering a trade.
👉🏻 @thetradeforecast

Gold - This is still clearly not over!Gold - TVC:GOLD - just needs a moment to breathe:
(click chart above to see the in depth analysis👆🏻)
It is just incredible how Gold has been rallying lately. Just over the past 1.5 years, Gold is up another +80% and is creating new all time highs every month. Since these strong rallies continue a lot longer than most people think, Gold still has significant upside potential.
Levels to watch: $3.500, $4.000
Keep your long term vision!
Philip (BasicTrading)

Is this a platinum breakout?Using a weekly chart of a platinum ETF.
Breaking out above it's triangle pattern. Needs confirmation though or retrace in the next coming months

Amara Raja Energy & Mobility Limited Trend Reversal On ChartAmara Raja Energy & Mobility Limited, a flagship company of the group, is India’s largest manufacturer of automotive and industrial batteries. The company also produces Li-ion cells and battery packs for electric vehicles and the telecom industry.
At current price it looks very attractive for short term gains .
Short term target may show Up move to 1100 levels and initial support at 996
long term target intact 1700-1860 levels.

Bitcoin - All time highs will come next!Bitcoin - CRYPTO:BTCUSD - prepares a significant move:
(click chart above to see the in depth analysis👆🏻)
Over the past couple of months, we basically only saw sideways price action on Bitcoin. However, this does not mean, that Bitcoin is now slowing down; actually the opposite is true and Bitcoin is setting up for a major move higher. New all time highs will come very soon.
Levels to watch: $100.000
Keep your long term vision!
Philip (BasicTrading)

Massive Move Incoming? CCL PRODUCTS LTD Price Prediction!Trade Recommendation
Buy Strategy
Entry Point: ₹850-860 (after confirmation of breakout above the Strong High)
Target Price: ₹928 (next resistance level)
Stop Loss: ₹800 (below nearest support zone)
Sell Strategy
Entry Point: Below ₹850 (if rejection happens near the Strong High)
Target Price: ₹700 (next support zone)
Stop Loss: ₹900 (above resistance level)
Technical Observations
Resistance Zones: ₹900
Support Zones: ₹700
RSI: Check for overbought or oversold levels to confirm entry
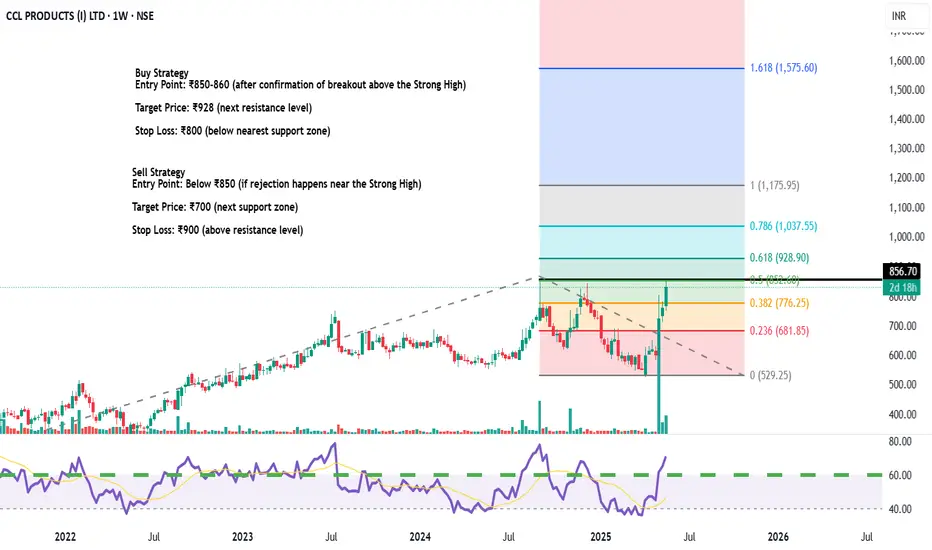
HH HL expected
Closed at 181.77 (20-05-2025)
Bullish divergence on DTF.
Breakout Done.
Currently at Resistance level.
Important to Sustain this level for
further upside towards 187 - 190
Important Support for now is around
175 - 176 & then around 168.50
