Dow Could Be Gearing Up for a Run Toward 50,000We’ve seen it before—and we might be seeing it again . The Dow Jones is showing a familiar pattern, and here’s what’s happening:
The index has been repeatedly hitting the 1.618 Fibonacci extension from previous ranges.
Right now, we’re approaching the 100% extension between the last swing high (~45,000) and swing low (~36,600).
If the Dow breaks above that previous high at 45,000, there's a good chance we’ll see the pattern repeat—with 50,000 as the next target.
It’s all about that breakout confirmation. Until then, we watch and wait.
This market has a memory—let’s see if it chooses to repeat it again.
Breakoutwatch

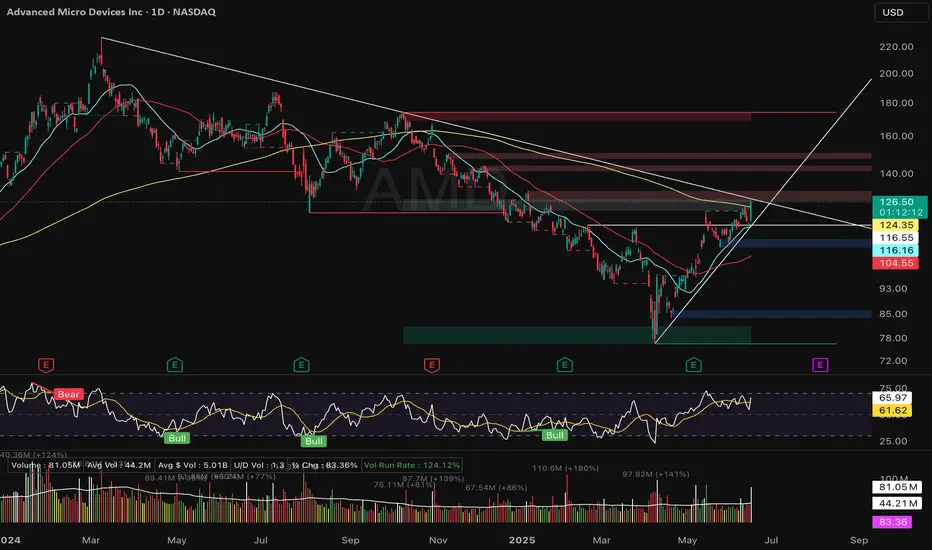
AMD – Breakout Watch (Daily Chart)NASDAQ:AMD surged +9.12% on June 16 with volume 1.8× above average, reclaiming the 200-day SMA for the first time in 7 months.
This marks a clear character change, but not yet a setup. Price stalled into multi-quarter trendline resistance around 128–130.
No pivot, no contraction — just strength into supply. Still needs to consolidate below trendline resistance for a valid trade.
Key Levels:
• Resistance: 130 / 145
• Support: 124.35 (breakout zone), 116.55 (MA stack)
• Watch for: Tight coil, volume dry-up, pivot pattern formation
Not chasing — watching for structure. Patience is a position.
📉 Weekly chart also reclaimed 30-week MA for the first time since Nov ’24.
#AMD #technicalanalysis #breakoutwatch #tradingview
Expecting volatility this week and nextAMC is currently testing the macro resistance for the 4th time.
The stock is currently getting pinched between the Bollinger Bands.
RSI is oversold on all timeframes.
In 2021, AMC started making moves after MLK day.
Hell of a lot of options expiring on Friday.
Impossible to say if it will be a bullish or bearish move considering everything we've seen with this stock. If it does reject this macro resistance again, AMC is hitting 0$ at the end of the month/start of Feb.
(White dotted lines are just historical support and resistances I'm keeping an eye on)

The Dow Jones Has Bullishly Confirmed A Partial DeclineBoth the DJI and the SSPX have been trading within this Descending Broadening Wedge since the year begun and both have shown Bullish Variables that have allowed it to hold above a Horizontal Support Level. In this time The Potential for a Partial Decline has made itself present on the chart but the SPX has yet to confirm the Partial Decline of the Descending Channel. However, where the SPX has so far failed to the Dow has Succeeded in that it has come back up to challenge the Supply Line of the Broadening Wedge after having failed to come back down 100% of the way to test the Demand Line thanks to it being held up by a strong weekly horizontal support level and some strong amounts of Bullish Divergence at that very level.
If we are to go by Bulkowski's statistics for Descending Broadening Wedge Partial Declines the DJI now has an 87% chance of successfully breaking out of the Wedge to the upside. The measured move for such a pattern would take us back up to the inception of the pattern. I personally will be targeting the 0.886 and 1.13 Retraces.
Hopefully this will be a sign of things to come to the SPX which is still trading near it's Equally as Important Horizontal Support Level.

BTC Bullish Cypher Update #3: A Falling Wedge AdditionSince first identifying this Cypher on the weekly I have noticed that BTC seems to have been trading within this huge Falling Wedge and now this week after bouncing up from a much Smaller Daily Timeframe Bullish Shark for the second time, it is attempting a weekly Breakout of the more prominent Falling Wedge.
The Measured Move for this wedge breakout would be around a $29,580 upside move to which would take us very close to the 61.8% Retrace from high to low at $49.6k.
We currently have Multiple Harmonic Supports between $18.5k and $17.5k along with an Equally as strong Price Action Support Floor at around $18.5k based off of some weekly candle closes we got in 2017 and in 2020.
A screanshot of the much smaller Daily Bullish Shark can be seen here on the CME chart but can also be seen on the Bybit chart underneath the CME screenshot in the Related Ideas tab below:

$ADMQ watch on 4 hourWe are looking for an entry on this one.
Has some great potential for profits if played correctly

$LAZR - HERE WE GO!If it can hold the .50 cent barrier, which is a psychological hurdle, them $38 is next. Past $39.50 there's not much resistance.

$OEG - alternative way to look at itTo prove my point that there is more than one way to look at a stock. Some people may be playing with the level of this yellow line. A break above it would be a buy signal for some. A break above my consolidation from the previous post would be a buy signal for others. The trick is...which do you think is more valid? What are other traders looking at?
The reason chart patterns work is that they are self fulfilling prophecies. Others are all looking at the same patterns and entering or exiting based on rules that everyone agrees on. Just food for thought on a Friday.
As always, not investment advice. Just things I have learned along the way.
Have a great weekend!

$OEG - Still waitingConsolidation still valid. I am in. Waiting for a break higher.
1: You could enter now
2: You could wait for the breakout
3: You would wait for the breakout, then a retest to confirm new support.
Always more than one way to play a stock. Just depends on your own risk tolerance.

$LAZR - Creeping on a R2G dayR2G and now creeping up to that resistance line. Let's see if it can break through today.

Microsoft, hello 230+ Long time consolidation here from Microsoft
Lets note the volume push right around the POC and volume shelf right to the top of the triangle.
Nice push, and a couple of dojis tell us the bulls are really staying in the game here
The possibility increases that we can see a nice end of year push to 230+
Come join us for more charts like this, and live stock alerts and news: kick-assets.com/join/
Good luck all and happy trading!!

NIO, back with another one, strong 2020 finish still in progressWell guys, I dont think anyone saw that offering coming, as we say, anything can happen in the stock market!
I've made some adjustments to the previous chart.
We can see a clear break out of the falling wedge, and a nice move over the POC on the volume shelf.
Green lines are support/resistance. Purple line indicates a pure bullish takeover.
Huge spike friday possibly indicating big short positions being closed.
We've completed the pullback(imo), and are ready for a fresh run.
Catalyst:
Biden in office with his new advisor, who is a Blackrock advisor( Own over 50 million Nio shares)
Possible rollout of new sedan model
New deal for 100 charging stations across china
NIO day
Upgrades to autonomous technology
Possible update on robotaxi plans
Risks:
US-China tensions
Any risks of delisting
More share dilution
Come join us for more charts like this, and live stock alerts and news: kick-assets.com/join/
Good luck all happy trading this week!!

Trading in a range, should yield a large breakThe pattern has resolved and it appears we are trading in a range with some relatively tight price action. A brief break to the upside did not have the power to reach through higher fibs but should give some idea of what type of move this range could yield.Watching, with alerts set for a break of the range and fib.

$MCHP resolutionA bit range bound narrowing for 6 months. Will declare itself soon. #breakoutwatch $MCHP

XBI Breakout or Fakeout?Is it returning to the point of break out or faking out and heading much lower?

GDX NUGT DUST JNUG JDSTselling probably done..watch for b/o..bias is long jnug nugt gdx, short jdst dust
