Bitcoin Hourly Chart Showing Bearish After BreakDownBitcoin LTF Chart Analysis:-
1. Bitcoin's price is taking a hit and currently hovering below the critical $22,500 resistance level.
2. The price is displaying bearish signs and has fallen beneath the 100 SMA, indicating a bearish trend.
3. On #Binance BTC/USD hourly chart, a significant bearish trend line is forming near $22,150, further adding to the negative sentiment.
4. A potential close below the support level of $22,150 could result in a significant decline in #bitcoin price, which investors should be wary of.
5. Despite the current market conditions, there is always the potential for a rebound, so keep a close eye on the market for any changes in sentiment.
Bitcoin Chart Analysis by CryptoPatel:-
The Bitcoin price attempted to recover from the $22,000 support zone and climbed above $22,250 and $22,400 levels. However, the bears prevented further gains near the $22,600 level, leading to a sharp decline below $22,200 and $22,000 levels. The price formed a low around $21,900 and is currently consolidating losses.
Bitcoin is now trading below $22,160 and the 100 SMA, testing the 50% Fib retracement level of the recent decline from the $22,600 high to $21,900 low.
The immediate resistance level is around $22,200, with a key bearish trend line forming on the hourly chart of the BTC/USD pair near this level.
The next significant resistance is near the $22,400 zone, which is close to the 76.4% Fib retracement level of the recent decline from the $22,600 high to $21,900 low. The primary barrier is now near the $22,750 zone, and a close above this resistance could initiate an upward move towards the $23,250 resistance level.
The next crucial resistance is near the $23,800 zone, which, if surpassed, might trigger a significant rally in Bitcoin's price.
Key Points:-
1. Bitcoin attempted to recover from the $22,000 support zone but faced resistance near $22,600, resulting in a sharp decline below key support levels.
2. Bitcoin is currently trading below $22,200 and the 100 SMA, testing the 50% Fib retracement level of the recent decline from the $22,600 high to $21,900 low.
3. The primary resistance level for Bitcoin is near the $22,800 zone, and a close above this level could initiate an upward move towards the $23,250 resistance level. Investors should closely monitor the market for any significant developments, including a potential rally if this resistance level is overcome.
Summary:-
In summary, Bitcoin's price faced rejection near the $22,600 level and experienced a sharp decline below key support levels.
The price is now consolidating losses and testing important resistance levels. Investors should closely monitor the market for any significant developments, including a potential rally if the $22,750 resistance is overcome.
More Downtrend In Bitcoin?
Bitcoin's price is facing a critical resistance zone around $22,200 and $22,400, and if it fails to break above this level, it may trigger another decline. Immediate support is near the $22,000 zone, with the next major support at $21,800, below which the price might drop to $21,200.
The subsequent significant support level is around $20,600, and any further losses may lead to a decline towards the psychological level of $20,000.
Traders and investors should monitor the market closely for any significant developments, including a potential breach of key support levels, which could indicate a further downward trend.
It is essential to keep a close eye on technical indicators like the Relative Strength Index (RSI) and Moving Average Convergence Divergence (MACD) to assess the market's sentiment and momentum accurately.
If you found my analysis and content informative, please consider liking and sharing it with others who may find it valuable.
Additionally, if you want to stay up-to-date with my latest insights, feel free to follow me.
Thank you for your support!
Brekaout

EOSC - falling wedgeOut of space soon. It had a nice pump so attention is there.
Details on the chart
Good luck traders

AMERICAN EXPRESS C- BEARISH SCENARIOOver the past year, many American Express Company insiders sold a significant stake in the company. The biggest single sale by an insider was when the Chairman & CEO, Stephen Squeri, sold US$8.6m worth of shares. Not only that but the company`s local unit in Australia (AmEx) was taken by the Australian securities regulator for a misleading credit card program.
The expectations are for a breakout of the local trend and a continuation of the major downtrend.
Price target $132
Risk Disclosure: Trading Foreign Exchange (Forex) and Contracts of Difference (CFD's) carries a high level of risk. By registering and signing up, any client affirms their understanding of their own personal accountability for all transactions performed within their account and recognizes the risks associated with trading on such markets and on such sites. Furthermore, one understands that the company carries zero influence over transactions, markets, and trading signals, therefore, cannot be held liable nor guarantee any profits or losses.

Falling Wedge - BreakoutDDOG starting to look quite nice here as buyers are starting to step in so long that the broader markets don't pullback. DDOG has been holding a big falling wedge for quite some time, getting rejected by the 20-day SMA, however will be keeping a close eye on DDOG with buyer volume starting to increase relative to seller volume. Bullish and will be looking for a breakout from this wedge (Broader Market Conditions Permitting)- Just some support and resistance levels to watch along with some RSI-based supply and demand zones to keep an eye on in the meantime
**(See Attached PT's &Charts Below)**
Daily Timeframe
- Bullish Hidden Divergence on the RSI
- Falling Wedge
- Bollinger Bands Squeezing
4-Hour Timeframe
- Bollinger Bands Squeezing
- Falling Wedge
- Bullish Gartley Harmonic Pattern
PT1- $89.90
PT2- $95.37
PT3- $99.34
PT4- $103.39+

Very BIG Breakout in Bajaj FinanceStock Name : NSE:BAJFINANCE
Pattern : Inverted Head & Shoulders
Target : Mentioned in the chart
Entry : Mentioned in the chart
Stop Loss : Mentioend in the chart
This is for Education purpose only

Bitcoin Lower Time Frame Chart Analysis#Bitcoin LTF TA Update:-
#BTC Breakout + Retest ✅
Target = $20900
Stop Loss:- $19700
Support:- $19800
Resistance:- $20900

Meliá Hotels (MEL.mc) bearish scenario:The technical figure Descending Triangle can be found in the daily chart in the Spanish company Meliá Hotels International, S.A. (MEL.mc). Meliá Hotels International, S.A. is a Spanish hotel chain. The company is one of Spain's largest domestic operators of holiday resorts and the 17th biggest hotel chain worldwide. Domestically in Spain the company is the market leader in both resort and urban hotels. Currently the hotel chain operates 374 hotels in 40 countries on 4 continents under the brands Meliá, Gran Meliá, ME by Meliá, Paradisus, Innside by Meliá, TRYP by Wyndham, Sol Hotels and Club Meliá. The Descending Triangle broke through the support line on 08/09/2022, if the price holds below this level, you can have a possible bearish price movement with a forecast for the next 42 days towards 4.586 EUR. Your stop-loss order, according to experts, should be placed at 6.560 EUR if you decide to enter this position.
A venture of Falcon’s Beyond and Spain’s Meliá Hotels is merging resorts and entertainment, hoping to lengthen guest stays and spending.
A major European hotel operator and an Orlando, Fla.-based entertainment company are starting two new brands that will add theme parks and other entertainment to resort properties, the latest effort to cash in on what the hospitality industry calls “resortainment.”
Meliá Hotels International SA, a Spanish lodging chain with 380 hotels across nearly four-dozen countries, and its joint-venture partner, Falcon’s Beyond Global LLC, will build attractions such as interactive theaters, virtual-reality games and minigolf at existing Meliá properties.
Risk Disclosure: Trading Foreign Exchange (Forex) and Contracts of Difference (CFD's) carries a high level of risk. By registering and signing up, any client affirms their understanding of their own personal accountability for all transactions performed within their account and recognizes the risks associated with trading on such markets and on such sites. Furthermore, one understands that the company carries zero influence over transactions, markets, and trading signals, therefore, cannot be held liable nor guarantee any profits or losses.


XAUUSD SHORT Looking short entry on gold. trend line Break out and retest. after conformation enter. take the trade your own risk.

XRP: If we break we sell!!XRP
Intraday - We look to Sell a break of 0.3479 (stop at 0.3581)
Daily signals are mildly bearish. Bespoke support is located at 0.3500. A break of 0.3480 is needed to confirm follow through negative momentum. 50 4hour EMA is at 0.3545.
Our profit targets will be 0.3215 and 0.3115
Resistance: 0.3700 / 0.3800 / 0.3900
Support: 0.3600 / 0.3500 / 0.3400
Please be advised that the information presented on TradingView is provided to Vantage (‘Vantage Global Limited’, ‘we’) by a third-party provider (‘Signal Centre’). Please be reminded that you are solely responsible for the trading decisions on your account. There is a very high degree of risk involved in trading. Any information and/or content is intended entirely for research, educational and informational purposes only and does not constitute investment or consultation advice or investment strategy. The information is not tailored to the investment needs of any specific person and therefore does not involve a consideration of any of the investment objectives, financial situation or needs of any viewer that may receive it. Kindly also note that past performance is not a reliable indicator of future results. Actual results may differ materially from those anticipated in forward-looking or past performance statements. We assume no liability as to the accuracy or completeness of any of the information and/or content provided herein and the Company cannot be held responsible for any omission, mistake nor for any loss or damage including without limitation to any loss of profit which may arise from reliance on any information supplied by Signal Centre.

Airbus (AIR.pa) bullish scenario:The technical figure Falling Wedge can be found in the daily chart in the French company Airbus SE (AIR.pa). Airbus SE is a European multinational aerospace corporation. Airbus designs, manufactures and sells civil and military aerospace products worldwide and manufactures aircraft in Europe and various countries outside Europe. The company has three divisions: Commercial Aircraft (Airbus S.A.S.), Defence and Space, and Helicopters, the third being the largest in its industry in terms of revenues and turbine helicopter deliveries. As of 2019, Airbus is the world's largest airliner manufacturer. The Falling Wedge has broken through the resistance line on 08/07/2022, if the price holds above this level, you can have a possible bullish price movement with a forecast for the next nine days towards 99.80 EUR. Your stop-loss order, according to experts, should be placed at 88.91 EUR if you decide to enter this position.
Qatar Airways has indicated that a provisional agreement to buy up to 50 Boeing 737 MAX jets has lapsed, Boeing's rival Airbus said in a court document released on Thursday.
The deal, signed in Washington in January, is part of a series of inter-locking agreements caught up in a London court dispute between Airbus and the Gulf carrier over a larger jet.
Airbus requested a copy of the Boeing 737 MAX agreement after the airline brought it up as part of its bid for compensation for damage to the A350, now worth $1.4 billion.
Risk Disclosure: Trading Foreign Exchange (Forex) and Contracts of Difference (CFD's) carries a high level of risk. By registering and signing up, any client affirms their understanding of their own personal accountability for all transactions performed within their account and recognizes the risks associated with trading on such markets and on such sites. Furthermore, one understands that the company carries zero influence over transactions, markets, and trading signals, therefore, cannot be held liable nor guarantee any profits or losses.

2306 GOLD New Plan to sell to break 1800Hello traders,
GOLD is not a good idea to buy based on this 6h chart.
Our last idea to buy with a ascending channel has failed as price turn down to break the support line.
And a retest of the support line after breaking with bearish candle on 6H chart is sending a signal to sell now.
So keep eyes on the bottom three dash lines which could be targets for sellers.
GOOD LUCK ON THIS NEW PLAN TO SELL NOW.
LESS IS MORE!

Sonova Holding AG bearish scenario:The technical figure Descending Triangle can be found in the Swiss company Sonova Holding AG (SOON.vx) at daily chart. Sonova Holding AG is an internationally active Swiss company headquartered in Stäfa that specializes in hearing care (hearing instruments, cochlear implants, wireless communication). It is one of the largest providers in the sector worldwide. The group operates through its core business brands Phonak, Unitron, Hansaton, Advanced Bionics and AudioNova. The Descending Triangle has broken through the support line on 17/06/2022, if the price holds below this level you can have a possible bearish price movement with a forecast for the next 32 days towards 259.20 CHF. Your stop loss order according to experts should be placed at 351.20 CHF if you decide to enter this position.
Sonova said it had faced shortages of microelectronic components towards the end of the first half. The disruptions to the global economy during the pandemic have upset supply chains across continents, causing shortages of goods and services, including microelectronic components used for hearing aid.
Risk Disclosure: Trading Foreign Exchange (Forex) and Contracts of Difference (CFD's) carries a high level of risk. By registering and signing up, any client affirms their understanding of their own personal accountability for all transactions performed within their account and recognizes the risks associated with trading on such markets and on such sites. Furthermore, one understands that the company carries zero influence over transactions, markets, and trading signals, therefore, cannot be held liable nor guarantee any profits or losses.

MATIC Big Dump As our Analysis Hope you happy#MATIC Technical RoadMap:-
$MATIC Broke Local Range And Currently Trading above Year 2021 Accumulation Zone.
Expecting 40% upward move Before Another -50% Drop.
IMO Best Buy zone Will Be $0.210 For Long Term Holders.
Hope you happy.

✅EUR_NZD NEXT MOVE|SHORT🔥
✅EUR_NZD is approaching a supply level
So according to our strategy
We will be looking for the signs of the reversal in the trend
To jump onto the bearish bandwagon just on time to get the best
Risk reward ratio for us
SHORT🔥
✅Like and subscribe to never miss a new idea!✅

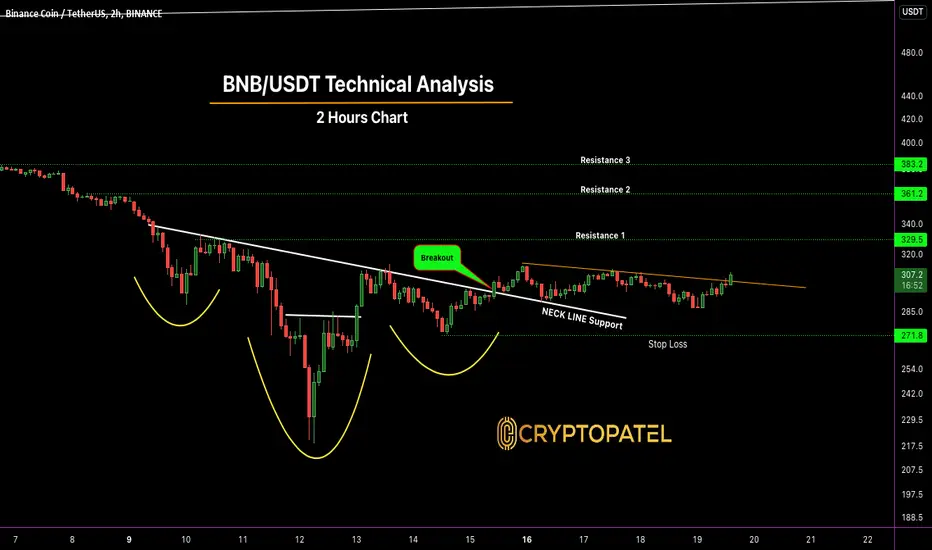
BNB/USDT now in Good profit and What next?#BNBUSDT Inverted H&S Chart:
- #BNB Bullish Entry was $292✅
- Breakout + Retest =✅
- I am expecting a Bullish Upward Move
- Targets = $329/$361/$383
- Strict Stop Loss = $271
Like and share if you are also in Profit.
GOLD Breakout Short! Sell!
Hello,Traders!
GOLD broke the rising support line
Went down and is now retesting the line
Which is now a resistance level
From where I think the price will go lower
To retest the target level below
Sell!
Like, comment and subscribe to boost your trading!
See other ideas below too!

BTC Monthly support holding.Macro (as a lengthening cycle) is supremely bullish. So far monthly has held. 80% probability we break up from this symmetrical triangle drawn from the inside bar consolidation.

USD-JPY Breakout At Last! Sell!
Hello,Traders!
USD-JPY was trading in an uptrend
For a very long time
But now we are finally seeing a bearish breakout
And as the correction is overdue
I am expecting a move down
Towards the target below
Sell!
Like, comment and subscribe to boost your trading!
See other ideas below too!

Novartis (NOVN.vx) bullish scenario:The technical figure Double Bottom can be found in the Swiss company Novartis International AG (NOVN.vx) at daily chart. Novartis International AG is a Swiss multinational pharmaceutical corporation. It is one of the largest pharmaceutical companies in the world. Novartis manufactures the drugs clozapine (Clozaril), diclofenac (Voltaren), carbamazepine (Tegretol), valsartan (Diovan), imatinib mesylate (Gleevec/Glivec), cyclosporine (Neoral/Sandimmune), letrozole (Femara), methylphenidate (Ritalin), terbinafine (Lamisil), deferasirox (Exjade), and others. The Double Bottom has broken through the resistance line on 07/04/2022, if the price holds above this level you can have a possible bullish price movement with a forecast for the next 29 days towards 86.88 CHF. Your stop-loss order according to experts should be placed at 72.50 CHF if you decide to enter this position.
Novartis CEO Vas Narasimhan is continuing his shake-up of the giant Swiss drugmaker, announcing a corporate restructuring on Monday that the company says will simplify its organizational chart and bring more than $1 billion in annual savings.
Novartis AG NVS announced that the FDA has approved its kinase inhibitor, Vijoice (alpelisib), for the treatment of patients aged two years and above with severe manifestations of PIK3CA-Related Overgrowth Spectrum (“PROS”), requiring systemic therapy. Per the company, following the nod, Vijoice became the first FDA-approved therapy to treat PROS, which includes rare conditions where overgrowths and blood vessel anomalies occur.
Risk Disclosure: Trading Foreign Exchange (Forex) and Contracts of Difference (CFD's) carries a high level of risk. By registering and signing up, any client affirms their understanding of their own personal accountability for all transactions performed within their account and recognizes the risks associated with trading on such markets and on such sites. Furthermore, one understands that the company carries zero influence over transactions, markets, and trading signals, therefore, cannot be held liable nor guarantee any profits or losses.

XAUUSD Shortlooking short on GOLD. 1810-1812 levels are resistance levels. if market give us nice rejection on these levels we go for short. till 1830 we are looking short on GOLD.

USDCAD BUY SETUPLooking USDCAD to go long. trend line break out and retest in H4. use proper money management. later today FOMC news.

HEROMOTOCO looking bullish with 25% upsideNSE:HEROMOTOCO weekly chart is showing breakout from falling channel (wedge-ish) pattern with good volumes. As long as we stay above 2700 (daily closing basis), we might see 3500/3600 levels in weeks to come. Keep an eye!
