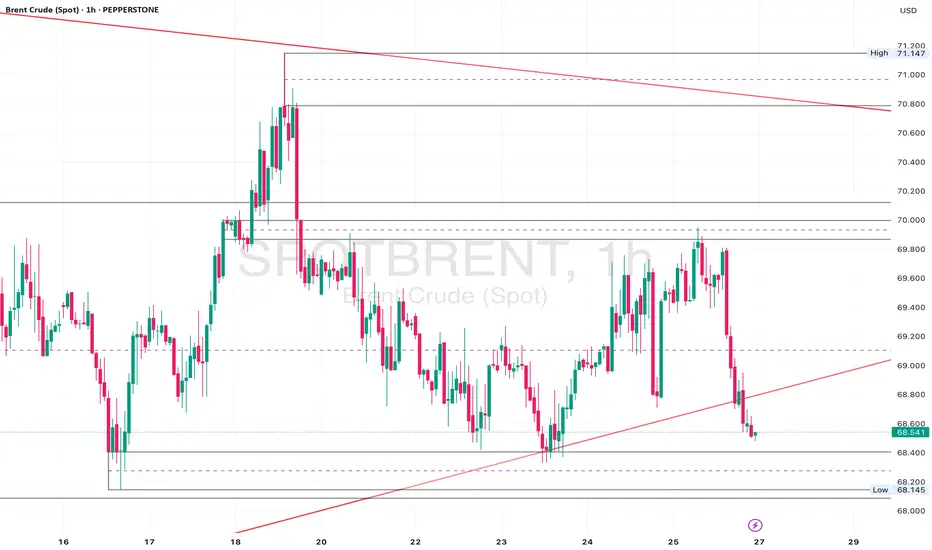
Brent Crude Sitting at Key Support – 69.20 Hold for a Rebound?Daily Analysis:
Price is holding above the ascending trendline and forming higher lows. Multiple rejections from the 68.00 region suggest strong demand. As long as we remain above the trendline, bulls stay in control.
4H Analysis:
Pullback after rejecting 71.00. Now sitting inside the 69.60–69.20 demand area. Bullish channel is still valid unless we break below 68.50.
1H Analysis:
Price broke the rising channel but is now hovering near key support. Bullish re-entry possible if lower timeframe aligns around 69.60.
Confirmation & Entry:
If we see bullish engulfing or pin bar at 69.60–69.20, this could signal a long setup back to 71.00. Invalidated on clean break below 68.50.
Brent
Brent Oil H4 | Heading into a swing-high resistanceBrent oil (UKOIL) is rising towards a swing-high resistance and could potentially reverse off this level to drop lower.
Sell entry is at 70.39 which is a swing-high resistance that aligns closely with the 78.6% Fibonacci retracement.
Stop loss is at 71.90 which is a level that sits above the 127.2% Fibonacci extension and a swing-high resistance.
Take profit is at 66.39 which is a swing-low support.
High Risk Investment Warning
Trading Forex/CFDs on margin carries a high level of risk and may not be suitable for all investors. Leverage can work against you.
Stratos Markets Limited (tradu.com ):
CFDs are complex instruments and come with a high risk of losing money rapidly due to leverage. 66% of retail investor accounts lose money when trading CFDs with this provider. You should consider whether you understand how CFDs work and whether you can afford to take the high risk of losing your money.
Stratos Europe Ltd (tradu.com ):
CFDs are complex instruments and come with a high risk of losing money rapidly due to leverage. 66% of retail investor accounts lose money when trading CFDs with this provider. You should consider whether you understand how CFDs work and whether you can afford to take the high risk of losing your money.
Stratos Global LLC (tradu.com ):
Losses can exceed deposits.
Please be advised that the information presented on TradingView is provided to Tradu (‘Company’, ‘we’) by a third-party provider (‘TFA Global Pte Ltd’). Please be reminded that you are solely responsible for the trading decisions on your account. There is a very high degree of risk involved in trading. Any information and/or content is intended entirely for research, educational and informational purposes only and does not constitute investment or consultation advice or investment strategy. The information is not tailored to the investment needs of any specific person and therefore does not involve a consideration of any of the investment objectives, financial situation or needs of any viewer that may receive it. Kindly also note that past performance is not a reliable indicator of future results. Actual results may differ materially from those anticipated in forward-looking or past performance statements. We assume no liability as to the accuracy or completeness of any of the information and/or content provided herein and the Company cannot be held responsible for any omission, mistake nor for any loss or damage including without limitation to any loss of profit which may arise from reliance on any information supplied by TFA Global Pte Ltd.
The speaker(s) is neither an employee, agent nor representative of Tradu and is therefore acting independently. The opinions given are their own, constitute general market commentary, and do not constitute the opinion or advice of Tradu or any form of personal or investment advice. Tradu neither endorses nor guarantees offerings of third-party speakers, nor is Tradu responsible for the content, veracity or opinions of third-party speakers, presenters or participants.

Brent Crude Oil loss of support now resistance at 7050Key Support and Resistance Levels
Resistance Level 1: 7050
Resistance Level 2: 7130
Resistance Level 3: 7220
Support Level 1: 6800
Support Level 2: 6700
Support Level 3: 6590
This communication is for informational purposes only and should not be viewed as any form of recommendation as to a particular course of action or as investment advice. It is not intended as an offer or solicitation for the purchase or sale of any financial instrument or as an official confirmation of any transaction. Opinions, estimates and assumptions expressed herein are made as of the date of this communication and are subject to change without notice. This communication has been prepared based upon information, including market prices, data and other information, believed to be reliable; however, Trade Nation does not warrant its completeness or accuracy. All market prices and market data contained in or attached to this communication are indicative and subject to change without notice.

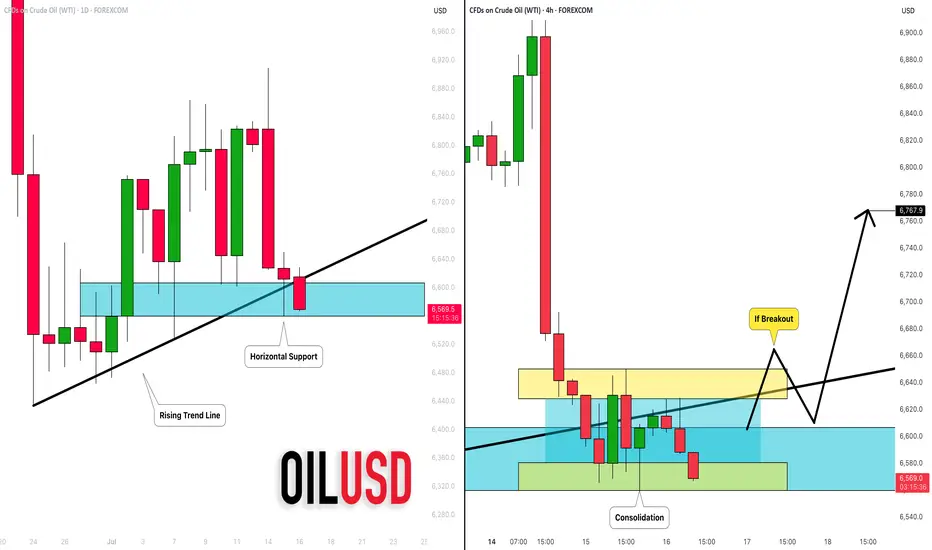
CRUDE OIL (WTI): Your Trading Plan Explained
Do not forget that today we expect Crude Oil Inventories data
release - it will be 10:30 am NY time.
Ahead of this news, the market is testing a significant daily support cluster
that is based on a rising trend line and a horizontal structure.
You signal to buy will be a bullish breakout of a minor intraday
horizontal resistance on a 4H.
4H candle close above 66,5 will be your confirmation.
A bullish continuation will be expected to 67.6 then.
I suggest waiting for the news release first and then check how
the market prices in the news. If our technicals align with fundamentals,
it will provide an accurate setup.
Alternatively, a bearish violation of a blue support will push the prices lower.
❤️Please, support my work with like, thank you!❤️
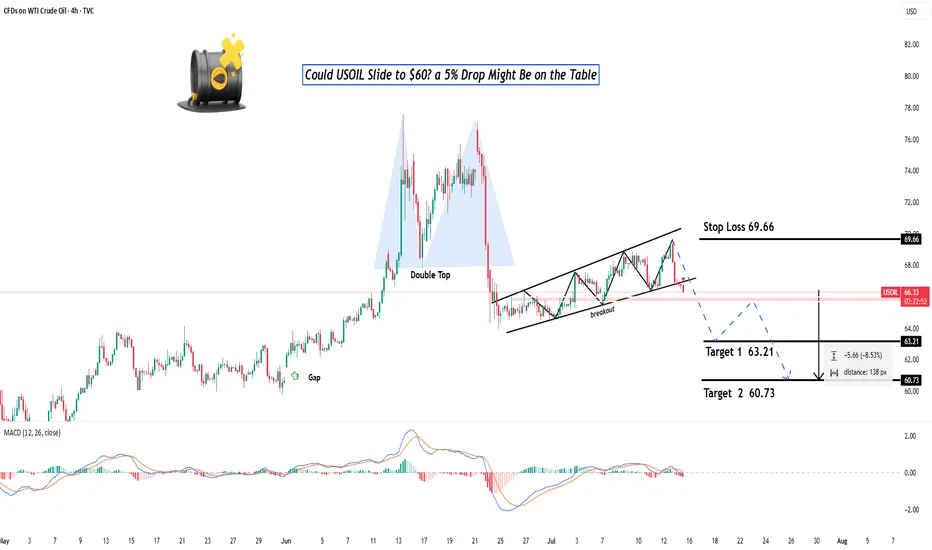
Could OIL Slide to $60? a 5% Drop Might Be on the Table? Hey Realistic Traders!
Price action is weakening. Will USOIL find support or slide further?
Let’s Break It Down..
On the 4H timeframe, oil has formed a double top pattern followed by a neckline breakout, which is a classic sign of a potential shift from a bullish to a bearish trend.
This breakout was confirmed by a break below the bullish trendline, accompanied by consecutive bearish full-body candlesticks that reinforce the bearish momentum. Afterward, the price formed a bearish continuation pattern known as a rising wedge, which was followed by a breakdown.
The combination of bearish reversal and continuation pattern breakouts signals further downside movement and confirms the shift into a bearish trend.
Therefore, we foresee the price forming lower lows and lower highs toward the first target at 63.21, with a potential extension to the close the gap at 60.73.
The bearish outlook remains valid as long as the price stays below the key stop-loss level at 69.66.
Support the channel by engaging with the content, using the rocket button, and sharing your opinions in the comments below.
Disclaimer: This analysis is for educational purposes only and should not be considered a recommendation to take a long or short position on USOIL.
"UK Oil/Brent Heist Plan: Thief Style Breakout Strategy"🛢️💣 "BRENT Energy Heist Plan 💸: The Thief Trader's Playbook to Rob the UK Oil Market!" 🔫📈
🚫 This is a creative and educational overview of a market strategy. It does not encourage illegal activity. Please trade responsibly and within your own risk tolerance.
🌍 Hola! Bonjour! Marhaba! Hello, Money Makers & Market Thieves! 🤑💰📊
Welcome to the Thief Trading Style — a unique, bold, and tactical approach to trading the UK Oil Spot (Brent) market like a pro bandit on Wall Street. We don’t chase the market… we set the trap, wait, and strike like skilled robbers at the vault. 🔓💼
🧠💡Game Plan Summary:
📌 Asset: UK Oil Spot / Brent
📌 Style: Day Trade / Scalping
📌 Bias: Bullish Breakout
📌 Thief’s Method: Layered DCA Entries, Breakout Setup, Swing-Based SL, Aggressive TP
🎯 ENTRY - “The Vault Break”
🚨 Codename: Break & Retest Mission
Wait for a clean breakout above the Moving Average Wall (around 70.500) followed by a retest confirmation. That’s your green light!
✅ Buy Stop Entry: Above 70.500 after a clean candle close & retest.
✅ Buy Limit (Pullback): Near recent swing low or 15–30 min timeframe zones. Use DCA or order layering to reduce risk.
📌 Tip: Set up alerts at the breakout level — never miss the move.
🛑 STOP LOSS - “Escape Route”
🎙️ "Yo, Thief Rule #1: Plan the exit before the entry."
📍 SL suggestion: Swing Low @ 64.000 (based on 2H structure).
🧠 Risk management is key – consider your lot size, margin, and how many layered orders you're stacking.
📢 Optional: Trail that SL once price moves in your favor — lock your loot!
💸 TAKE PROFIT - “The Clean Getaway”
🎯 Target: 72.200 — but don’t be greedy. If the market gets shaky, exit before the cops (sellers) show up!
📌 Be ready to close manually if you smell reversal.
🔍 Fundamentals & Macro View
UK Oil is experiencing strong bullish momentum, driven by:
📰 Geopolitical tensions
🛢️ Supply-demand imbalances
📊 Positive sentiment & institutional flow (Check COT, Macro Outlooks, and Sentiment Reports)
👉 Stay updated with news drops and macro data that can flip the script — set economic calendar alerts.
⚠️ News Release Survival Tips
❌ Avoid new entries during high-impact news.
✅ Use trailing SL to protect running trades.
🔄 Monitor position sizing — volatile swings can eat your equity.
💥 SUPPORT THE CREW!
If you’re vibing with this Heist-Style Trading Analysis, smash that ❤️ Boost Button on TradingView and join the growing crew of market robbers making money with precision and attitude! 🏆💰📈
🚨 More Heist Plans coming soon — follow for real-time setups & updates!
📌 DISCLAIMER:
This analysis is educational and based on personal trading style. Always DYOR (Do Your Own Research), and tailor trades to your own risk profile. Markets change fast — stay agile and sharp! 🧠💼

Crude oil $ukoil - Final falling oil has been a barometer of the financial market for the last decades.
I look at the formations and I see that we will see a renewal of the bottom in the coming months, I will not say the reasons, you just need to wait a little.
I've been talking about the fall for a long time, but it's not over yet.
After the final fall, I expect a renewal of the highs, due to the worsening situation in the Middle East, this will be after September
Best Regards EXCAVO

CRUDE OIL (WTI): Move Up Ahead!
Last week, I already shared a bullish setup on WTI Crude Oil
on a daily time frame.
I see a strong intraday bullish confirmation today.
After a test of an underlined blue support area,
the price went up strongly and violated a resistance line
of a bullish flag pattern on a 4H time frame.
The market is going to rise more.
Goal - 68.2
❤️Please, support my work with like, thank you!❤️
I am part of Trade Nation's Influencer program and receive a monthly fee for using their TradingView charts in my analysis.

Gold Bounces from Demand Zone – Next Targets in Sight!By analyzing the gold chart on the 4-hour timeframe, we can see that today, price once again dipped into our key demand zone (Bullish Rejection Block) between $3245 and $3262, where it faced strong buying pressure and rallied up to $3296.
Currently, gold is trading around $3281, and as long as price holds above $3273, we expect further upside. The next potential targets are $3294, $3300, and $3309.
🎥 If you enjoyed this video analysis and found it helpful, please show your support with a LIKE and COMMENT below!
These video-style breakdowns take time and effort, and I’ll only continue them with your support 🙌
Your engagement is my biggest motivation to keep going 💛
Thanks for being part of the journey!

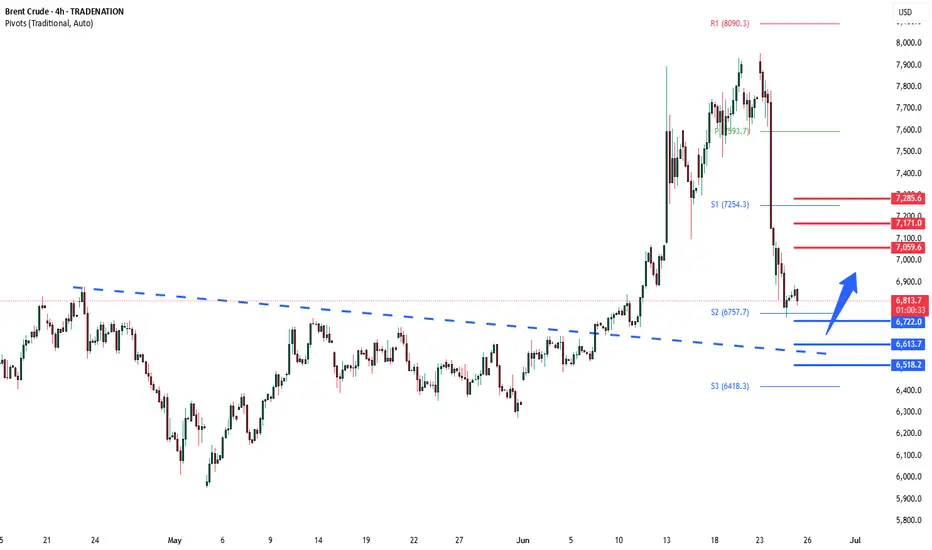
Bren Crude Oil important support at 6720Key Support and Resistance Levels
Resistance Level 1: 7060
Resistance Level 2: 7170
Resistance Level 3: 7280
Support Level 1: 6720
Support Level 2: 6610
Support Level 3: 6520
This communication is for informational purposes only and should not be viewed as any form of recommendation as to a particular course of action or as investment advice. It is not intended as an offer or solicitation for the purchase or sale of any financial instrument or as an official confirmation of any transaction. Opinions, estimates and assumptions expressed herein are made as of the date of this communication and are subject to change without notice. This communication has been prepared based upon information, including market prices, data and other information, believed to be reliable; however, Trade Nation does not warrant its completeness or accuracy. All market prices and market data contained in or attached to this communication are indicative and subject to change without notice.
Oil Price Falls Below $69Oil Price Falls Below Pre-Escalation Levels of Middle East Conflict
According to the XBR/USD chart:
→ Prior to Israel’s airstrikes on Iran on 13 June, the price of Brent crude was hovering around the $69.00 mark;
→ Following US bombings in Iran, the price spiked at the Monday market open, reaching a high of approximately $77.77 (as we reported on 23 June).
However, after President Trump announced a ceasefire between Iran and Israel — later confirmed by statements from both sides — oil prices dropped sharply. This morning, Brent is trading around $68, which is even lower than the level seen before the initial strikes.
Media outlets report that analysts broadly agree that fears have eased, even if the ceasefire appears fragile. Market participants seem to view the likelihood of the conflict escalating into a full-scale ground war — involving US troops and the closure of the Strait of Hormuz — as low. Shipping through the strait is reportedly returning to normal.
Technical Analysis of the XBR/USD Chart
Interestingly, the $69 level — from which prices surged on 13 June — acted as resistance yesterday (as indicated by the arrow on the chart).
It can be assumed that the longer the ceasefire holds, the less relevant the fears that have served as bullish drivers. In that case, Brent crude prices may continue fluctuating within a downward channel, outlined in red, with the possibility of a short-term rise toward its upper boundary.
Nevertheless, the key drivers for oil prices will remain the fundamental backdrop and official statements regarding the situation in the Middle East and other geopolitical factors.
This article represents the opinion of the Companies operating under the FXOpen brand only. It is not to be construed as an offer, solicitation, or recommendation with respect to products and services provided by the Companies operating under the FXOpen brand, nor is it to be considered financial advice.

Is the oil market signalling de-escalation?After an initial 6% spike at the open, U.S. crude oil futures reversed sharply—falling into negative territory—as markets priced in the possibility that Iran's latest retaliation may be more symbolic than escalatory.
According to President Donald Trump, Iran gave advance notice before launching missiles at a U.S. base in Qatar, allowing defences to intercept the attack and resulting in no reported casualties.
While Tehran publicly described the strike as “devastating and powerful,” the lack of impact on the ground and the pre-warning have fuelled speculation that Iran was aiming to save face without triggering a broader conflict.
The swift reversal in oil prices reflects that sentiment. For now, the market appears to be signaling that escalation may pause here.

Oil Price Surges at Monday Open Amid US Strikes on IranOil Price Surges at Monday Open Amid US Strikes on Iran
As shown on the XBR/USD chart, the Brent crude oil price formed a bullish gap at the opening of financial markets this Monday, surpassing last week’s high.
Only three days ago, we drew attention to Donald Trump’s statement that a decision regarding US involvement in the Iran-Israel conflict would be made within two weeks – yet over the weekend, US aircraft dropped bombs on Iran’s nuclear facilities.
Now oil prices are likely to be affected by Iran’s potential move to block shipping traffic through the Strait of Hormuz. According to Reuters, analysts suggest that in such a scenario, the oil price could climb to $100.
Technical Analysis of the XBR/USD Chart
The ascending channel plotted last week remains valid.
The fact that the price is pulling back (as indicated by the arrow) from the high set at the market open suggests the market had already priced in a significant risk of US involvement in the Iran-Israel military conflict.
Key points:
→ Technical support in the near term may be provided by the area where the lower boundary of the blue channel intersects with the $76 level (which acted as resistance at the end of last week).
→ Ultimately, fundamental factors and official statements will play a decisive role in oil price movements. It’s worth noting that, following the strikes on its territory, Iran is threatening retaliation against the US.
This article represents the opinion of the Companies operating under the FXOpen brand only. It is not to be construed as an offer, solicitation, or recommendation with respect to products and services provided by the Companies operating under the FXOpen brand, nor is it to be considered financial advice.

Oil panic buying after Iran Strikes?President Donald Trump has confirmed that the U.S., in coordination with Israel, has conducted three strikes on Iranian nuclear facilities.
Will there be panic buying of WTI and Brent at the open?
In response, Iran’s parliament has approved a proposal to close the Strait of Hormuz, a key global oil shipping route. The final decision lies with Iran’s Supreme National Security Council and Supreme Leader Ayatollah Ali Khamenei.
If a blockade is enforced, oil prices could rise sharply. ClearView Energy Partners estimates a short-term closure could add between $8 and $31 per barrel. JP Morgan has suggested that a full-scale conflict and complete shutdown could drive prices to $130.

Strait of Hormuz risk priced in—or not yet?Iran has repeatedly threatened to block the Strait of Hormuz during periods of heightened tension with the U.S., notably in 2011, 2018, and 2020. The Strait is considered the world’s most critical oil chokepoint, with nearly 20 million barrels passing through daily.
Several banks warn that a full closure could push crude prices above $120–$150 per barrel, or higher if the disruption is prolonged. Still, most analysts view a complete shutdown as unlikely, since Iran also depends on the Strait to export its own oil.
Technically, recent WTI candles suggest that the risk premium may be fading. Price action near $74 shows hesitation, raising the risk of a developing double top—particularly if support at $70 fails. Unless tensions escalate materially, such as the U.S. becoming more directly involved, WTI may consolidate between $70–$74.

Brent and WTI: Is $100 oil just Around the corner?#Brent and #WTI prices are steadily climbing, now reaching $73.30 and $71.15 per barrel. The market is showing strong signs of an upward trend, similar to what we saw in 2021–2022. With global demand picking up and increased interest from major market participants, analysts believe prices could soon push past the $100 mark — especially amid ongoing global tensions and rising consumption.
Standard Chartered forecasts Brent reaching $95 by December 2025, while some outlooks go even higher. What’s fueling this potential rally? Top 5 reasons oil may surge in the coming months:
Global instability : Tensions in the Middle East and unrest in key producers like Venezuela and Nigeria raise concerns about supply disruptions. Any flare-ups could push prices to $90, $95 — or beyond.
Economic recovery : Asia and developing economies are bouncing back fast. With industrial activity rising, so does energy demand — including for oil.
OPEC+ tight supply policy : OPEC+ is likely to maintain production cuts to support prices and keep the market balanced.
Low reserves, limited expansion : Stockpiles remain tight, and exploration has lagged in recent years. If demand spikes, producers may struggle to scale output quickly.
Aviation and petrochemicals rebound : Global air traffic and plastic manufacturing are growing, increasing demand for jet fuel and oil-based feedstocks.
Together, these factors create a strong setup for upward momentum in Brent and WTI prices. According to FreshForex analysts , the current levels could mark the beginning of a new growth cycle.

Time for a Rise in Oil Prices $$$When analyzing the recent movements in oil prices through the lens of Elliott Wave Theory, it appears that the current structure is completing an ABC corrective formation.
Initially, the A wave has developed as a strong upward 1-5 impulse structure.
The B wave evolved through a classic ABC correction, pushing prices down to the support area marked as (B).
Following this correction, early signals indicate the initiation of the C wave.
In this context, the technical structure suggests a potential new upward momentum in oil prices with the activation of the C wave. The target zone for the C wave should be monitored in consideration of the existing trendlines and historical resistance levels.
Nevertheless, under the current market conditions characterized by high volatility, it is critical to monitor volume and momentum indicators to confirm the C wave and ensure key support levels are maintained.

BRENT - UniverseMetta - Signal#BRENT - UniverseMetta - Signal
H4 - Breakout of the trend line + formation of ABC structure in continuation of the uptrend. It is better to reduce risks. Stop behind the minimum of wave C.
Entry: 74.929
TP: 78.405 - 83.274 - 86.179 - 91.207
Stop: 70.314

Oil Surges on Israel-Iran Nuclear Strike Fears🛢️ Israel’s attacks on Iran’s nuclear sites are pushing oil ( BLACKBULL:WTI , BLACKBULL:BRENT ) higher!
Bloomberg reports Trump’s G-7 exit and Tehran evacuation warning as Israel-Iran strikes intensify (June 17, 2025). Analysts warn of Strait of Hormuz risks, with 17M barrels/day at stake.
4H Chart Analysis:
Price Action: WTI ( BLACKBULL:WTI ) broke $75 resistance (June 2025 high), exiting a 3-week range. Brent ( BLACKBULL:BRENT ) mirrors at $78.
Volume: 4H volume spiked 15% vs. prior week, confirming breakout buying.
Key Levels:
Current Support: $75 (WTI), $78 (Brent) – former resistance, now support.
Next Support: $73 (WTI), $76 (Brent) – prior range lows, tested twice in June.
Context: Oil gained 2% this week, driven by Middle East supply fears, with WTI at a 1-month high.
Trading Insight: The $75/$78 breakouts signal bullish momentum. $73-$76 is a key support zone for dips. Watch Iran retaliation news and volume for supply disruption clues.
What’s your 4H oil trade? Post your setups! 👇 #OilPrice #WTI #Brent #IsraelIran #TradingView

Brent Crude Hits Key Supply Zone After BreakoutPrice has aggressively broken out from the descending wedge and reached a strong 4H & 1D resistance zone between 74.50–76.00.
• 1D Chart: Sharp breakout from long-term descending trendline. Approaching resistance from Feb-April supply area.
• 4H Chart: Bullish structure confirmed by higher lows and breakout of ascending channel.
• 1H & 23m Chart: Consolidating beneath resistance, forming a triangle structure.
Key Zones:
• Support: 71.50–72.00
• Resistance: 74.50–76.00
Bias: Neutral short-term (range). Bullish if 76 is broken and held.

Israel Strikes Iran. Oil and Gold Prices SurgeIsrael Strikes Iran. Oil and Gold Prices Surge
According to media reports, Israel launched a large-scale overnight strike on Iranian territory, targeting dozens of military and strategic facilities linked to the country’s nuclear programme and missile capabilities. Israeli officials justified the action by citing an existential threat from Tehran, which, according to their intelligence, is accelerating its development of nuclear weapons and expanding its arsenal of ballistic missiles.
In response, Iran has vowed severe retaliation, stating that the United States and Israel will “pay a heavy price” for the attack. US President Donald Trump has urgently convened a meeting to assess the situation.
Commodities Market Reaction
In the wake of these developments, gold — the primary safe-haven asset — surged sharply. The XAU/USD price broke above its May high, rising past $3,440. However, the all-time high near $3,498 remains intact for now.
Oil prices also spiked due to fears of supply disruption. The military conflict threatens shipping through the Strait of Hormuz, a crucial chokepoint through which one-fifth of the world’s oil supply passes. Traders quickly priced in the risk of war, anticipating a supply shortage driven by large-scale instability in the Middle East.
Technical Analysis of the XBR/USD Chart
Brent crude oil price has risen to the upper boundary of a large-scale descending channel (shown in red), which is defined by lower highs from 2024–2025. As anticipated, this upper boundary acted as resistance, with the price forming a peak above $76 before reversing downward (as illustrated by the black arrow).
From a technical standpoint, following such a sharp rally, Brent is vulnerable to a corrective move. In this scenario, a pullback into the orange zone is possible, where support may be found at:
→ The psychologically important $70 level;
→ The 50% Fibonacci retracement level;
→ The former resistance of the purple descending trendline, now turned support.
Nevertheless, given the scale of the geopolitical threat, it is unlikely that market sentiment will allow Brent to decline significantly in the near term.
This article represents the opinion of the Companies operating under the FXOpen brand only. It is not to be construed as an offer, solicitation, or recommendation with respect to products and services provided by the Companies operating under the FXOpen brand, nor is it to be considered financial advice.

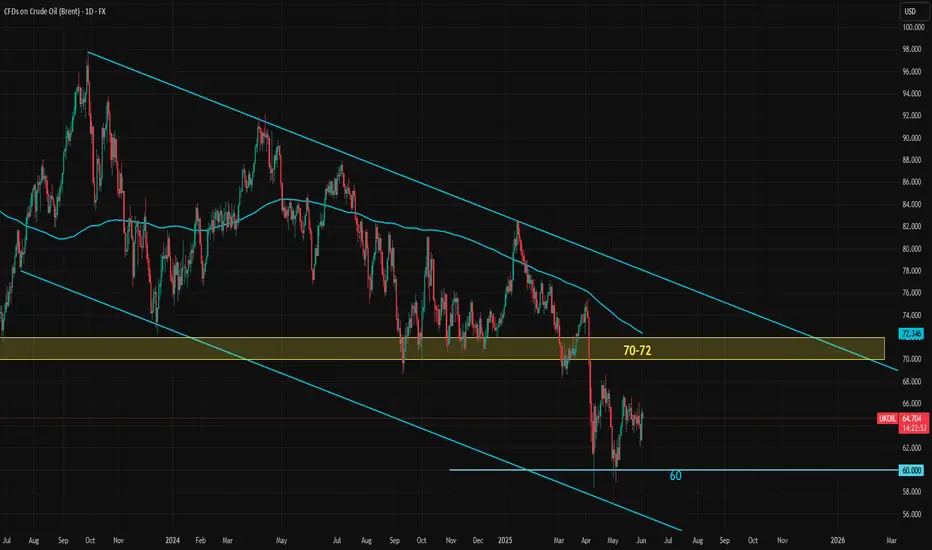
Slowing Global Economy and Output Hikes Weigh on Brent OilBrent crude oil is holding steady around the $60 level, even after OPEC announced another 411,000 barrels per day increase in output, following similar hikes in May, June and smaller one in April. This latest adjustment comes at a time when global economic slowdown concerns are rising, making the decision a risky one. Although the main reason points to non-compliance from Kazakhstan and Iraq, some believe the United States may have played a role, possibly through pressure from Trump aimed at controlling inflation during the ongoing tariff hikes.
With several consecutive production increases now in place, a growing surplus is likely to develop over the second half of 2025. This would maintain downward pressure on oil prices if demand fails to keep pace. At the same time, the broader economic outlook is weakening. Recent manufacturing activity data from China, the United States, the European Union, and the United Kingdom all came in below 50, suggesting a faster rate of contraction. The presence of widespread tariffs is expected to continue weighing on business sentiment and consumer demand, potentially leading to rising unemployment and slowing growth.
In this environment, any short-term spikes in Brent and WTI prices are likely to remain opportunities to sell, unless there is a meaningful shift in underlying fundamentals. For a more detailed view of economic trends, please refer to the latest monthly report.
Brent crude has been in a steady downtrend since March of last year. While the price movement doesn't follow a perfect trend channel, the structure has generally held well. At the moment, Brent is hovering near the middle of this declining channel.
The former long-term support zone around $70 to $72. If prices move up toward this zone, it could present a fresh selling opportunity as long as the resistance holds. On the downside, the $60 level and the area just below it have formed a solid medium-term support, which has held up so far.
Still, oil bulls should be cautious around the $60 mark. Even though support looks strong for now, the overall direction of the trend and the broader fundamental backdrop suggest that this level could eventually break. Any long positions taken near current levels should factor in the potential for renewed downside pressure.
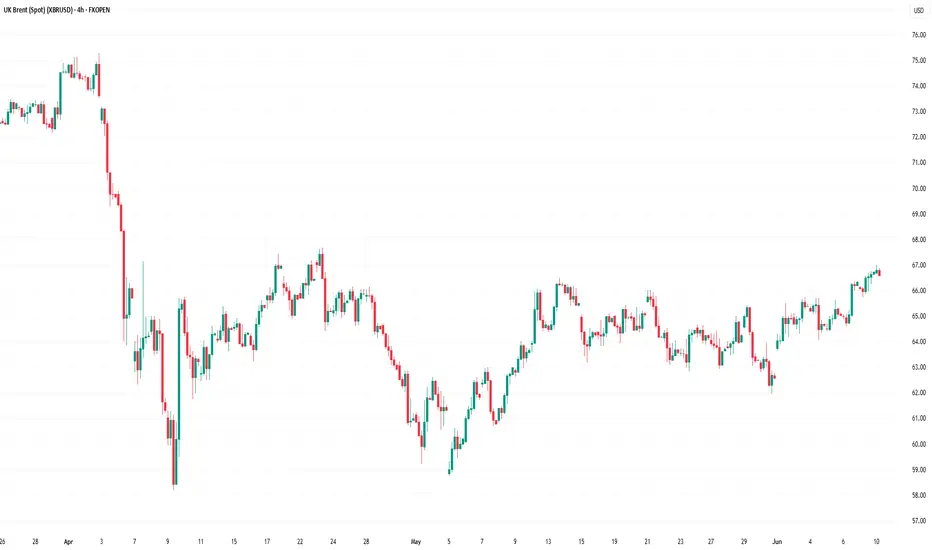
XBR/USD Chart Analysis: Brent Crude Reaches 1.5-Month HighXBR/USD Chart Analysis: Brent Crude Reaches 1.5-Month High
In our analysis of Brent crude oil six days ago, we identified a large contracting triangle and a local ascending channel. We also outlined a potential scenario involving a bullish breakout above the upper boundary of the triangle.
Although this was not the base-case scenario, the XBR/USD chart now suggests it has played out: yesterday, the price climbed to nearly $67 per barrel — its highest level since the end of April.
The main bullish catalyst appears to be ongoing trade talks between the United States and China, which have raised hopes of a resolution to tariff-related tensions between the world’s two largest economies.
At the same time, rising oil prices may exacerbate geopolitical tensions, particularly amid Israeli threats to strike ports in Yemen — a risk that could disrupt supply chains across the Middle East.
Technical Analysis of the XBR/USD Chart
From a technical perspective:
→ Brent crude continues to move within an ascending channel (marked in blue);
→ the upper boundary may now act as a support level.
The fact that the price is holding in the upper half of the channel indicates strong demand-side pressure. Based on this, it is reasonable to assume that as long as Brent remains above the $65.75 level (the retest zone of the breakout), the technical outlook will remain predominantly bullish.
This article represents the opinion of the Companies operating under the FXOpen brand only. It is not to be construed as an offer, solicitation, or recommendation with respect to products and services provided by the Companies operating under the FXOpen brand, nor is it to be considered financial advice.