CRUDE OIL (WTI) PREPARING TO SHORT RALLY!
crude oil is finally approaching a major trendline.
17.8 - 19.8 is our potential reversal zone and chances will be high that the zone will be respected and the price will drop again.
my trigger to short is a rising wedge pattern. I want to see its bearish breakout in order to sell.
initial target will be 14.5 level.
Brent-wti

WTI Continues Lower in Asia as Selling Pressure IncreasesHeadlines:
- WTI Continues Lower in Asia Plus USO Begins to Sell Its June Contracts
- Japan Posts Lower than Expected CPI Data Whilst Unemployment Numbers Increase
- US Futures Lower Whilst Markets in Asia Post Slightly Mixed Session

Oil Falls as Prices Rattled by Ongoing Storage IssuesHeadlines:
• Oil Falls Below $13 as Prices Continue to Be Rattled by Ongoing Storage & Production Issues
• Low Oil Prices Claim Another Victim as Diamond Offshore Files for Chapter 11 Bankruptcy
• US Energy Sector Pushes Higher Despite Falling Crude Prices Up 2.10%

Crude Falls in Asian Session Despite Early Production Cut PostedHeadlines:
• Crude Falls Monday Asian Session Down -11% Despite Early Production Cuts
• Equities Across Asia Push Higher with Bank of Japan Announcing Further Stimulus
• COT Reports Shows Increase in Light Crude Long Managed Money Positions for Week Past

2008 Fundamentally Changed Everything.Where to begin? I guess we can start with what this chart is showing. This chart shows that since 2008, oil has been in a deflationary spiral. Just look, since 1984, crude markets were in a healthy stable sideways movement. The ones who were buying and selling oil, were the ones who were in the field.
Today? You have a bunch of no good investment firms who got their fingers in Wall Street gambling with futures contracts. These firms and investors have NO intention on receiving the oil or care anything about oil. It's all about sneaky, immoral gambles to gain money. Does this ring a bell, in 2008 with CDOs and real estate gambling?
It seems that people didn't learn from 2008. It seems when there is a cross, staked in the ground saying RIP US Dollar 1930-2020, will they realize their greed has hurt everyone. Like the Good Book says "for the love of money is the root of all sorts of evil". I would love proof of the contrary. Rich people are never satisfied and always find illegal, immoral ways to gain more of it. Not convinced? Watch a few episodes of American Greed.
Anyhow, back to the topic. What caused oil to collapse to $-40.00 a barrel? Simple. It was the collapse in demand, on a global scale. The largest oil consumers all saw a drop of at LEAST 50% in demand just in the first two weeks of March. Imagine where its at now, in April. Demand won't come back, not for at least another 2-months. Even if states open up, the people won't open with it. Fear has set in, and people's fear drives them. Remember, fear is the greatest emotion.
I see oil remaining below $30.00 for at least a few months. They have already cut production, it failed to increase the price. The only thing left at this point that guaranteed will boost prices is unfortunately, war. I believe we will see some sort of conflict soon, obviously in the Middle East. This will send gold, silver, and oil prices through the roof. Stock markets, bitcoin, will collapse as they have been doing together for the last 2 months. It's official, we're in a deflationary spiral.. and what I fear the Fed will do is put the economy into a hyper inflation. They've already used bazooka money, helicopter money, they are considering buying junk bonds, MGS.. this is total insanity.
I end this by a quote "When all else fails, they take you to war" Gerald Celente.
Get TWO free stocks , free trading, next level indicators and charts.. all free.
act.webull.com

Oil Whipsaws as Storage and Demand Issues Take Centre StageHeadlines
- API Data Shows Crude Increase of 13.226 Million Barrels for the Week
- Oil Whipsaws as Storage and Demand Issues Take Centre Stage
- US Equities Fall Whilst Futures in Asia Set to Open Lower

BRENT CRUDE OIL BCOUSD BEARISH FLAGBrent crude oil BCOUSD going down as the flag pattern has been completed

Strong SELL SHELLThis could be a Shoulder-Head-Shoulder formation, which means 11-12$ could be coming again soon. Oilprices have a difficult time too and put a lot of pressure on the oil industry.

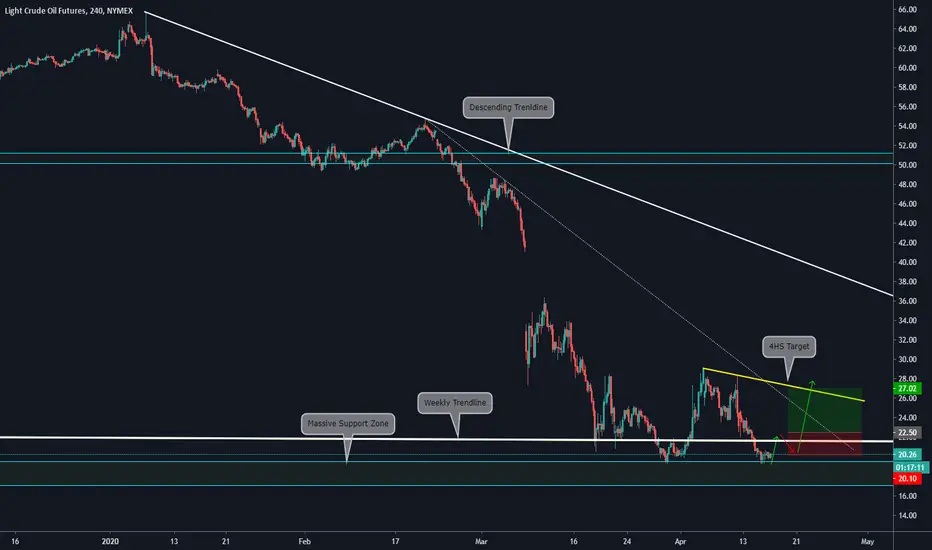
Weekly and 4HS analysis + Trade idea on Crude Oil ThinkingAntsOkUse this as a guide to develop your view of the chart:
FIRST, let's start with the Weekly Chart:
a)The price is on the lower trendline of a massive corrective Structure + Support zone
b)We expect a Bullish movement on the long term towards the next Dynamic Resistance zone
c)ABCDE Patter is finished. We should deduce a bullish movement
SECOND, let's go to the 4hs chart:
a) The price is on the massive Support zone of the Weekly chart on its 3rd attempt to break it.
b) If the price failed. We should expect a bullish movement towards the secondary trendline of the bearish movement (4HS Target)
c) We will wait for an impulse and a small correction
d) We will set our orders above the structure and our stop below it.
e) Our Expected Risk Reward Ratio will be 1.8 more or less.
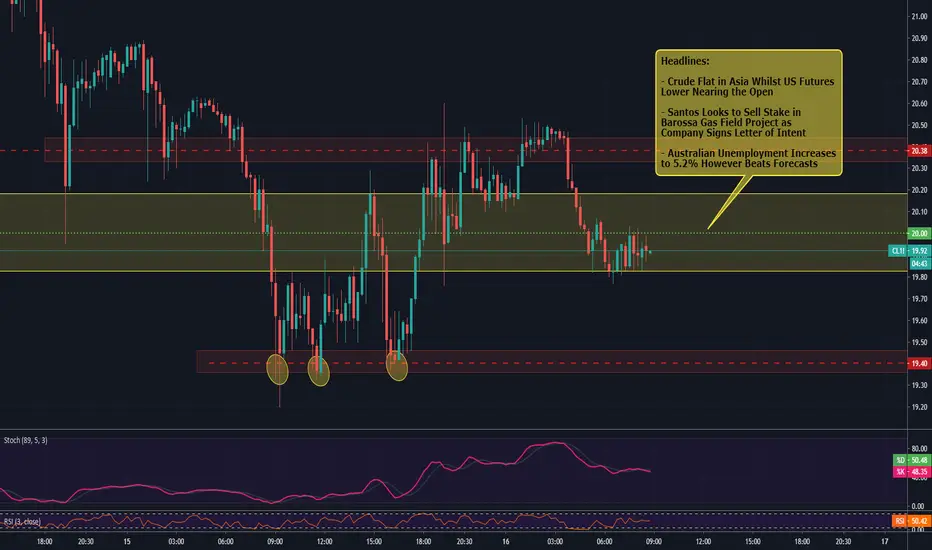
Crude Flat in Asia After Yesterdays EIA Inventories ReleaseHeadlines:
- Crude Flat in Asia Whilst US Futures Lower Nearing the Open
- Santos Looks to Sell Stake in Barossa Gas Field Project as Company Signs Letter of Intent
- Australian Unemployment Increases to 5.2% However Beats Forecasts
Crude Falls as IEA Report Along with EIA Build Weighs on PricingHeadlines
• EIA Inventories Release Shows Crude Build of 19.248 Million Barrels
• IEA Reports Oil Demand in 2020 to Plummet as Lack of Demand Rocks Markets
• Crude Plummets Below $20 Handle as IEA Shows Expected Demand to Fall


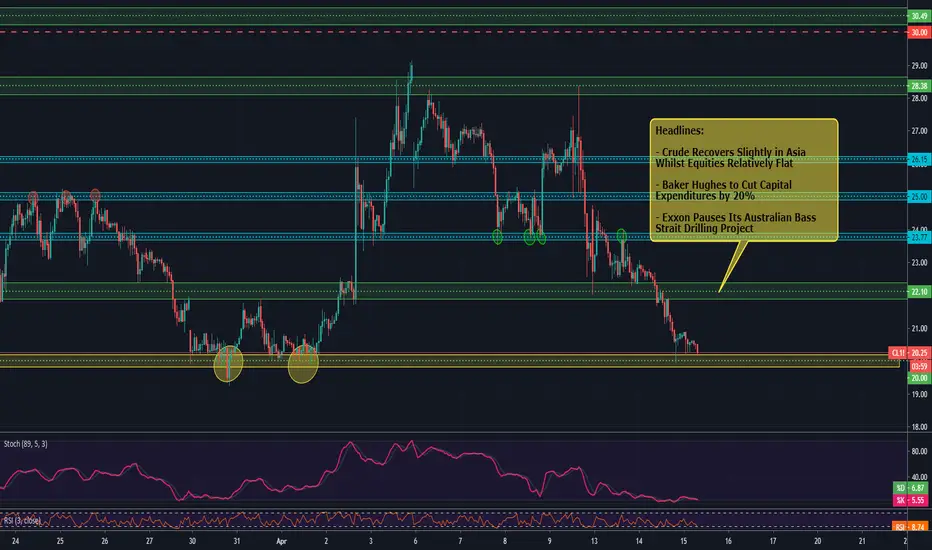
Crude Recovers Slightly Within Asia After Seeing Prices TumbleHeadlines:
- Crude Recovers Slightly in Asia Whilst Equities Relatively Flat
- Baker Hughes to Cut Capital Expenditures by 20%
- Exxon Pauses Its Australian Bass Strait Drilling Project
API Shows Gasoline Inventory Increase of 2.226 Million BarrelsAPI Release this week has shown a gain up for the week with Gasoline posting a build of 2.226 million barrels

API Shows Crude Inventory Increase of 13.143 Million BarrelsHeadlines:
- API Shows Crude Inventory Increase of 13.143 Million Barrels
- Crude Falls to $20 Handle as API Coupled with Falling Demand Increases Pressure on Pricing
- TOTAL Postpones Development of Offshore Preowei Project Nigeria

COT Report Shows Increase in Crude Long Managed Money PositionsHeadlines
• COT Report Shows Increase in Light Crude Long Managed Money Positions
• US & UK Futures Up as Markets Conclude Long Weekend Break Period
• OMV Releases Positive Result for its Exploration Well in the Taranaki Basin

Crude Drops on Monday as Sentiment Surrounding Cuts Diminishes- Crude Futures Fall as Sentiment Surrounding Cuts Diminishes as Supply Glut Remains
- Shell Halts Some Production Within its Gulf of Mexico Project Due to Exxon Pipeline Leak
- Shell Pulls Its Interest from Russian Arctic Project

CRUDE OIL (WTI) Potential Harmonic Trade
hey guys,
potential harmonic bat pattern is forming on WTI.
what I like about this pattern is that its D point is lying perfectly on the current structure low = strong support.
our buy zone is between 19.2 - 20.3
from this area, we will expect a pullback to at least 23.0 / 25.3 levels
safest stop: 18.15
p.s harmonic bat formations have a 55% accuracy.
risk no more than 1% for these trades.

Natural Gas Storage Numbers Show Larger Than Expected BuildThis week’s numbers have shown a build of 38 billion cubic feet for the week which does constitute for a build of 1.91% in total storage within the United States.

EIA Post Higher Than Expected Crude Build of 15.177m BarrelsHeadlines
• EIA Inventories Post Higher Than Expected Crude Build of 15.177 Million Barrels
• Oil Surges Above $26 Handle as Optimism of Global Production Cuts Increases
• US Equities Gain as Energy Sector Leads Indexes Higher

Crude Retraces to $25 Level in Asia Before Tumble at London OpenHeadlines
• Crude Retraces Some Losses in Asia Finishing Higher
• US Energy Giant Exxon to Cut Capital Spending by 30% Heading into 2020
• S&P Lowers Australia’s Sovereign Rating to Negative as They Expect Country to Enter Recession

Brent Oil Futures (BR1!) Short Signal
brent is on the key 4H structure.
due to a long term bearish trend and breakout of a minor support on 1H,
I have shorted the retest as the market opened!
my targets
30.2
27.5
stop
34.7
this is the example of the execution of h&s trade,
apply the same rules on gbpusd in previously mentioned setup

Crude Down in US -7% as Debate About US Production Cuts IncreaseHeadlines
• Crude Falls in US Session Down -7% as Debate About US Production Cuts Increase
• US Equities Surge as Virus Toll Begins to Subside Seeing S&P500 Up 7.03%
• Norwegian Energy Giant Equinor Announces Discovery in Monument in the Gulf of Mexico
