Best trade of the week? USDCAD or Oil? Will bearish bets on the Canadian dollar grow in the lead up to Wednesday? It is widely expected that the Canadian central bank will leave interest rates on hold during its meeting that concludes on this day (Although, it may be a hawkish hold as the Governor Tiff Macklem will mention that another hike is still on the table for the bank).
Perhaps piling on the bearish sentiment is the slight fall in the price of oil (one of Canada's major exports), as US diplomatic efforts continue to contain the conflict between Israel and Hamas. How long this quietish period can last is up for debate though, and a ground offensive by the IDF in Gaza could send oil prices higher.
Bullish takes on the USD/CAD (i.e., bearish bets on the Loonie) will have 1.37350 to content with, which is the high the pair reached before cratering to 1.36712 to start the week. 1.36936 is the more immediate resistance for bull to cross before even thinking about the day's high. The RSI’s weakness suggests this won’t be too difficult though, and 1.37189 might be the more formidable resistance.
Brent

Oil PutsLooks like black gold is headed south after completing bearish pennant. First demand zone isnt likely to hold the price and will probably drop it to the next demand zone.
Let me know what you think.

CRUDE OIL (WTI): Bullish Outlook Explained 🛢️
Price action analysis for WTI Oil.
Structure analysis.
Important bullish confirmation explained.
❤️Please, support my work with like, thank you!❤️

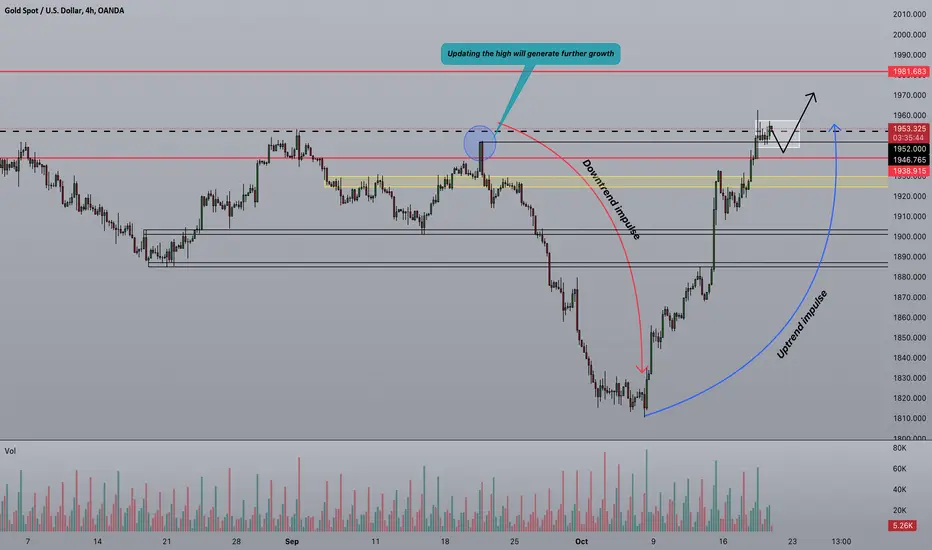
Strifor || XAUUSD-10/20/2023Preferred direction: Neutral
Comment: The growth goal we set yesterday was achieved. At the moment, gold continues to attract market participants to purchases. However, you should be more careful, now a major player can let them fix their purchases and the metal will face a correction.
Thank you for like and share your views!

Strifor || UKOIL-10/20/2023Preferred direction: SELL
Comment: Yesterday, oil still showed growth and we were forced to exit with a stop loss. However, the priority of sales remains and today once again we are considering sales from current prices with a target of 90.72 and even with fixation below.
Thank you for like and share your views!

Top 10 books in tradingAs a trader now of over 23 years, I have read a few hundred trading books in that time. It is always really interesting to have other people's perspective, strategies, hint, tips and tools.
However, the main issue is not knowing if you are likely to get value from the book you purchase as it is also very subjective. You either have issues such as the book is too basic, or the other end of the scale, it's too advanced.
During the 20 plus years, I found a number of great books that helped me - but also ones I have shared with others over the years. Regardless of your level of knowledge how do you know what works or would work for you or your style of trading?
I put this list together in no real order, but I'll try to summarise each with a little about what I liked or what you can take away.
==============================================================
"The Wall Street Jungle"
Written by Richard Ney, first published in 1970. In this book, Ney provides readers with an insider's perspective on the world of finance and investment. He delves into the complexities and pitfalls of Wall Street, offering a critical examination of the stock market and the investment industry.
Ney, a former Wall Street insider himself, reveals the often deceptive practices and psychological games played by brokers and financial institutions. He discusses the dangers of following investment advice blindly and emphasizes the importance of informed decision-making when it comes to managing one's finances.
Throughout the book, Ney uses real-life examples and anecdotes to illustrate the challenges and temptations that investors face. He also explores the psychological aspects of investing, discussing how emotions can influence financial decisions and lead to costly mistakes.
What I like about this is the emphasis put on the market makers, as a trader who uses Wyckoff Techniques, it made more sense when identifying with Composite Man theory.
"Trading in the Zone"
By Mark Douglas that focuses on the psychology of trading and investing. Published in 2000, the book offers valuable insights into the mental aspects of successful trading. Douglas emphasizes the idea that trading is not just about mastering technical analysis or market fundamentals but also about mastering one's own emotions and mindset.
This book was one of the best in terms of psychology, every trader has a different appetite for risk and even profits, this is a huge factor in trading especially early on. If you struggle with psychology of trading or the emotions, I would 100% recommend this one.
"The Wealth of Nations"
Written by the Scottish economist and philosopher Adam Smith, first published in 1776. This influential work is considered one of the foundational texts in the field of economics and is often regarded as the birth of modern economics.
In the book Smith explores the principles of a free-market capitalist system and the mechanisms that drive economic prosperity. He famously introduces the concept of the "invisible hand," which suggests that individuals pursuing their self-interest in a competitive market inadvertently contribute to the greater good of society.
For me, the rules of economics have not changed much since the creation of this book. appreciating moves such as DXY up = Gold down, is simple economics. The main take away is again around Wyckoff theory for me and the fact the "invisible hand" is exactly why and how some fail and some profit.
"The Go-Giver"
Although not technically a trading book, it's one of the best little business/life stories.
self-help book co-authored by Bob Burg and John David Mann. Published in 2007, it presents a unique and compelling philosophy on success and achieving one's goals.
The book revolves around the story of a young, ambitious professional named Joe who is seeking success in his career. Through a series of encounters with a mentor named Pindar, Joe learns the "Five Laws of Stratospheric Success." These laws, which are principles of giving, value, influence, authenticity, and receptivity, guide him on a transformative journey toward becoming a true "go-giver."
The way I saw this from a trading perspective is pretty much, the value given by stocks or companies is something Warren Buffet and Benjamin Graham investment theory was all about. Although a different type of value - you can understand why instruments such as gold or oil have a place, a value and this can be deemed as expensive or fair at any given point. These waves are what really moves the market.
"The Zurich Axioms"
A book written by Max Gunther, originally published in 1985. This book offers a set of investment and risk management principles derived from the wisdom and practices of Swiss bankers in Zurich. The Zurich Axioms provide a unique and unconventional approach to investing and wealth management.
The book presents a series of investment "axioms," or guidelines, that challenge conventional wisdom in the world of finance. These axioms emphasize risk management, flexibility, and the willingness to take calculated risks. They encourage investors to think independently and avoid the herd mentality often associated with financial markets.
For me it's more about investing and less about trading. But the deep down message is all to do with ultimately wealth preservation, I have been in the wealth management and investment space and found it interesting that the more an investor has, the less about making money it becomes and more about safe guarding that capital it gets.
"Mastering the Market Cycle: Getting the Odds on Your Side"
Written by Howard Marks, a renowned investor and co-founder of Oaktree Capital Management. Published in 2018, the book delves into the critical concept of market cycles and provides insights on how investors can navigate them to enhance their investment strategies.
In the book, Marks emphasizes the cyclical nature of financial markets and discusses the inevitability of market fluctuations. He explores the factors and indicators that drive market cycles, such as economic data, investor sentiment, and market psychology. Marks' central thesis is that investors can improve their chances of success by understanding where they are in the market cycle and adjusting their investment decisions accordingly.
I had a spooky delve into market cycles, I have a good friend who told me he did not trade price, instead time. This was something I could not really figure out, but was so fascinating that the markets can work in cycles. It was interesting that Larry Williams also discussed a similar thing with the Orange Juice market's in one of his books.
"How I Made One Million Dollars Last Year Trading Commodities"
And here is Larry Williams' book. provides an insider's perspective on his successful journey as a commodities trader. In this book, Williams shares his personal experiences, strategies, and insights into the world of commodity trading. He outlines the specific techniques and tactics he used to achieve remarkable profits in a single year. While the book may not offer a guaranteed formula for success, it offers valuable lessons on risk management, market analysis, and the psychology of trading. It serves as both an inspiration for aspiring traders and a guide for those looking to improve their trading skills in the volatile world of commodities.
For me, the COT intel is invaluable. When you learn what drives markets really, COT is such a useful tool to have at your disposal.
"Nature's Law: The Secret of the Universe"
A groundbreaking book by Ralph Nelson Elliott, the creator of the Elliott Wave Theory. Published in the early 20th century, this influential work introduced a novel perspective on market analysis and price prediction. Elliott's theory posits that financial markets and other natural phenomena follow a repetitive, fractal pattern that can be analyzed through wave patterns. He outlines the concept of impulsive and corrective waves and demonstrates how these waves form trends in various financial markets.
The book delves into the idea that the market's movements are not entirely random but instead exhibit an underlying order, governed by these wave patterns. Elliott's ideas have had a profound impact on technical analysis and have been adopted by traders and analysts worldwide. "Nature's Law" serves as the foundation of the Elliott Wave Theory, offering valuable insights for anyone interested in understanding and predicting financial markets based on natural patterns and mathematical principles.
If you want to learn about Elliott Waves - here it is from the horse's mouth as they say.
"Master the art of Trading"
By Lewis Daniels - Master the Art of Trading trader, offers a quick, easy, and comprehensive roadmap to trading. It explores the grand theories and behavioural economics underpinning the markets, from Elliot Wave Theory to Composite Man. It unpicks visual data, such as candlestick graphs and trend lines. It equips readers with the correct tools to make sense of the data and to make better trades. And it helps readers uncover their innate strengths, realise their propensity for risk, and discover what sort of trader they are - on order to optimise their behaviour to make them as effective as possible.
This book puts together all of the core trading requirements from the basic trendline through to psychology and technical techniques.
"The Intelligent Investor"
a classic and highly influential book on the subject of value investing, written by Benjamin Graham and first published in 1949. Graham, a renowned economist and investor, is often considered the "father of value investing."
The book offers a comprehensive guide to the principles and strategies of sound, long-term investing. Graham's central concept is the distinction between two types of investors: the defensive, "intelligent" investor and the speculative investor. He emphasizes the importance of conducting in-depth analysis and due diligence to make informed investment decisions, rather than engaging in market speculation.
I don't think any list of trading books is complete without this one! It's the Warren Buffer Holy Grail. For me, it's about risk management, finding value - especially with investments like value stocks. Using compounding interest and the factor of time to your advantage.
=====================================================================
I would be keen to get comments and other book recommendations from the trading community here on Tradingview.

Strifor || XAUUSD-10/19/2023Preferred direction: BUY
Comment: As for gold, everything remains valid. Priority shopping continues. There is a possibility that the metal will go flat against the background of the expected strengthening of the US dollar, after which it will continue to update local highs.
Thank you for like and share your views!
Strifor || UKOIL-10/19/2023Preferred direction: SELL
Comment: After the rally in oil, prices are most likely ready for a correction. The downward correction is expected to continue. Positions are considered from current prices with a view to approaching level 88. Presumably, after which there will be a pause and a likely continuation of the fall.
Thank you for like and share your views!

Strifor || GBPUSD-10/18/2023Preferred direction: SELL
Comment: The British pound continues to be below the level of 1.22370, which indicates a bearish mood. For the pound, sales look more attractive than for other currency pairs, except that the currencies of the Pacific region can boast of greater downside potential. In the second half of the week, most likely you need to actively look for entry points into shorts. A fall to the local support area at the level of 1.02500 is expected. There is a small probability that the price will move to the level of 1.22370, after which the currency pair will most likely rise in the direction we have outlined.
Thank you for like and share your views!

CRUDE OIL (WTI): Your Trading Plan Explained 🛢️
Price action analysis for WTI Crude Oil.
Important key levels.
Potential swing long trade explained.
Trading recommendations & plan.
❤️Please, support this video with like and comment!❤️

TradePlus-Fx|BRENT: now on sell💬 Description: Oil remains one of the most interesting instruments at the moment, which is due to the aggravated geopolitical background. Metals are the same story.
In our previous trading idea for oil, we assumed entering a long position with the goal of reaching level 91 . This happened, but the main idea and the more promising one - sell. At the moment, a good context has been formed to enter the short, as we need. One can consider a dynamic set of positions, since a false breakout upward cannot be ruled out, after which the price will fall even more rapidly. The target of the trade is located at the gap formation level, that is, at level 85 .
🔔 FX CALENDAR TODAY 🔔
🇪🇺Trade Balance
🇺🇸NY Empire State Manufacturing Index
🇺🇸Federal Budget Balance
➖➖➖➖➖➖➖
🚀Thank for your BOOSTS 🚀
👇Share your views and FOLLOW US 👇

TradePlus-Fx|GBPUSD: power of dollar💬 Description: The dollar began to gain strength again amid yesterday's US inflation data. Currency pairs reacted the most, and metals only began to catch up a little later. Metals are most likely still supported by demand against the backdrop of geopolitical tensions, where, by the way, the dollar also has weight, since US bonds are bought for dollars.
We recently looked at a potential reversal at the 1.22716 level. This area is indicated on the graph. This is exactly what is happening now. Sales priority will be canceled only if the price closes again above the specified level. In the very near future, the level 1.21166 will most likely be reached, after which as soon as the price falls below this level, we can expect a rapid fall to 1.18730.
🔔 FX CALENDAR TODAY 🔔
🇨🇭PPI
🇬🇧BoE Gov Bailey Speaks
🇪🇺ECB President Lagarde Speaks
🇺🇸Michigan Consumer Sentiment
🇺🇸Michigan Consumer Expectations
🛢US Baker Hughes Total Rig Count
🌎IMF Meetings
➖➖➖➖➖➖➖
🚀Thank for your BOOSTS 🚀
👇Share your views and FOLLOW US 👇

TradePlus-Fx|GOLD: still shot💬 Description: And shorts of gold are still being considered. The approach to 1885 creates a promising short trade. However, today we expect inflation data, which may make some adjustments. In this case, one should not be afraid to re-enter, or one can consider entering using pending sell orders, placing them below and above the market price before the release of US CPI . The potential of the deal is good, and we expect a fall towards the level of 1830 and below.
🔔 FX CALENDAR TODAY 🔔
🛢IEA Monthly Report
🇪🇺ECB Publishes Account of Monetary Policy Meeting
🛢OPEC Monthly Report
🇺🇸Initial Jobless Claims
🇺🇸CPI
🛢Crude Oil Inventories
🇺🇸WASDE Report
🌎IMF Meetings
➖➖➖➖➖➖➖
🚀Thank for your BOOSTS 🚀
👇Share your views and FOLLOW US 👇

TradePlus-Fx|EURUSD: follow plan💬 Description: Addition to an extreme trading idea for the Euro . In general, we continue to follow the plan that was outlined for us. The first part, aimed at long, worked out positively. Now, after reaching the area 1.06167 - 1.06350 , you can begin to consider short transactions. The best thing to do is to look at the dynamic set of positions, that is, to gain a short position with several orders. There is a small chance that the price may update the current high, especially based on data from the US today. The target for the fall is the same and remains at the daily level of 1.05194 . In addition, a potential movement below the specified target was indicated on the chart. This option is also being considered, and after fixing part of the profit, you can allow the profit to continue flowing.
🔔 FX CALENDAR TODAY 🔔
🇺🇸PPI
🛢EIA Short-Term Energy Outlook
🇺🇸FOMC Meeting Minutes
🛢API Weekly Crude Oil Stock
🌎IMF Meetings
➖➖➖➖➖➖➖
🚀Thank for your BOOSTS 🚀
👇Share your views and FOLLOW US 👇

A Traders' Weekly Playbook - energy markets to direct sentimentWe look at the scheduled economic data and US earnings this week and question if given the fluid news flow from the Middle East, these events move the dial or if geopolitics consumes the full attention and direct sentiment.
We saw a rush to hedge portfolios on Friday ahead of a darkening picture emerging in the Middle East. The situation is dynamic and it's too early to say if the hedges placed on Friday are unwarranted, but there have been pockets of positive news flow – for example, US Secretary of State Blinken saying aid will get to Gaza via the Egyptian border, and Israel opening water supply to Southern Gaza, with over 600k Gazans moving south.
A call between US National Security Advisor Jake Sullivan and Iranian officials is a development, with the US warning not to increase aggression. As Israel's ground offensive pushes into Gaza, risk and energy markets will look for headlines and actions from Iranian officials who have stated they have a duty to come to the aid of the Palestinians.
Watching crude and Nat Gas
The energy markets are the first derivative to drive broad market sentiment this week, with crude and Nat Gas leading investors to trade volatility (options), as well as classic hedges such as gold and Treasuries. Amid a backdrop of ‘higher for longer’, and the US CPI inflation gaining 0.4% in September, higher energy prices could deliver a one-way punch to sentiment.
Given market participants are generally poor at pricing risk around geopolitical developments, it's no wonder most have looked to mitigate drawdown - but at this stage, while there is a growing wall of worry to potentially climb, the probability is traders will use strength in risky assets to reduce exposures.
The probability of supply disruptions is one of the key aspects here – last week we saw the closure of Chevron’s Tamar gas field in Israel – the focus has been rerouting that gas from the Leviathan gas fields in the North of Israel – if the market feels this gas field could be impacted then could see a spike in EU NG. Many energy experts see the risk of a supply event here as fairly low, but should developments escalate on various fronts, then the market will increase the possibility of a disruption.
The bear case for risk, given the potential for a significant rally in EU NG and crude, would be where the market increases the probability of Iran curtailing the movement of LNG through the Straits of Hormuz, where notably Qatar LNG supply (20% of the global LNG market) would be impacted. Again, this seems a low probability at this stage, but that will depend on Iran’s ongoing involvement and any new sanctions placed on them.
Downside risk to the EUR
If EU NG spikes higher in the near term, then talk of a renewed energy crisis in Europe will resurface and the EURUSD could be headed to parity. As said, this probability is a lower risk right now, but when considering the risks, this is the market concern that will be monitored.
While sentiment will move around on each headline, we revisit the hedging flows seen on Friday, as traders de-risked ahead of potential gapping risk – It’s too hard to make a call on whether these hedges are partly unwound in Asia.
Where did we see the hedging flows?
• Gold rallied 3.4% on Friday - a 3-sigma move and the second biggest day since 2020. A massive 299k gold futures contracts traded, the highest since May. XAUUSD 1-month implied volatility has pushed to 15% and 1-week call volatility has increased to a 1.75 vol premium to puts – the most since March.
• The XAUUSD price closed at a 2.8% premium to the 5-day moving average, which shows the sheer pace of the intraday rally, with limited intraday mean reversion – sellers just stood aside.
• Brent crude closed 5% higher with our Brent price closing over $91 and eyeing a move back to the recent highs of $96 – WTI Crude futures saw the curve lift and go further into backwardation – this typically means the market sees a higher probability of a supply shock.
• In equities, the VIX traded to a high of 20.78%, settling at 19.3% (+2.6 vols on the day) – a VIX index at 19.3% implies daily % changes in the S&P500 of 1.2% and 2.7% on the week.
• S&P 1-month put implied vol now trades at a 5.46 vol premium to 1-month calls – This volatility ‘Skew’ is now the most bearish since May – traders are ramping up the demand for downside puts to protect in case of drawdown.
• Market breadth was ok with 46% of S&P500 stocks closed higher – there was no blanket selling, but a rotation from tech and consumer names into energy and defensive sectors - staples, utilities, and healthcare.
• While we saw some buying in petrocurrencies (NOK & CAD) but traders played defense buying into the CHF & JPY – short NZDCHF was the play of the day (-1.4%), with GBPCHF breaking the long-run range lows.
• US Treasuries rallied with 10’s closing -8bp and 30’s -10bp.
Marquee event risks for the week ahead:
• NZ Q3 CPI (17 Oct 08:45 AEDT) – the market consensus is for 1.9% QoQ / 5.9% YoY (from 6%) – NZDCHF was the biggest percentage mover on Friday following the risk aversion flows – will the sellers follow through?
• UK jobless claims/wage data (17 Oct 17:00 AEDT) – the consensus for wages sits at 7.8% (unchanged) – UK swaps place a 29% chance of a hike from the BoE at the 2 Nov BoE meeting, will the wage data influence that pricing? GBPCHF trades the weakest levels since Oct 2022 and looks likely to be sold on rallies
• US retail sales (17 Oct 23:30 AEDT) – the advanced read is expected at 0.3% mom and the ‘control group’ element at -0.1%. The retail numbers could influence market sentiment, especially if we see a big miss to expectations, with USDJPY and USDCHF the pairs most sensitive to a weaker outcome. Gold could find further buyers on a downside surprise.
• Canada CPI (23:30 AEDT) – headline CPI is expected at 4% yoy, with core CPI eyed at 4% yoy
• Fed chair Jay Powell speaks at the Economic Club of NY (20 Oct 03:00 AEDT) – the highlight of the week. Expect Powell to focus on the view that moves in the bond market are mitigating the need for the Fed to hike further.
• China Q3 GDP (18 Oct 13:00 AEDT) – consensus is 4.5% yoy (from 6.3%) – likely a trough in China’s GDP, with better levels ahead.
• China Industrial production, fixed asset investment, retail sales (18 Oct 13:00 AEDT)
• UK Sept CPI (18 Oct 17:00 AEDT) – the consensus for headline CPI is 6.6% yoy (from 6.7%) / core CPI at 6% yoy (6.2%) – a risk to manage for traders holding GBP exposures
• EU CPI (18 Oct 20:00 AEDT) – no change expected in the revision, with headline CPI eyed at 4.3% /core CPI at 4.5%. Should be a non-event for the EUR and EU equities.
• Australia employment report (19 Oct 11:30 AEDT) – the consensus estimate is for 20k jobs to have been created in September and the U/E rate unchanged at 3.7% - expect the impact from Aussie jobs to be short-lived – preference to work sell limits in AUDUSD on the day and sell into strength.
• China new homes prices (19 Oct 12:30 AEDT)
• China 1 & 5-year Prime Rate (20 Oct 12:15 AEDT) – the consensus is no change with the 1yr rate to stay at 5.2% & the 5yr rate at 3.45%
US Earnings (with the implied move on earnings) – Goldman Sachs (3.7%), Bank of America (4.6%), Tesla (5.2%), Netflix (7.5%)
Central bank speeches:
BoE – Huw Pill, Sam Woods, Swati Dhingra
ECB – Villeroy, Knot, Centeno, Guindos, Holzmann
Fed – see schedule below

CRUDE OIL (WTI) Your Trading Plan For Next Week 🛢️
What a pump on WTI Crude Oil.
Following the geopolitical tensions, the market bounced nicely on Friday.
Ahead I see a strong daily resistance: 88.4 - 88.6 area is the last resort
for the sellers. If the price breaks and closes above that on a daily next week,
it will be a strong bullish signal for you.
You can anticipate a bullish continuation all the way up to 93.45 level then.
Just remember, that first you need a breakout confirmation.
❤️Please, support my work with like, thank you!❤️

Strifor || XAUUSD-10/13/2023Preferred direction: SELL
Comment: Level 1885 proved to be in favour of the seller, as we noted in the previous trading idea. Today and the near future remain the same. Let's look at the shorts. A potential double top is now forming. A false breakout of the 1885 level cannot be ruled out, after which, as expected, the price will resume falling again.
Thank you for like and share your views!

Strifor || USDCAD-10/13/2023Preferred direction: BUY
Comment: The US dollar strengthened against the general background and against the Canadian. Now the price is at the level of 1.36545, which most likely foreshadows further strengthening of the buyer. It is excellent to take a long position from this level; one can comfortably place a stop under the level and, in case of a stop loss, try to calmly re-enter. The target of growth is updating local max.
Thank you for like and share your views!

USOIL Technical Analysis and Trade Idea (applies to WTI Brent)This video provides an in-depth analysis of USOIL (WTI Brent also applicable). On the weekly chart, we observe a bullish trend that has undergone a significant correction to key support levels. The weekly chart indicates that the overall bias is still bullish, but the daily chart shows a bearish market structure break. A bearish trend has not fully established yet, as the price action is forming a triangle pattern on the daily chart evidenced by lower highs and higher lows. A further downward movement that breaks the current support level would signal a possible bearish continuation scenario. This video is for educational purposes only and does not constitute financial advice.

Oil Brent - H4Oil Brent
*Updating the idea and how to act*
Long - ABC correction structure has come to an end - You can observe an impulse rebound after the fall, which can lead to further growth and the 5th wave on W1
The nearest target is at 95.90
This scenario is best used to exit the triangular formation on H4 when the level of 87.85 is broken - with the cancellation of this movement and without increasing risks if the breakout turns out to be false at the level of 85.09
Short - If the price does not continue to move upward, and this was a full-fledged reversal, in the continuation of the 5th wave on D1, the nearest targets will be at the level of 74.30
In this scenario, you can consider selling from the level of 85.09 - with the cancellation of this movement and without increasing risks if the breakout turns out to be false at the level of 87.85.
What to expect now?
Waiting for the breakout of the level for Long - 87.85, local target 95.90 - 98.10
When opening a position, it is best to exit the position from the level of 85.09, if this scenario does not materialize.
Waiting for the breakout of the level for Short - 85.09, local target 77.77 - 74.30
When opening a position, it is best to exit the position from the level of 87.85, if this scenario does not materialize.
Long
Targets 90.17 - 92.49 - 94.63 - 98.10
Short
Targets 82.28 - 79.30 - 77.77 - 74.30

TradePlus-Fx|BRENT: closing the gap💬 Description: Oil quotes have been holding by buyers at current levels after the gap. The reason for the formation of the gap was the aggravated geopolitical situation in the Middle East. It should be noted that buyers even "overplaying", but there is no result, no growth is observed. In addition, it was no coincidence that the price hovered at the local level of 87.45, which is a medium-term area of liquidity accumulation. Based on the traditional our metrics, most likely in the near future we should expect a fall in order to cover the gap, as well as update local minimums.
➖➖➖➖➖➖➖
🚀Thank for your BOOSTS 🚀
👇Share your views and FOLLOW US 👇

OIL WILL GO TO THE MOON FIRST !THE INTELLIGENCE SERVICE GAME
It is IMPOSSIBLE that the intelligence services (CIA, NSA, MOSSAD, SVR, MSS, ISI, RAW, MI6...) that have invested billions and billions in monitoring "every click," every "audio" message left on an encrypted messaging platform (i.e. Pegasus), COULD NOT have been aware that HAMAS was arming itself in preparation for an operation and suddenly became ineffective!
So if all the services were aware of the "scam," how did the opposing party anticipate managing this potential stumbling block?
SET MOOD AND ESTABLISH THE SCENE BEFORE THE ARMS RACE BEGINS THEN COMODITIES WILL FOLLOW
The internal security of a state depends on the quality of services provided by its protecting intelligence agencies
The failure of Western services in prediction, but above all, the conviction that the Russians were 30 years behind, becomes glaringly evident. Otherwise a part of them knew it (CIA, MI6) and chose to misinform EVERYONE to sow chaos with the aim of boosting markets and generating demand.
I always claimed this difference between USA and Russia in the fact that one are Poker players, and the others are chess players.
In poker, it's not just about knowing how to lie, but also about knowing how to raise the stakes or play probabilities to determine the strongest hand on the table.
The lack of information about one's potential can only be estimated through a provocation close to the borders; this is the opportunity the Americans seized in 2014 to overthrow the Ukrainian gvt. and repeat what they tried in 1936 by arming Poland (the former concept of the sanitary cordon).
How can they switch from a theater of war into another ? Easy ! It is a question of manipulating public opinion as they already did in 9/11 to SAVE AMERICA from the crisis.
Generally, we learn from our mistakes to avoid repeating them. And it's during an armed conflict that we delve into history to understand its origins. One must believe that only in fashion does a cyclical phenomenon exist. Without wanting to resort to sarcasm, artificially creating a conflict by using HAMAS to justify a local intervention is truly treating people like fools.
The image war is primarily the one that targets public opinion at the expense of the invisible mechanisms that are set in motion, in order to make the 'pill' go down more smoothly.
DEDOLLARIZATION TAKES A BACKSEAT, OIL FIRST !
Do not ignore that the USMCA (formerly NAFTA) still remains the largest consumer market ahead of the EEA.
What is vulnerable or fragile for one state is an opportunity for another.
The composition of teams is now known to all. The G7 against the BRICs, gradually marking the end of a G20, some countries seize an opportunity in investing in newly available areas (Africa is an example).
As we observe a blatant loss of the former Western colonies, on which the latter built its wealth, it is entirely normal to see a conservative mechanism at play, detaching/tearing away the European zone at all costs to preserve the development of its own economic activity, much like a dog would defend its stake.
From an objective standpoint, the Soviet Union and Europe share a similar economic framework :
> A zone bringing together a group of states
> Free movement of goods and individuals within it
> The development of common projects using different parts of the zone
> But above all, a common currency
So, It took time to establish a common currency, therefore dedollarization won't happen right away
And where some of them failed to stand out in creating alternatives to the dollar as they all got eliminated (HUSSEIN, KADHAFI, CHAVEZ), the probability that the BRICS succeed in this global "decentralization" becomes more and more evident. This is one of the reasons that is increasingly appealing to countries wishing to join this organisation.
There is a certain logic if one looks at the geographic perspective of the 6 new members who have joined the BRICS, that it is imperative to secure the area to supply the new markets (Middle East / Africa), and consequently gain full control of the Red Sea and the Gulf of Aden (part of the BRI).
Israel is merely an opportunity for the West to slow down the development of this project !
Therefore, to return to this "small" war of secret service cartels, MOSSAD (and indirectly the CIA) could not have been unaware that Hamas was arming itself progressively, but above all, qualitatively. One might even assume that it was evident to anticipate, following the abandonment of 50 billion dollars worth of military equipment in Afghanistan, just like the initiation of the Marshall Plan for Ukraine in the supply of heavier weaponry, a scenario concocted from scratch to set up this new theater of war!
Something tells me that the cancelled cereal deal by the Russians has something to do with it...
What are you ready to do at any cost ?
www.macrotrends.net
No matter the price you put into it, it will be nothing compared to the resources of governments !
In conclusion, not only have you been manipulated in a 'scam' with war images you could never have imagined seeing in 1973, but you will all watch how the price of a barrel will skyrocket and get ready to pay your "full of tank" 5 times more expensive.
Russia's deputy PM NOVAK on NSE:OIL prices by year end : "Market sets the prices itself"
Why? Quite simply because the geographical area of the conflict is composed of OPEC, and therefore the likelihood of a refinery receiving a 'stray missile' is very significant.
As a result, the "Peace Makers" have decided to replenish their coffers to continue funding the production of ammunition...
FOR THE PLAYERS :
The last week close, before the busy weekend from the Gaza Strip left a gap between 84.90$ and 85.95$. There are barely 0.24$ left to close this one.
The experience of 1973 raised the thermometer by over 35$ (from 28$ to 65$) initially, ultimately ending above 146$ over the decade following the conflict.
147.5$ was the 2008's ATH (we know the reason...)
138.4$ was the Russia's SMO over Ukraine, which shows the first attempt to Break the Creek
Pull back above 92.63$ will trigger my Swing LONG
STOP BUY > 92.63$ | STOP LOSS 79$
TARGET 1 > 147.50$
TARGET 2 > 215.32$
Just take a look of 1973-1983 chart to understand !
I don't make the rules!

Crude Oil (CL) Gap Fill LongWhile it's unclear whether crude, which has experienced large moves recently on account of the developing conflict between Israel-Hamas, wants to trade higher or lower over the longer-term, we’re looking to take near-term longs after filling the downside futures gap formed 10/6. We’re only showing down to a 30-minute chart here, but there are some smaller supply/sell zones @ ~84.25-84.75, which could be used for initial profit targets. If the trade works for a bounce, you can also consider applying mechanical targets @ 1:1, 2:1, 3:1, etc. Regarding an exact entry price and stop loss placement, the gap fill demand zone is a bit messy. The closing price of the gap itself, technically, is 82.81, so ideally we’d see CL trade to that #. However, markets aren’t always THAT precise, so it could put in a low at a slightly higher price. Furthermore, stop placement really depends on the timeframe used. The “distal” (lower bound) line of the daily demand/buy zone is 81.50, so if you can afford the risk, a physical stop could be placed below (never align your stops exactly w/ a zone’s range + don’t use whole numbers/quarters). More conservative placement could be slightly below 81.71 or 82.31, but there’s a higher chance you’ll be stopped out; depending on account/position size and risk tolerance, you can always deploy a “small loss, reenter” strategy. If you’re nimble enough, consider using a micro timeframe (single-digit minute, tick, or volume-based chart) to ID a trend reversal signal (higher high, higher low) before entering. If CL violates recently formed daily demand (82.81-81.50), be aware that there are “bear trap” areas waiting just beneath. Entries within the corrective segment of the uptrend that began in late-June are valid until prices breech the 77.59 pivot.
As always, feel free to provide feedback and/or ask questions. Good luck, be smart, and enjoy the journey!
Jon @ LionHart Trading
