ukoil 8hours sell side 15% swing trade setup🔸Today let's review the 8 hour chart for brent oil . Noteworthy bounce in progress
after accumulation near lows, however currently getting overbought.
🔸OPEC production cuts finally kicked it, therefore we got a decent pump in the oil
market. Strong resistances overhead near 87.20 and 89.20, expecting bull trap setup
after we break above the stop loss clusters.
🔸Recommended strategy for BEARS: look out for bull trap setup near 90.60 and get
ready to short sell from overhead. limited upside beyond 90.60 usd, bears will target
re-test of mirror s/r level at 77.80 and 75.20 usd. this is a 15% swing trade setup
on sell side, good luck traders!
🎁Please hit the like button and
🎁Leave a comment to support our team!
RISK DISCLAIMER:
Trading Futures , Forex, CFDs and Stocks involves a risk of loss.
Please consider carefully if such trading is appropriate for you.
Past performance is not indicative of future results.
Always limit your leverage and use tight stop loss.
Brent

CRUDE OIL (WTI): Bullish Outlook For Next Week Explained 🛢️
WTI Crude Oil broke and closed above one more horizontal key resistance.
Buyers keep showing the signs of strength.
It looks to me that they will manage to push the prices even higher.
I will expect growth to 81.1 now.
❤️Please, support my work with like, thank you!❤️

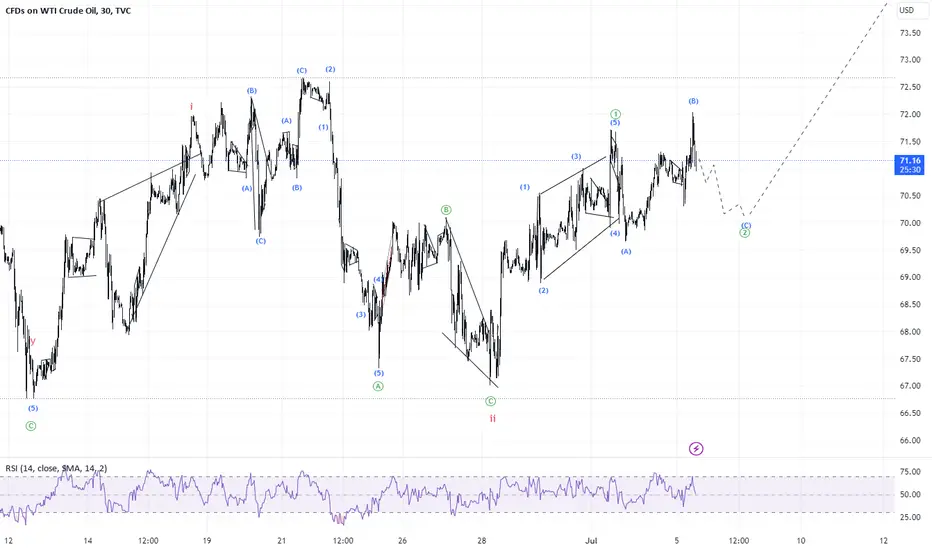
#WTI Update #OOTTFollowing my earlier count, I expect the price to start going sideways in wave iv without exceeding the top of wave (5) of of iii. So far, the count has proved successful, and I am not actively looking for alternatives.

150$Hello everyone
As the chart said we will have higher price for Brent Oil.
DXY must be checked or be in watchlist and either XAU is a chance for buy position.

Crude Oil Bearish Iran’s Growing Oil Production Boosting UpTechnical Analysis:
WEEKLY BEAISH
Daily Bearish
4H Bearish
In the chart above I have highlightened the trend, the Bear and Bulltraps.
We have falling Highs/falling Lows.
A bullish pullback signs eveytime low volume and low volatility
that is the evidence of bulltraps caused by oil companies(and big speculators) The oil companies have also their own trades who push the pices fo a short time to make profits and accumultae thie losses,caused by low oiil pices. Also thier investors demand higher pofits.
I am short in Oil, aleady fom July of 2022, and sell everytime the picks of the bullish short tem trend. This means I increase my selling positions bigge and bigger.So trade with the trend. I avoid to buy oil, or go long, nor I ignore the weekly reports, as they are vey short tem and can changed the next moment, but eview the fundamentals on bigge picture.
The maket will target 39USD.
So I have mentioend 4 different scenaios and shown you their routes. 3 scenaio ae bearish with very high probability:Tend is bearish, Fundamentals ae bearish.
The weak USD has less impact here, cuz it is not the only indiacto that moves the oil market.
To become Bullish(Scenario 4(see the chat above!!!) Many things must happen:
The ask for oil must incease damatically(OPEC production stop,world war,....)Even the impact or Russia Ukraine war was fo a short time.
The fundamental trend is beaish,as no one is inteested in higher oil prices. Even producers avoid it, as higher oil ppices cuases higher costs.
Indicators:
I have my own indicators, and dont use the common indicators.
So my Bulltrap/beatap detector is confriming that.
In the chart above we see that long term and mid term Indicators are red(Beaish trend/Stong bearish trend) The shot tem Indicator is geen, meaning bulltap. If you compare the indicator values withe the chart prices, you will notice they produce best possible signals whe to get short of long.
The same is true for daily chart, or lowe time frames.
Several factors can influence the direction of oil prices:
1. Supply and Demand Dynamics: If global oil supply surpasses demand, it can put downward pressure on prices. Factors such as increased production from major oil-producing countries or a decrease in global demand due to economic slowdowns or shifts towards renewable energy sources can contribute to weaker oil prices. Conversely, supply disruptions, geopolitical tensions, or unexpected increases in global demand can drive prices higher.
2. Economic Conditions: Economic growth and global economic stability play a significant role in oil price movements. During periods of economic expansion, demand for oil tends to increase, potentially leading to higher prices. Conversely, economic downturns or recessions can reduce demand for oil and exert downward pressure on prices.
3. Geopolitical Events: Political conflicts, sanctions, or disruptions in major oil-producing regions can impact oil prices. Supply disruptions or threats to supply can lead to price increases, while the resolution of conflicts or increased production capacity can contribute to price decreases.
4. Energy Transition Efforts: As countries and industries increasingly focus on transitioning to cleaner and renewable energy sources, the demand for oil may be influenced. Efforts to reduce greenhouse gas emissions and promote renewable energy can potentially lead to lower long-term demand for oil and put downward pressure on prices. However, the pace and extent of the energy transition vary globally, making it challenging to predict its immediate impact on oil prices.
It is crucial to consider that oil price movements are affected by complex and interrelated factors, and their future direction is challenging to forecast accurately. Market dynamics and unexpected events can cause significant price volatility, making it important for investors and stakeholders to closely monitor global developments and factors influencing the oil market.
Oil tried many times to break the 2022 lows at 75,33
Fundamentally nealy eveything is speaking for weaker oil prices:
1. U.S. Oil, Gas Rigs See More Losses
The total number of total active drilling rigs in the United States fell by 5 this week, after a 6-rig increase last week, according to new data from Baker Hughes published Friday.
The total rig count fell to 675 this week—81 rigs below this time last year. The current count is 400 fewer rigs than the rig count at the beginning of 2019, prior to the pandemic.
The number of oil rigs declined by 3 this week to 537, while the number of gas rigs fell by 2, to 133. Miscellaneous rigs stayed the same at 5.
The rig count in the Permian Basin fell by 5—13 rigs below this same time last year. The rig count in the Eagle Ford fell by 1, and was down 10 rigs from this time last year.
Primary Vision’s Frac Spread Count, an estimate of the number of crews completing unfinished wells (which is cheaper than drilling new wells), fell by 12 in the week ending July 7, to 260. The frac spread count is 25 behind where it was this time last year.
Crude oil production levels in the United States slipped back to 12.3 million bpd in the week ending July 7, according to the latest weekly EIA estimates—a gain of 100,000 bpd from the beginning of the year. U.S. production levels are now up 300,000 bpd versus a year ago.
2. U.S. Shale Challenges OPEC With Record Production In 2023
The EIA has forecast total U.S. output will hit 12.61M bbl/day in the current year, eclipsing the previous record of 12.32M bbl/day.
Energy experts have generally been bearish about U.S. crude supply with many arguing it has already peaked.
Rising costs as well as limited supplies of labor and equipment were some of the problems that were hamstringing efforts by U.S. shale to increase output.
3. Weaker US Dollar is bad for Oil Prices and Oil price will fall deeper. The reasons are:
A weakening of the US dollar can have various effects on the production and prices of oil. Here are some conditions and reasons that may lead to such an outcome:
1. Currency Exchange Rates: A weaker US dollar relative to other currencies can make oil more expensive for countries that trade in dollars. This can lead to reduced demand for oil, which may result in lower production levels to match the reduced demand.
2. Import Costs: A weaker US dollar can increase the cost of importing oil for countries that rely heavily on oil imports. Higher import costs can create an incentive for these countries to reduce their oil consumption or seek alternative energy sources, which can affect oil production levels.
3. Inflation and Monetary Policy: Inflation can be influenced by the strength or weakness of a currency. When the US dollar weakens, it can lead to higher import prices, including the cost of imported oil. If inflation becomes a concern, central banks may respond by tightening monetary policy, which can have a cooling effect on the economy and potentially impact oil demand and prices.
4. Global Economic Conditions: A weakening US dollar can be a reflection of broader global economic conditions. If the global economy is experiencing a slowdown or recession, demand for oil may decrease, resulting in lower oil prices. In such a scenario, a weaker US dollar may be just one factor contributing to the overall decline in oil prices.
It's important to note that the relationship between the US dollar, inflation, and oil prices is complex and influenced by multiple factors. Changes in oil prices can be influenced by geopolitical events, supply and demand dynamics, production decisions by major oil-producing countries, and other market forces. The interplay between currency exchange rates, inflation, and oil prices can vary depending on the specific circumstances and the broader global economic environment.
The news states that the total number of active drilling rigs in the United States has decreased by 5, following a previous increase of 6 rigs. Here are some potential interpretations and examples of the impact of this news:
4. Production and Investment: The decline in the number of active drilling rigs suggests a slowdown in oil and gas production activity in the United States. Fewer rigs imply that energy companies are scaling back their exploration and drilling operations, which can lead to a reduction in production levels. This decline may indicate a cautious approach by companies in response to various factors such as lower oil prices, reduced demand, or economic uncertainties.
5. Employment and Economic Effects: The decrease in active rigs can have ripple effects on the economy. As drilling activity slows down, it may result in job losses in the oil and gas sector, as well as related industries that support drilling operations. Communities heavily reliant on the energy industry may experience reduced economic activity and lower income levels.
6. Regional Impact: The news also provides specific information about the decline in the rig count in certain regions. For example, the Permian Basin saw a decrease of 5 rigs compared to the same period last year, indicating a potential slowdown in oil and gas exploration in that area. Similarly, the Eagle Ford region experienced a decline of 1 rig, which may suggest reduced drilling activity in that particular location. These regional variations can have localized economic consequences, affecting employment, local businesses, and government revenues.
7. Market Implications: The decrease in the rig count can influence oil and gas prices in the market. If the reduction in drilling activity leads to lower production levels, it could contribute to a decrease in the global oil and gas supply. Depending on the balance of supply and demand, this may put upward pressure on prices.
Overall, the decrease in the number of active drilling rigs suggests a potential slowdown in the US oil and gas industry. It can have implications for production levels, employment, regional economies, and market dynamics. However, it's important to consider that rig count fluctuations are influenced by various factors, and it is advisable to analyze longer-term trends and broader industry developments to gain a comprehensive understanding of the situation.
Based on the provided news, here are some interpretations and examples of the impact:
8. Frac Spread Count: The decrease in the Frac Spread Count by 12 suggests a decline in the number of crews completing unfinished wells. This indicates a potential slowdown in the completion of wells, which could be attributed to various factors such as reduced investment, operational challenges, or market conditions. Completing unfinished wells is generally cheaper than drilling new wells, so a decrease in this count may indicate cost-cutting measures in response to economic factors.
9. Crude Oil Production Levels: The report indicates that crude oil production levels in the United States slipped to 12.3 million barrels per day (bpd) in the week ending July 7. This slight decline in production may be influenced by factors such as maintenance activities, operational issues, or natural production declines. However, it's worth noting that compared to the beginning of the year, there has been a gain of 100,000 bpd, and production levels are up by 300,000 bpd compared to a year ago. These figures indicate a gradual increase in production over time.
10. Oil Prices: The news provides information about the current trading prices of WTI and Brent benchmarks. WTI benchmark was trading down $1.27 (-1.65%) at $75.62 per barrel, while the Brent benchmark was trading down $1.26 (-1.55%) at $80.10 per barrel. Despite the daily decline, both benchmarks have seen an increase compared to the previous week, with WTI up nearly $3 per barrel and Brent up $2.50 per barrel. The fluctuation in oil prices can be influenced by various factors, including global supply and demand dynamics, geopolitical events, and market sentiment.
In summary, the news suggests a potential slowdown in the completion of unfinished wells, a slight decline in crude oil production levels, and fluctuations in oil prices. These factors can be influenced by a range of economic, operational, and market-related considerations. It's important to monitor long-term trends and analyze broader industry developments to gain a comprehensive understanding of the situation.
Clean Energy Funds: The US government has allocated $20 billion from the EPA's Greenhouse Gas Reduction Fund to facilitate clean energy projects. The funds will be awarded through two competitions: the National Clean Investment Fund (NCIF) competition and the Clean Communities Investment Accelerator (CCIA). These initiatives aim to support clean technology projects, promote financing options, and focus on low-income and disadvantaged communities. The move is part of the government's efforts to expand clean energy investment and reduce pollution nationwide.
11. Subsidy War: The news mentions a "subsidy war" between European countries and the United States, as the latter is becoming increasingly attractive to companies due to its generous planned subsidies. France has accused the United States of unfair competition and has introduced its own act, the Net Zero Industry Act, in an attempt to compete.
12. Iraq's Oil Production: Iraq's parliamentary oil and gas committee plans to increase the country's oil production to over five million barrels per day (bpd), with the potential to reach 13 million bpd. Iraq is considered one of the largest underdeveloped oil frontiers globally, with substantial proven reserves and the potential for even more undiscovered resources. However, endemic corruption has hindered growth in the oil industry, impacting Iraq's ability to maximize its oil production potential.
13. Corruption Challenges: Iraq's oil and gas industry has been plagued by endemic corruption, resulting in significant financial losses for the country. This corruption has deterred Western companies from investing heavily in Iraq, despite its vast oil reserves. The lack of infrastructure investments and the mismanagement of compensation payments have contributed to lower production levels than what could be achieved with the available reserves. Corruption in Iraq's oil sector has been a recurring concern highlighted by Transparency International and has hindered effective state-building and service delivery.
14. Western Companies' Withdrawal: Major Western oil companies, including BP, Shell, and ExxonMobil, have withdrawn or planned to reduce their involvement in Iraq's oil fields due to risks associated with corruption, security concerns, and inadequate legal structures. These companies have been cautious about operating in Iraq, as political changes and uncertainties can impact their operations and pose risks to their business interests.
Overall, the news highlights the US government's commitment to clean energy investment, the challenges faced by Iraq in realizing its oil production potential due to corruption, and the withdrawal of Western companies from Iraq's oil sector. The underlying theme in both stories is the need for transparent governance, sound legal frameworks, and anti-corruption measures to create an environment conducive to sustainable energy development and attract long-term investments.
4,Potential Impact of Iran's Oil Production: Iran's monthly oil production is gradually increasing, posing a challenge to OPEC's control over the oil market. Although talks of a new nuclear deal leading to an influx of Iranian oil have created market instability, such a deal has not materialized. However, if sanctions are lifted and Iran's production potential is fully realized, it could conflict with OPEC's efforts to regulate the market and maintain high oil prices. The uncertainty surrounding Iran's oil production adds a mysterious element to the oil markets.
1. OPEC's Concerns: The possibility of Iran's oil returning to the market raises concerns for both traders and OPEC. OPEC has exempted Iran from production cuts for years due to sanctions. Iran's oil production figures, reported monthly by OPEC, may not be entirely accurate. The potential reentry of Iranian oil into the market could disrupt OPEC's influence and market control.
Rising Investment in Offshore Exploration: Despite a focus on disciplined investment, major oil companies are increasing their investment in offshore exploration. They anticipate higher returns from large offshore projects compared to low-carbon energy investments. This shift in strategy is driven by the expectation of increased profitability and the need to ensure a secure supply of oil and gas.
1. Offshore Rig Demand: Deepwater rig utilization is on the rise, driving up rates as companies ramp up exploration activities. Demand for offshore rigs is expected to increase by another 20% from 2024-2025. The "Golden Triangle" regions of Latin America, North America, and Africa, along with parts of the Mediterranean, are expected to account for a significant portion of global floating rig demand.
Clean Energy Funds: The US government has allocated $20 billion from the EPA's Greenhouse Gas Reduction Fund to facilitate clean energy projects. The funds will be awarded through two competitions: the National Clean Investment Fund (NCIF) competition and the Clean Communities Investment Accelerator (CCIA). These initiatives aim to support clean technology projects, promote financing options, and focus on low-income and disadvantaged communities. The move is part of the government's efforts to expand clean energy investment and reduce pollution nationwide.
1. Subsidy War: The news mentions a "subsidy war" between European countries and the United States, as the latter is becoming increasingly attractive to companies due to its generous planned subsidies. France has accused the United States of unfair competition and has introduced its own act, the Net Zero Industry Act, in an attempt to compete.
2. Iraq's Oil Production: Iraq's parliamentary oil and gas committee plans to increase the country's oil production to over five million barrels per day (bpd), with the potential to reach 13 million bpd. Iraq is considered one of the largest underdeveloped oil frontiers globally, with substantial proven reserves and the potential for even more undiscovered resources. However, endemic corruption has hindered growth in the oil industry, impacting Iraq's ability to maximize its oil production potential.
3. Corruption Challenges: Iraq's oil and gas industry has been plagued by endemic corruption, resulting in significant financial losses for the country. This corruption has deterred Western companies from investing heavily in Iraq, despite its vast oil reserves. The lack of infrastructure investments and the mismanagement of compensation payments have contributed to lower production levels than what could be achieved with the available reserves. Corruption in Iraq's oil sector has been a recurring concern highlighted by Transparency International and has hindered effective state-building and service delivery.
4. Western Companies' Withdrawal: Major Western oil companies, including BP, Shell, and ExxonMobil, have withdrawn or planned to reduce their involvement in Iraq's oil fields due to risks associated with corruption, security concerns, and inadequate legal structures. These companies have been cautious about operating in Iraq, as political changes and uncertainties can impact their operations and pose risks to their business interests.
Overall, the news highlights the US government's commitment to clean energy investment, the challenges faced by Iraq in realizing its oil production potential due to corruption, and the withdrawal of Western companies from Iraq's oil sector. The underlying theme in both stories is the need for transparent governance, sound legal frameworks, and anti-corruption measures to create an environment conducive to sustainable energy development and attract long-term investments.

#OIL Update #OOTTWe just observed a barrier triangle, which signals further leg up. Although I find it difficult to break down wave [ 3] into a distinct five-wave impulse, it does appear impulsive.
Based on the constant pace of advance in waves 1 and 3, I have a suspicion that wave 5 could potentially be a thrust, or on the contrary a relatively insignificant high. Either way, it should differ.

Strifor || UKOIL-07/19/2023Preferred direction: BUY
Comment: The medium-term and long-term picture of oil looks most likely in favor of the seller. To be completely sure of sales, it is necessary to wait for the price to close below the level of 77.39. The short-term picture is quite unusual, and most likely today-tomorrow will be in favor of the buyer. The level of 80.59 suggests itself for a test, and perhaps further buyers will be able to reach the local maximum at the level of 81.7.
Thank you for like and share your views!

Crude Oil (WTI): Key Levels to Watch This Week 🛢️
Here is my latest structure analysis for WTI Crude Oil.
Resistance 1: 77.1 - 77.3 area
Resistance 2: 78.6 - 79.9 area
Support 1: 72.3 - 73.1 area
Support 2: 66.8 - 67.3 area
Consider these structures for pullback/breakout trading this week.
❤️Please, support my work with like, thank you!❤️

Strifor || XAUUSD-07/17/2023Preferred direction: BUY
Comment: Metals remain a medium-term and long-term BUY priority, but a false down move is more likely in the short term before more global impulse continue. Rollback is not considered below the support of 1938.915. Growth target (medium term) level 1981.680.
Thank you for like and share your views!

Strifor || USDCAD-07/17/2023Preferred direction: BUY
Comment: Almost only one currency pair fell under Friday's profit-taking, and that is the Canadian dollar. In addition, the pressure on the currency continues to have a fall in oil prices, which is likely to continue. Against this background, it is expected to break through the level 1.32399 soon, and further growth on the impulse to the resistance 1.33347.
Thank you for like and share your views!

#Oil Update #OOTTDespite the fact that the price moved almost exactly as outlined in the prior report, the short term subdivisions are difficult to read at this stage. There is no cause to close long positions at this point. I'll just have to be patient.
Gasoil appears to offer a more clear picture.

#Gasoil Update #OOTTThis time, Gasoil has a more defined structure, signalling that the advance will continue. The final shape is yet unknown. The terminating diagonal is solely included for illustration purposes.

NatGas Update Natural gas appears to be nearing the end of its correction before continuing its ascent into the end of the summer/earluy autumn.
Since wave 3 is shorter than wave 1, wave 5 must be shorter than wave 3 because the third wave cannot be the shortest.
Wave 4 can be done as an expanded flat (notice the rule with variation with wave 2). Also, we can expect a running triangle.
The bigger picture remains unchanged from the prior update.

Strifor || USDCAD-07/13/2023Preferred direction: SELL
Comment: When approaching the support level of 1.31385, the currency pair immediately received a signal from buyers and rebounded. However, most likely this is a partial fixation of sellers whose ambitions locate below this support. By the end of this week, it is expected that the instrument will drop below this level. Before the weekend, the currency pair is likely to begin to recover slightly.
Thank you for like and share your views!

#NatGas UpdateIt is possible that we are still working on the corrective structure [ x]. Wave b of (y) may also be incomplete, making the whole structure to take longer (perhaps the end of July).

Natural Gas - The Girl Who Hopes You Remember HerSince the end of February, and more accurately mid-March, the volatility on Natural Gas has all but disappeared.
This is a good thing if you're bullish, because it's both consolidation and indicates accumulation.
It's also a good thing from a sentiment/narrative perspective because everyone has all but forgotten trying to gamble on BOIL.
Moreover, it's strange for Natural Gas to trade so cheaply in light of the situation with the conflict between NATO and Vladimir Putin and how it impacts both China and Xi Jinping and Europe.
I've said in many of my previous natural gas calls that $10 wasn't the top. And if that supposition is true, the fact that we're trading at such an enormous discount for so long is really notable.
Just look how big the discount is on the monthly:
One of the core tenants of 2023's thus far price action being a likely bottom is that Natty has swept out the $2 mark twice, the last time in April.
Since, it's then made a series of higher lows and now looks certain to make higher highs.
Moreover, on the weekly we see any red bars are continually traded through to the upside by the MM.
All of this comes while the algorithm has been playing around the December of 2020 monthly pivot.
The fact that $2 has been protected so strictly and that the high of the year was set at only $3, which it touched for only a day, a Friday, to start March tells us that the target is more likely to be up than it is to be down.
It is very hard for me to tell you if Natty is going to do $3.2, $3.5, $4, or $4.5. It may just double top at $3 and then go back to $1.8.
What I can say is that getting over $4 ought to have a high degree of resistance. However, if the algs push it through, it's going to take off and take off in a hurry.
One thing that is true is that you really should not be bearish on energy.
I also believe that the Nasdaq in specific is about to correct so violently that it's going to set a new low.
We may be in a scenario right now where we see something like:
Equities correct
USD up
Energy up
Metals up
10Y yield up
VIX up
Instead of the usual everything down and everything up all at once shenanigans.
The world is running out of energy. Oil is not a bear market.
Worldwide and US production peaked in 2018 and hasn't come back.
A lot of the "oil" that is included in daily production numbers isn't actually crude oil but is "natural gas liquids" and other lesser substances.
In a climate where mankind is using more and more electricity and temperatures are getting hotter and hotter, there is no reason to believe that natural gas should stay this cheap.
How hot will July, August, and September be in North America?
Natural gas _is_ electricity. It's also plastics. It's also what the places that get winter use to fuel their furnaces to stay alive.
Are you really expecting $1.50?

Crude Oil (WTI): Top-Down Analysis & Trading Plan 🛢️
WTI Crude Oil is retesting a broken horizontal key level.
The price formed a cup and handle pattern, approaching that.
The neckline of the pattern was broken.
I believe that the market will resume the growth soon
Goals: 73.8 / 74.4
❤️Please, support my work with like, thank you!❤️

Crude Oil (WTI): Bullish Outlook Explained 🛢️
WTI Crude Oil is very bullish since the end of June.
The market even managed to break and close above a key horizontal resistance on a daily.
The broken structure turned into support now.
That constitutes a safe zone to buy from.
I believe that probabilities will be high that the market will keep growing.
Next resistance is 74.7
❤️Please, support my work with like, thank you!❤️

WTI UpdateThe price appears to bounce back as expected, with OPEC+ output curbs finally biting. Russia announced a voluntary decrease of 500 kbd that will remain through the end of August.
The technical context entails an acceleration in wave [ 3] of iii.
Most ElliottWave traders aim for a third of the third when the price moves a considerable distance with no noticeable pullback.
I don't have any alternative options now, but given how difficult it was to pick the bottom, I won't celebrate until the end of the move.
The larger picture stays unchanged. Either a triangle as wave Y of (X) that will last until the end of 2023 or a more sharp rally as wave C of (X) (black labels).
I'll reiterate that waves wxy of (b) and [ w] [ x] [ y] of wave ii are a little complex, which is typically a bad sign. However, I'm struggling to come up with an immediate bearish scenario.

Crude Oil - Bearish On Oil? Saudis Made The US Cover Its Short.I've had a number of successful calls on crude oil, which you can find in my post history. In those calls, I had always been bearish on oil, anticipating a run to a 4-handle.
However, I reassessed my prior assumptions when the MMs took out the Low Of The Year in quick order to start May. I haven't been particularly sure in the time that has passed, but between price action and some recent news, I now believe oil is set to reverse.
The situation in mainland China with Xi Jinping and the Chinese Communist Party is very tense. The pandemic has taken a huge toll on the country, which the Party is not reporting to the world, and you can tell this if you look at their obviously bogus COVID death and infection stats published on major data aggregators.
This matters because since Putin invaded Ukraine last year, there's become something of an alliance between the Saudis, Russia, China, and India, with many oil transactions no longer settling in the U.S. Petrodollar.
So you have to be really careful trading right now with the geopolitical situation at hand. Everyone has flipped bullish on equities and is expecting a new parabolic run, but the situation is just as prime for a sharp and dramatic turnaround, which I reference in my recent call on the SPY ETF:
SPY - It's Life or Death For Bears
When it comes to China, Xi has the looming threat of having inherited Jiang Zemin and the CCP's persecution of Falun Gong, which targeted 100 million people and has even harvested their organs.
Xi and the CCP also face the growing trend of the movement to return to China's traditional 5,000 year culture, which is the crown jewel, the magnum opus, of the whole world and all of human history.
So the most important country in the world is very unstable, and you aren't hearing anything about what is going on. But the controllers know something is wrong and are scurrying about frantically, thinking about how they can take your stuff on the way down.
So, my bearishness on oil has been based on the fact that the Biden Administration has drained the Strategic Petroleum Reserve, significant because although OPEC+ is a huge producer of oil, the US and its vassals, such as Canada, by far produce the most oil in the world.
Washington selling the SPR is a short on the market by definition and they unloaded hard in the 90s and 80s, saying they wanted to buy back in the 60s.
Yet the two times we've had oil in the 60s, they haven't rebought. I believe they intended to drive the market lower for longer and rebuy then.
A few recent pieces of news came out.
One is OPEC had a scheduled meeting in Vienna in early June, which they held in person, despite the next major meeting being in July. During that meeting, Reuters, WSJ, and Bloomberg found themselves disinvited, while every other media did not.
Moreover, on Friday The Washington Post stated that Saudi King MBS warned the Biden Administration it would inflict economic pain when the US complained about production cuts.
The Saudis have teeth because they own Aramco, which is also stationed in the United States, and the Saudis buy arms from the military industrial complex.
NATO and the US needs to have the Saudis not wanting to get rid of them if they are to have any chance of deposing Putin and taking Russia for the New World Order.
It's been well known that OPEC+, of which the Saudis are the biggest producer by far, want higher prices and need $80-100 to continue to run a national surplus.
The second biggest news is a June 9 announcement from the Department of Energy stating the US will replenish 6 million barrels of oil from the SPR.
This means Washington is covering its shorts.
Now, you'll complain, fairly so, that the Democratic Socialists of America have sold some 280 million barrels of oil from the SPR since Biden was inaugurated in 2021, and you're right.
6 million barrels is certainly a drop compared to what they've sold.
However, a look at the EIA website puts the 6 million barrel figure into perspective: since November of '22, only 20 million barrels have been drained.
I will repeat myself again: the market maker is covering its shorts and that means it's very immediately dangerous to be short on oil and oil companies.
So, this is hard to go long on because the delta between $70 and the $63 low is 10%, and on futures at $1,000 PnL per $1 move per lot, that's a lot of "Ouching" as Abdulaziz has said for early comers.
However, generally speaking a bottom is a bottom and that means there won't be a new low. Either way, it's up to you to figure out where to go long and when to go long and if you want to go long.
The most immediate target, even in an ultimately bearish continuation scenario, is $85, and more specifically, $95.
And you may very well see a 9 handle as early as August or September.
The problem with short on oil is on the monthly:
COVID hysteria was an ultimate bottom. If -$40 wasn't an ultimate bottom then you call your mom and ask her what an ultimate bottom could be and let us know in the comments.
If you've got an ultimate bottom and no real highs were taken, the the market is aiming higher, and not lower.
A breakdown of price here means that oil as an industry is not going to recover, but yet green energy is a fallacy and alternative energy sources are nowhere to be found, while worldwide crude supply is actually not particularly abundant anymore.
So what fundamental story is supposed to be used to drive oil lower? A bunch of talking heads on Twitter complaining that oil is going lower?
That doesn't move markets. Producers have to deposit actual oil to go bigly short because contracts settle in physical goods.
Moreover, the price action in March before the big move down in May was really, really peculiar. You see it more clearly on the weekly:
Like, $2 away from a breakaway gap is where it chose to dump and actually set a new low of the year?
Really, to me, this says that since we haven't dumped anymore and now we're getting fundamentally extremely, extremely bullish news, that the target can only be $95.
People, for whatever reason, tend to like to buy above highs and so they'll get bullish at $85 and $95.
But why not get bullish at $70?
Warren Buffet keeps buying OXY. Is he doing this because oil is on the verge of another 5 year bear market?
If oil is going to pump, what does this mean for equities? What does it mean for the VIX?
With what's going on in the world, what does it mean for the future? How long will the happy continue?
It's really worth giving some sober thought to, and it's really worth cutting the furus and the propaganda outlets out of your information cycle.

Results of the OPEC+ MeetingThe OPEC+ meeting was held this week. CNBC reports the words of its head, Haitham al-Ghais, here’s a brief summary:
→ the organization (which currently consists of 13 countries) is looking for new members;
→ the macroeconomic situation is unclear due to the banking crisis, high inflation, the possibility of a recession and new outbreaks of COVID;
→ nevertheless, the organization is positive about the demand for oil in the second half of 2023.
Judging by the fact that no sharp statements were made, OPEC members are satisfied with the current situation. The oil price chart shows that the level of 72.25 in June confirmed its support for the market. It may be based on the decisions of OPEC to reduce production volumes when prices fall to these levels.
It can be stated that the market has been in the consolidation stage for 2 months already. But with strong support from OPEC, the bulls may try to break through the current resistance level (1).
This article represents the opinion of the Companies operating under the FXOpen brand only. It is not to be construed as an offer, solicitation, or recommendation with respect to products and services provided by the Companies operating under the FXOpen brand, nor is it to be considered financial advice.

#OIL Update #OOTTLooking at what the price did in (A)(B) section I think there will be another minor decline before the take off.
UKOIL(BRENT)-07/05/2023Preferred direction: BUY
Comment: The long idea for oil has been working out very well and after completing the planned path earlier, the level of 77.39 opens for the buyer. A rather difficult obstacle for the buyer, because if not for it, then the price could rise above 78 from the current ones on the impulse. Therefore, in the near future, an approach to 77.39 is expected, then consolidation (most likely) and after a rise above 78.
Thank you for like and share your views!
