Dive into the oil storm of 2025!In 2025, oil prices declined due to rising output from OPEC+ countries, growing inventories in the U.S., weakening global demand, a stronger dollar, and ongoing trade tensions between major economies. Further pressure came from OPEC+’s plan to boost production by 411,000 barrels per day — three times more than previously scheduled. A final decision is expected at the May 31 meeting. This move aims to strengthen the Alliance’s market position, particularly against U.S. shale producers, but it has deepened the supply-demand imbalance, pushing prices to their lowest levels in four years .
Despite current challenges, several factors could support a recovery in oil prices :
1. Rising demand in emerging markets : Developing economies are expected to continue increasing energy consumption as they grow, boosting oil demand.
2. Limited investment in production : Lower investment in exploration and drilling — especially in a low-price environment — may lead to tighter future supply, which can support prices.
3. Geopolitical risks : Conflicts and instability in oil-producing regions can disrupt supply chains, traditionally driving prices higher.
4. Slower non-OPEC+ output growth : While non-OPEC+ production is expected to rise in 2025, the U.S. Energy Information Administration forecasts slower growth in 2026, easing pressure on prices.
5. Possible OPEC+ output cuts : If the current production increase fails to deliver the desired results, OPEC+ may reverse course and reduce output to stabilize the market.
In 2025, the oil market is under strain due to surging OPEC+ output, inventory surpluses, weak global demand, and economic uncertainty. Yet, despite prices plunging to four-year lows, there’s still room for recovery. Future price trends will hinge on OPEC+ decisions, emerging market demand, geopolitical events, and investment patterns in the energy sector. The upcoming OPEC+ meeting could be a turning point for the entire market.
Brent

Brent Crude Oil Weekly Short Trade SetupBrent Crude Oil Weekly Short Trade Setup (as of May 22, 2025)
This chart reflects a prolonged downtrend within a clearly defined descending channel. Brent Crude Oil continues to respect the dynamic resistance of the upper boundary and has failed to sustain bullish momentum in recent months. The current price action presents a low-risk, high-reward short opportunity based on technical structure and projected price movement.
Entry Price: 64.994
The entry level at 64.994 is tactically chosen near the midpoint of the descending channel and slightly below the recent consolidation area. This level marks a rejection zone where price previously attempted to break higher but failed to gain traction.
The reason for this entry is:
• Price is reacting to the 20-period moving average (blue line), which has consistently acted as dynamic resistance.
• The last bullish push failed to close above the mid-channel zone and reversed near the projected retest line, indicating sellers are still in control.
• Entering here means you're entering after confirmation of a failed breakout rather than preemptively.
This is a conservative but smart entry point, favoring a continuation move in the direction of the dominant trend.
Stop Loss: 68.867
The stop loss is placed at 68.867, which aligns with the chart’s "Conservative Projected Retest Price Level" marked in green.
Here’s why this stop makes technical sense:
• This area corresponds to prior horizontal resistance and is very close to the descending channel’s upper boundary.
• A move above this zone would invalidate the bearish structure, suggesting a potential shift in momentum.
• Setting the stop here protects the trade against a deeper bullish retracement while still giving it enough room to breathe around minor fluctuations.
The risk is controlled, and you're only exiting if the market structure genuinely breaks.
Take Profit: 56.850
The take profit level is projected at 56.850, slightly above the "Weak Support Zone" marked in red.
The reasoning:
• This zone has acted as prior psychological support, but the label “weak” implies limited buyer strength here, increasing the chance of a breakdown.
• Price has tested this level before and rebounded only modestly, suggesting vulnerability.
• It also aligns closely with the lower boundary of the descending channel, which provides technical confluence as a realistic downside target.
• Setting TP just above support allows for safer profit booking without being too greedy, avoiding the risk of reversal right at a major support.
This exit point balances profit potential and probability, giving the trade a favorable risk-to-reward ratio.
Trade Structure Summary
• Trend: Bearish (confirmed by lower highs/lower lows and downward-sloping channel)
• Technical Confluence: Dynamic resistance, channel boundaries, horizontal zones, moving average rejection
• Market Sentiment: Weak upside follow-through despite occasional rallies, suggesting bearish control
Risk-Reward Outlook
• Entry: 64.994
• Stop Loss: 68.867
• Take Profit: 56.850
• Risk (SL - Entry): 3.873
• Reward (Entry - TP): 8.144
• Risk-Reward Ratio: Approximately 1:2.1
This setup offers more than twice the reward for the risk taken, making it an attractive candidate for traders seeking asymmetrical returns.

Crude oil gains could be limited. Here's whyAlong with other risk assets, crude oil has had a positive day, albeit a much quieter one compared to the major indices. It has been held back in part by the dollar also finding good support. So, I think a large part of the rally today in WTI is just a function of the market pricing in higher demand because of lower tariffs. Thus, it is the removal of a bearish factor driving prices higher, which could be factor for a while yet as market finds a new equilibrium. The underlying issue of an oversupplied market is what will ultimately determine oil prices. On that front, you have the OPEC ready to release more withheld supplies as it doesn’t want to lose more market share to non-OPEC producers. Thus, the upside linked to a brighter demand outlook should be capped. So, while I do think prices may rise a little further, I don’t think that we will see significantly higher prices with the current state of supply picture. I wouldn’t be surprised if $70 turns into resistance now on Brent, or if WTI holds this shaded yellow resistance range you can see on this chart around $65 area.
By Fawad Razaqzada, market analyst with FOREX.com

USOIL - Important Breakout !Hello Traders !
The USOIL failed to break the support level (56.047 - 55.102).
Currently, The lower high is broken (Change of Character).
So, I expect a bullish move🚀
________________
TARGET: 63.500🎯

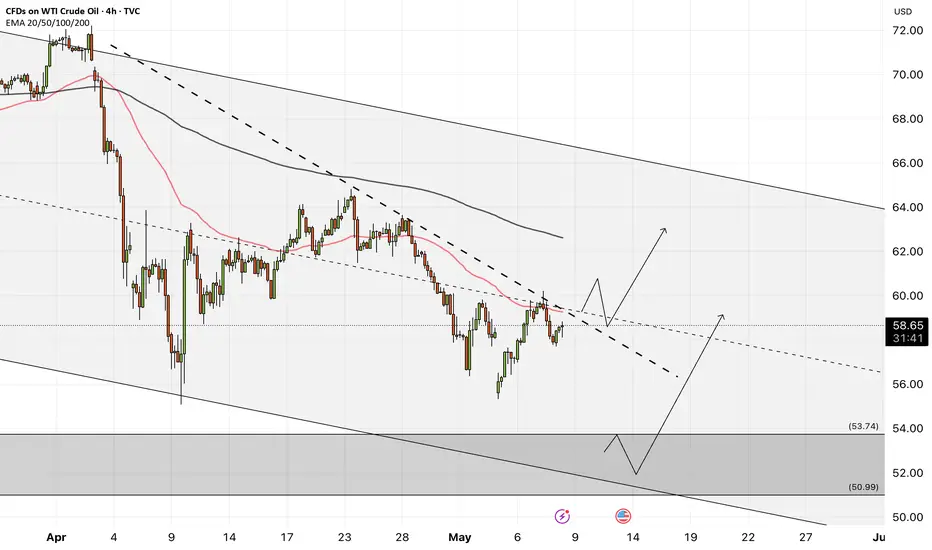
WTI - Will Oil Return to the Uptrend?!WTI oil is below the EMA200 and EMA50 on the 4-hour timeframe and is moving within its medium-term descending channel. If the downward trend continues towards the zone, the next opportunity to buy oil at a good price will be presented to us. A break of the drawn downtrend line will also be another confirmation to enter the oil buying process.
Goldman Sachs anticipates that the Federal Open Market Committee will maintain its pause on interest rate hikes. According to the bank’s asset management division, the continued strength of the labor market remains a crucial factor influencing the Federal Reserve’s decisions, prompting the central bank to adopt a cautious stance.
In a recent note, Goldman Sachs stated: “The Federal Reserve is currently in a holding pattern, waiting for economic uncertainties to diminish.” Although recent employment data have exceeded expectations, the bank believes that initiating a rate-cutting cycle would require clear signs of labor market weakening—a development that could take several months to materialize. The note further stated: “Since the labor market has yet to exhibit any significant softening, the likelihood of another hold decision in the next meeting is high.”
Meanwhile, U.S. President Donald Trump, ahead of his upcoming trip to Saudi Arabia, Qatar, and the United Arab Emirates, responded to a question about the potential renaming of the “Persian Gulf” to the “Arabian Gulf” in official U.S. documents. He stated that a decision would be made following his trip and a related discussion.
Trump acknowledged the sensitivities surrounding the issue, saying he does not wish to offend anyone. He also referenced his prior executive order to rename the “Gulf of Mexico” as the “Gulf of America,” which he described as a necessary move. He concluded by noting that a final decision regarding the name of the Persian Gulf would be made after the scheduled discussions.Additionally, the RIA Novosti news agency reported on Thursday that Chinese President Xi Jinping and Russian President Vladimir Putin had officially begun talks at the Kremlin. Prior to the discussions, Putin expressed his intention to engage with President Xi on “a broad range of bilateral relations,” emphasizing that the Russia-China partnership is mutually beneficial. He also expressed his willingness to visit Beijing for a celebration marking China’s victory over Japan.
According to the report, the two leaders are expected to issue joint statements and address the media following their talks. A correspondent from the TASS news agency reported that the agenda for the Xi-Putin discussions is likely to include bilateral cooperation in various sectors, such as energy, the conflict in Ukraine, and the development of the “Power of Siberia 2” gas pipeline project.
Brent under pressure: A rebound may be comingIn 2025, oil prices have come under significant pressure, falling more than 21% since the beginning of the year — from $75 to around $59 per barrel of #BRENT. This decline was driven by increased production from OPEC+ countries, weak global demand (particularly in Asia), heightened economic risks due to trade disputes, and rising output from non-OPEC producers such as the U.S. and Brazil. Together, these factors created an oversupply amid stagnant demand.
Currently, the oil market continues to be shaped by a range of influencing factors. While accurately predicting prices remains a challenge, several key drivers are likely to steer oil price movements in the near term. Here’s a look at the main bullish and bearish factors:
• Geopolitical tensions (Bullish driver): Ongoing or emerging conflicts in key oil-producing regions (such as the Middle East and Eastern Europe) raise concerns about potential supply disruptions. Even without actual disruptions, the perceived risk leads traders to factor in a “risk premium,” pushing prices higher. Any escalation could trigger sharp price spikes.
• OPEC+ policy (Bullish/neutral driver): The alliance’s production decisions remain a major influence on supply. If OPEC+ maintains or tightens its current output cuts to balance the market or target price levels, this will support price growth or at least stability. Conversely, quota breaches or output increases would weigh on prices.
• Global economic outlook (Bearish/bullish driver): The trajectory of global economic growth directly affects oil demand. Signs of GDP slowdowns in major economies (U.S., China, EU) tend to weaken demand and drag prices lower. On the other hand, if economic growth proves more resilient than expected, it would support oil demand and prices. Uncertainty over the growth path of many countries persists in 2025.
• Non-OPEC+ output growth (Bearish driver): Countries outside of the OPEC+ alliance — including the U.S. (shale), Brazil, Guyana, and Canada — continue expanding their production. Significant output increases from these nations could offset OPEC+ efforts and lead to market oversupply, applying downward pressure on prices.
• Energy transition and underinvestment (Medium-term bullish driver): ESG pressures, the global shift toward renewables, and uncertainty around long-term fossil fuel demand have led to underinvestment in new oil exploration and development. If existing capacity declines faster than new projects come online, a structural supply deficit could emerge, supporting higher prices even amid the energy transition.
FreshForex analysts believe that, given ongoing geopolitical risks, strict OPEC+ policies, and underinvestment in production, the oil market is nearing a potential upward reversal. A modest uptick in demand or increased tension could be enough to put oil back on a growth trajectory.

Brent Crude Opens with a Bearish GapBrent Crude Opens with a Bearish Gap
As shown on the XBR/USD chart, Brent crude oil opened this Monday morning around $59.00, forming a bearish gap relative to Friday’s closing price of approximately $61.40.
The current Brent crude oil price is near the yearly low reached about a month ago, following the announcement of Trump’s tariffs, which turned out to be significantly higher than expected.
Why Is Oil Falling?
As we noted on 30 April, market participants are closely watching news related to OPEC+. Over the weekend, during an online meeting (according to media reports), the following developments occurred:
→ It was stated that the current oil market is fundamentally healthy;
→ A decision was made to accelerate the pace of oil production increases.
According to the plan, output will rise by 411,000 barrels per day — with some believing this move is partly due to certain OPEC+ countries previously failing to adhere to production quotas.
Technical Analysis of the XBR/USD Chart
Oil price movements in 2025 form a descending channel (shown in red), with progressively lower highs and lows indicating bearish sentiment.
Although bulls may hope that the lower boundary of the channel could act as support, bears are showing signs of dominance (as indicated by arrows):
→ the median line of the channel previously acted as resistance;
→ now, similar behaviour is seen at line Q, which divides the lower half of the channel into two quarters;
→ the Rounding Top pattern also signals strong selling pressure.
Fundamentally, oil prices are supported by China’s willingness to negotiate tariffs with the US. However, considering the OPEC+ decision and ongoing fears of a global recession, the current downward channel on the Brent crude oil price chart is unlikely to lose relevance any time soon.
This article represents the opinion of the Companies operating under the FXOpen brand only. It is not to be construed as an offer, solicitation, or recommendation with respect to products and services provided by the Companies operating under the FXOpen brand, nor is it to be considered financial advice.

USDCAD | Technical Rebound or Final Stop Before the Crash?USDCAD is currently in a highly delicate phase: the price has reached a key weekly demand zone between 1.3720–1.3820, which overlaps with a strong Fibonacci retracement cluster (0.705–0.78) of the previous bullish leg. So far, the reaction has been muted, but price compression and fading volatility suggest a potential short-term rebound.
However, looking at the bigger picture, the macro and positioning signals are flashing red for the US dollar:
📊 COT Report: Non-Commercials are significantly increasing short positions on USD and reducing shorts on CAD → bearish bias on USDCAD
🧠 Retail sentiment: Most retail traders are long on USDCAD → contrarian bearish bias
🗓️ Seasonality: May is historically negative for the USD and positive for the CAD → further confirms the short thesis
Only a structural recovery above 1.4150 on the weekly close would invalidate the bearish setup. Until then, any retracement towards 1.3980–1.4050 should be seen as an opportunity to sell strength.
🎯 Key Levels:
Sell zone: 1.3980–1.4050
Invalidation: Weekly close > 1.4150
Targets: 1.3720 – 1.3550
🔔 Critical note: When everyone is long, often the only direction left is down.

Potential Decline of Brent Oil Price to $50 in the Near Future.Brief Overview of Events and News Explaining the Potential Decline of Brent Oil Price to $50 in the Near Future.
➖ Increased OPEC+ Production:
On April 3, 2025, eight OPEC+ countries unexpectedly decided to accelerate production increases, adding 411,000 barrels per day starting in May. This decision triggered a price drop, with Brent falling 6.42% to $70.14 per barrel at the time.
Analysts like Amrita Sen from Energy Aspects noted that this move pressures “lagging” countries to meet quotas, but the market interpreted it as an oversupply signal.
Source: OilPrice.com, "OPEC+ to Raise Oil Production by More Than Expected in May," April 3, 2025 (oilprice.com)
➖ Decreased Demand Due to Economic Challenges:
On April 14, 2025, OPEC revised its 2025 oil demand growth forecast downward by 150,000 barrels per day to 1.3 million barrels per day, citing trade tensions and weak economic indicators. JPMorgan also raised the likelihood of a global recession to 60%.
Source: OilPrice.com, "OPEC Lowers 2025 Oil Demand Forecast on Trade Tensions," April 14, 2025 (oilprice.com)
➖ Trade Tariffs and Global Instability:
On April 3, 2025, U.S. President Donald Trump announced new tariffs on trading partners, heightening recession fears. Fitch Ratings described this as the highest level of U.S. import tariffs since 1910. Brent dropped 4% immediately following the announcement.
Source: OilPrice.com, "OPEC+ to Raise Oil Production by More Than Expected in May," April 3, 2025 (oilprice.com)
➖ Geopolitical De-escalation:
On April 25, 2025, reports emerged of progress in U.S.-Russia talks on Ukraine, as well as Iran’s openness to nuclear negotiations. This reduces geopolitical risks and increases the likelihood of higher oil supply on the market.
Source: OilPrice.com, "Oil Set For Weekly Loss on OPEC+ Supply Rumors," April 25, 2025 (oilprice.com)
Technical Analysis Section:
The monthly chart shows similarities between the 1999–2002 and 2020–2025 periods: an initial impulse, followed by a correction, and then a 6-year upward trend.
Nearest entry point targets at the 161.8% Fibonacci level:
• $52,46
• $49,06
• $46,50
Growth Potential
Medium-term:
• $138,00
Long-term:
• $500,00
Once the price of oil UKOIL reaches $52.46, a review for the entry point will be prepared.
Charts:
•
•

Analysis of the BRENT chart with expectations for 2025-2026◽️Technically, all conditions for the completion of the second wave correction have been met, and now quotes can be safely reversed up. However, current events in the global economy do not yet provide grounds for confidently asserting this. Locally, the price may still be driven down to $50 per barrel and even slightly lower. One way or another, it is important to understand a simple thing: everything below $70 per barrel should be seen as an opportunity to buy oil and everything related to it cheaply.
◽️According to my estimates, there is probably still time for deliberation on purchases until the end of spring. But further, from the beginning of summer, I expect a sharp rise in prices amid the escalation in the Middle East. From above, in the $100-150 range, growth will likely be contained for some time, which will be interpreted as the formation of sub-waves (i)-(ii), where after sharp rise in the first sub-wave from approximately $50-60 to $120-130, a local correction will follow within the second sub-wave.
◽️The growth period may take 3-6 months, and the correction to it another 2-4 quarters, and then a breakout of the $120-150 resistance zone and further "to the moon" in the third waves is expected.
🙏 Thank you for your attention and 🚀 for the idea.
☘️ Good luck, take care!
📟 See you later.

#BRENT Gold/Oil Ratio, Stocks/Oil RatioOn chart I tried to fit three instruments at once:
1️⃣ Bottom (white) chart: Gold to Oil Ratio.
2️⃣ Middle (red) chart: BRENT crude oil price.
3️⃣ Top (blue) chart: Dow Jones Industrial Average to Oil Price Ratio.
1️⃣ The first thing to pay attention to is the white chart: GOLD/OIL Ratio , specifically where this ratio is today. Over the last 75 years of observation, the ratio has reached unprecedented levels. The spread is once again testing the record values of the COVID-19 hysteria of 2020, when panic caused oil prices to plummet sharply. At the current moment, the ⚖️Gold to Oil Ratio is around the 50 mark, meaning that one ounce of gold can buy as much as 50 barrels of oil. Over the last century, when the spread exceeded 25 barrels per ounce, it was interpreted as a moment of cheap oil relative to gold. Today, against the backdrop of the chaos reigning in the world, the GOLD/OIL Ratio is entering what can be called the " MAGA Mega Cheap Oil Zone" if it is again valued in gold, and not in fiat green piece of paper. Further, we should expect at least a return to its average values, and here three scenarios are possible:
1. First Scenario. Let's assume that today's price of $60-70 per barrel of oil is "fair" and this is where it belongs. In this case, gold is currently strongly overvalued, and it's time for a correction from $3300 to the $2500-2800 range.
2. Second Scenario. Everything is fine with gold, and it will continue to rise without correction. In this case, oil is severely undervalued relative to gold, and it's time for it to catch up so that the spread of 50 returns to its average values in the 10-25 range.
3. Third Scenario suggests that both oil is significantly undervalued and gold has risen too sharply, and now it's time for a correction in gold and a rise in oil prices.
In any of the three scenarios described above, the GOLD/OIL Ratio will sooner or later return to its normal values of the last century, that is, to the range of 10-25 barrels per ounce of gold. And most likely, we will see the third scenario unfold this year, where against the backdrop of a stock market crash, problems with liquidity in the global financial system, the entry of Western economies into recession, as well as the start of a full-scale war in the Middle East this summer, all of this together will provoke a correction in gold and an explosive growth in oil prices, and consequently, a return of the gold to oil ratio to its historical averages.
2️⃣ On the second (red) linear chart of BRENT crude oil prices , everything looks quite ordinary. If we briefly describe the chart for the last twenty years in simple terms, it's worth saying the following: since 2008, they have been trying in every possible way to keep the oil price below $130 per barrel, and as soon as the price approaches the $120-150 zone, some "invisible hand of the market" throws it down. The first test of this resistance zone occurred during the GFC global financial crisis of 2008, the second test with prolonged trading took place during the Eurozone debt crisis of 2011-2014 (culminating in the Greek default), and the third test was in 2022, as a consequence of the monetary madness of 2020 (global lockdown, unlimited QE, and as a result: a wave of monetary + structural inflation worldwide). One way or another, from the fourth or fifth time, the $120-150 per barrel boundary will be finally broken. And then the price above, like a samurai, "has no destination, only the path," and this path is upwards, "to the moon"🚀
3️⃣ Now it remains to consider the last (blue) chart at the top, the ⚖️Dow Jones Industrial Average to Oil Price Ratio . This chart should be understood as a long-term trend indicator of cycle changes in financial markets. When it rises, it implies a 10 or even 20-year growth cycle in the stock market, and accordingly, corrections in the commodity market. And when it falls, then vice versa, the cycle changes to growth in the commodities market and a correction in the risky stock market, which also lasts one or even two decades. Today, it can be said with certainty that since 2020, the cyclicality has changed, and we are just entering a ten or even twenty-year growth trend in the commodity sector, which portends a change from the "eternally" growing trend in the American stock market to a fall or at least a multi-year sideways movement a la the 1970s.
🙏 Thank you for your attention and 🚀 for the idea.
☘️ Good luck, take care!
📟 See you later.

Brent Crude Price ConsolidatesBrent Crude Price Consolidates
When analysing the Brent crude oil price chart six days ago, we:
→ identified a downward channel marked in red;
→ noted that the median line was acting as resistance;
→ suggested the price could find support at the lower boundary of the channel, reinforced by the psychological $60 per barrel level.
As shown on the XBR/USD chart, since then:
→ the price has indeed rebounded from the lower boundary (as indicated by the arrow), rising from its lowest level in nearly four years;
→ the median line has reaffirmed its role as resistance (highlighted by the marker).
Why Is Oil Consolidating?
From a technical perspective, several indicators suggest the market is consolidating. Notably, both the ADX and ATR indicators are trending downwards, which may be interpreted as a weakening of price momentum and volatility. Additionally, Brent’s price currently hovers around the channel’s median line — a level where supply and demand often reach equilibrium.
From a fundamental standpoint, it’s reasonable to assume that the current price has already factored in the latest developments surrounding the global trade war. However, another round of bold statements from the White House could still trigger a fresh move on the XBR/USD chart.
This article represents the opinion of the Companies operating under the FXOpen brand only. It is not to be construed as an offer, solicitation, or recommendation with respect to products and services provided by the Companies operating under the FXOpen brand, nor is it to be considered financial advice.

OPEC Cuts Oil Demand Forecast While Increasing SupplyOil prices are feeling bearish pressure. OPEC was unable to increase production significantly last year to stabilize prices. High interest rates have kept global economies cool enough. However, starting in May, OPEC will begin unwinding its voluntary production cuts. The timing of this decision is questionable. Tariffs are expected to hit global economies hard, while the Fed is likely to hold rates steady for a few more months. Recession risks in the world’s two largest economies, the U.S. and China are rising.
OPEC has acknowledged this trend by lowering its oil demand forecast for 2025 and 2026 by nearly 10%.
If summarized:
Oil demand is expected to fall 10%, possibly more if the U.S. and/or China enter recession.
Trump is expected to boost U.S. drilling, increasing supply.
OPEC will start to unwind supply cuts, increasing supply.
Brent is likely to remain under bearish pressure throughout the year because of rising supply and falling demand. As long as the current fundamental outlook remains unchanged, upward moves should be viewed as selling opportunities. A downtrend channel has formed since mid-2023, with the lower boundary recently tested. There is now an upward reaction. If this continues toward the 68.25–70.70 zone—previously a demand zone, now a potential supply zone—traders may look for short entry setups, provided this zone holds, with nearby stop-loss levels.

Long Term Brent Outlook, $32 by 2026Weekly Brent has broken a clear barrier and formed a Bull Flag pattern, but the subsequent rally has been weak, not even reaching the breakout level.
The global economy is showing signs of weakening, leading to a reduction in oil demand. Concurrently, Trump's move to lift US production restrictions is boosting oil supply. However, the slight depreciation of the dollar is providing upward pressure on oil prices.
Given these factors, Brent remains relatively weak, and we may see a continued decline in line with Scenario 1, potentially targeting ML by 2026. Further downside is also likely.
Given the current conditions, I consider shorting oil at any reasonable price on lower timeframes.

Another tariff u-turn: Oil overbought on news? President Trump announced a 90-day pause on reciprocal tariffs for countries that have not retaliated, sparking a sharp rally in U.S. markets. The Nasdaq 100 led gains with a 12.2% surge. The U.S. dollar also strengthened against safe-haven currencies such as the Japanese yen and Swiss franc.
Crude oil prices rebounded alongside equities, with oil futures rising more than 4% to trade above $62 per barrel.
However, the strength of the oil rally may be overstated. China, one of the world’s largest oil consumers, was among the first to retaliate against U.S. tariffs. Tensions between Washington and Beijing have worsened, prompting the U.S. to raise tariffs on Chinese goods to 125%.
Adding to the caution, analysts at Goldman Sachs revised down their 2026 average price forecasts for Brent and WTI, citing rising recession risks. The bank now expects Brent to average $58 per barrel and WTI to average $55.

Crude Oil: Volatility and Key Levels in FocusThe Crude Oil (CL1!) chart shows a recent phase of high volatility, with a sharp decline followed by a recovery attempt. After reaching the recent high around 80.77, the price underwent a significant correction, returning to the key support zone between 60.97 and 62.43. This price range represents an important accumulation level, previously tested multiple times in recent months and defended by buyers.
From a technical perspective, the area between 65.27 and 69.00 represents a dynamic resistance zone, whose breakout could pave the way for a recovery towards the critical 73.00 area. However, the recent bearish impulse has pressured lower levels, and a weekly close below 60.97 could indicate a structural trend change, with potential bearish targets around 57.00.
The RSI is currently in an oversold zone, suggesting a potential consolidation phase or a technical rebound attempt. However, selling pressure remains high, and sentiment is negative, partly driven by global economic uncertainties and concerns about oil demand.
From an operational perspective, a move back above 65.27 could indicate a recovery phase, with targets at 69.00 and subsequently 73.00. Conversely, a break below 60.97 would open negative scenarios with a possible extension towards the lower support at 57.00. Investors remain focused on macroeconomic data and OPEC+ decisions, as potential production cuts could trigger a new rally, while an unfavorable macro environment could increase selling pressure.

EUR/USD: What to Expect - Trump vs FED!The EUR/USD has recently shown a recovery phase after reaching the late-September high near 1.1150 last Thursday, initially supported by the weakness of the US dollar following fears of stagflation in the United States, fueled by tariff announcements from President Trump. However, the scenario changed rapidly after the release of Nonfarm Payrolls (NFP) data and Jerome Powell’s speech last Friday. Employment data showed NFP growth in line with expectations, but also an increase in the unemployment rate, signaling a less solid labor market than anticipated. During his speech, Powell expressed concerns about the resilience of the US economy, highlighting the risk of an economic slowdown while at the same time reiterating the focus on inflation, maintaining a cautious approach regarding further monetary easing policies.
From a technical perspective, the chart shows that the area around 1.0980-1.1000 represents a crucial zone to assess the sustainability of the bullish trend. A daily close above this level could trigger a new upward push towards the highs of 1.1100 and subsequently 1.1150, especially if supported by further signs of dollar weakness or positive European economic data. If the EUR/USD fails to hold above 1.1000, we could see a pullback towards the support at 1.0950 and subsequently 1.0900. The critical support area on the chart is identified between 1.0360 and 1.0280, and a break below these levels would indicate a significant change in market sentiment.

"SPOT BRENT CRUDE OIL" Energy Market Heist Plan (Day Trade)🌟Hi! Hola! Ola! Bonjour! Hallo! Marhaba!🌟
Dear Money Makers & Robbers, 🤑 💰💸✈️
Based on 🔥Thief Trading style technical and fundamental analysis🔥, here is our master plan to heist the "SPOT BRENT CRUDE OIL" Energy market. Please adhere to the strategy I've outlined in the chart, which emphasizes long entry. Our aim is the high-risk Red Zone. Risky level, overbought market, consolidation, trend reversal, trap at the level where traders and bearish robbers are stronger. 🏆💸Book Profits Be wealthy and safe trade.💪🏆🎉
Entry 📈 : "The heist is on! Wait for the MA breakout (71.200) then make your move - Bullish profits await!"
however I advise to Place Buy stop orders above the Moving average (or) Place buy limit orders within a 15 or 30 minute timeframe most recent or swing, low or high level.
📌I strongly advise you to set an alert on your chart so you can see when the breakout entry occurs.
Stop Loss 🛑:
Thief SL placed at the recent / nearest low level Using the 30mins timeframe (69.500) swing trade basis.
SL is based on your risk of the trade, lot size and how many multiple orders you have to take.
🏴☠️Target 🎯: 74.000 (or) Escape Before the Target
🧲Scalpers, take note 👀 : only scalp on the Long side. If you have a lot of money, you can go straight away; if not, you can join swing traders and carry out the robbery plan. Use trailing SL to safeguard your money 💰.
🛢️ "SPOT BRENT CRUDE OIL" Energy Market Heist Plan (Day Trade) is currently experiencing a bullishness,., driven by several key factors.
📰🗞️Read the Fundamental, Macro Economics, COT Report, Seasonal Factors, Intermarket Analysis, Inventory and Storage Analysis, Sentimental Outlook, Future trend predict.
Before start the heist plan read it.👉👉👉
📌Keep in mind that these factors can change rapidly, and it's essential to stay up-to-date with market developments and adjust your analysis accordingly.
⚠️Trading Alert : News Releases and Position Management 📰 🗞️ 🚫🚏
As a reminder, news releases can have a significant impact on market prices and volatility. To minimize potential losses and protect your running positions,
we recommend the following:
Avoid taking new trades during news releases
Use trailing stop-loss orders to protect your running positions and lock in profits
💖Supporting our robbery plan 💥Hit the Boost Button💥 will enable us to effortlessly make and steal money 💰💵. Boost the strength of our robbery team. Every day in this market make money with ease by using the Thief Trading Style.🏆💪🤝❤️🎉🚀
I'll see you soon with another heist plan, so stay tuned 🤑🐱👤🤗🤩

Brent Crude Oil INTRADAY key trading level at 74.20Brent Crude Oil maintains a bullish sentiment, aligned with the prevailing uptrend. The recent price action suggests a corrective pullback toward a key support zone.
Key Level: 74.20
This level represents the previous consolidation range and now acts as a crucial support area.
Bullish Scenario: A bounce from 74.20 could see Brent resuming its upward trajectory, targeting 75.80, followed by 76.40 and 77.40 in the longer term.
Bearish Scenario: A break below 74.20 with a daily close under this level would weaken the bullish outlook, potentially leading to further declines toward 73.00 and 72.00.
Conclusion:
Brent Crude Oil remains bullish unless it loses support at 74.20. Traders should monitor this level for either a bounce or a breakdown to confirm the next move.
This communication is for informational purposes only and should not be viewed as any form of recommendation as to a particular course of action or as investment advice. It is not intended as an offer or solicitation for the purchase or sale of any financial instrument or as an official confirmation of any transaction. Opinions, estimates and assumptions expressed herein are made as of the date of this communication and are subject to change without notice. This communication has been prepared based upon information, including market prices, data and other information, believed to be reliable; however, Trade Nation does not warrant its completeness or accuracy. All market prices and market data contained in or attached to this communication are indicative and subject to change without notice.

A major correction in Brent crude oil (UKOIL).A major correction in Brent crude oil (UKOIL).
- This idea is invalidated if the price exceeds $73.755.
On the monthly chart, it shows that we are forming a 50% Fibonacci correction from wave 1, from where we will further expect growth toward the $115 area, and possibly even a new all-time high due to a military conflict in the Middle East.
I’ve marked potential downside targets on the chart at $46.50, $49.06, and $52.46, from where we will look for entry points for long positions lasting 2 years or more.

Brent crude: We maintain our USD 65 to USD 85 range for the yearBrent crude's current momentum has taken prices to a three-week high, with the latest move being supported by a combination of underinvested hedge funds, improved risk sentiment following a softening in the tone regarding tariffs after Trump indicated some nations could receive breaks from "reciprocal" tariffs starting next week on 2 April, and not least, the mentioned secondary tariffs on buyers of Venezuelan crude, which, together with Iran sanctions, may help tighten supply.
Overall, we maintain our USD 65 to USD 85 range for the year, with the near-term upside potential being limited by resistance now seen in a band between USD 73.80, the 0.382 Fibonacci retracement of the January to March selloff, and USD 74.10, a level that provided support on several occasions last month before the eventual break triggered a slump extension to near USD 68.

Will Oil Prices Ignite Amid a Middle East War?The global oil market is critical, with geopolitical tensions in the Middle East potentially leading to significant price fluctuations. Recent military actions by the U.S. against Yemen's Houthi group have contributed to rising oil prices, as Brent crude futures reached $71.21 per barrel and U.S. West Texas Intermediate crude futures hit $67.80 per barrel. Positive economic indicators from China, including increased retail sales, have supported oil prices despite global economic slowdown concerns.
The Middle East remains a focal point for oil price volatility due to its strategic importance in global oil supply. Iran, a major oil producer, could face disruptions if tensions escalate, potentially driving prices higher. However, global spare capacity and demand resilience might cap long-term increases. Historical events like the 2019 Saudi oil facility attacks demonstrate the market's sensitivity to regional instability, with prices spiking by $10 following the incident.
Analysts predict that if the conflict escalates to close the Strait of Hormuz, oil prices could exceed $100 per barrel. Nevertheless, historical data suggests that prices may stabilize within a few months if disruptions prove temporary. The delicate balance between supply shocks and market adjustments underscores the need to closely monitor geopolitical developments and their economic ripple effects.
As global economic uncertainties overshadow geopolitical risks, maintaining market confidence will depend on sustained positive economic data from countries like China. The potential for peace negotiations in Ukraine and changes in U.S. sanctions could also impact oil prices, making this a pivotal moment for global energy markets.

BRENT SELL/SHORTBy utilizing Fibonacci retracement levels, historical patterns, , we can formulate a hypothesis that the market might follow a similar trajectory if bearish sentiment prevails.
