Trade Of The Week Brent Crude ShortJupiter Pendulum was tagged red so we found a short setup at red shade as per Jupiter Pendulum Theory
When the divergence formed and we got our signal candle, we had an entry
Brent

Crude Oil (WTI) Classic Trend-Following Setup 🛢️
Crude Oil nicely reacted to a confluence zone based on a horizontal daily structure support and fib.retracement levels.
The price broke and closed above a resistance line of a bullish flag pattern on 4H.
I believe the market will go higher after a pullback.
Goals will be 79.5 / 80.89
❤️If you have any questions, please, ask me in the comment section.
Please, support my work with like, thank you!❤️

Brent Crude Oil: Potential for a further corrective move higherCurrent price remains below its 40 week moving average (200 days) which indicates that the longer term trend is lower (100 days or more), however, the scope for a further near term (25 to 50) corrective upside rally from the November high - December low remains on the table, provided the key resistance near $85.05 can be overcome for prospective extension move towards the $91.66 (50% retracement from the 52 week high/low); downside risk seen near the $78.3 support.

Financial Wave. CLOur priority scenario in CL remains the same. A fall in price to $72.37 looks most likely. In case of growth above $80, this scenario will be cancelled.

Crude Oil (WTI): Bullish Outlook 🛢️
We have spotted earlier a confirmed breakout of a resistance line of a falling wedge pattern.
The price closed above that on a daily.
I believe that the next goal for buyers will be 81.4
I will expect a bullish continuation to there.
❤️If you have any questions, please, ask me in the comment section.
Please, support my work with like, thank you!❤️

Financial Wave. CLOur preferable scenario in CL is the development of the medium-term downward price movement in wave iii, which can lead prices to the first target level of $72.39. If the price rises above $80, this scenario will change.

Crude Oil (WTI) Time to Recover 🛢️
Hey traders,
I spotted a confirmed bullish breakout of a falling wedge pattern on a daily on WTI Crude Oil.
That indicates that, with a high probability, the market will keep recovering.
I expect a bullish continuation at least to 81.4 resistance.
❤️If you have any questions, please, ask me in the comment section.
Please, support my work with like, thank you!❤️

BRENT CRUDE OIL BULISH PATTERNDemand for crude oil is expected to rise after a cold wave hit USA, which will likely increase the demand for oil distillates, easing of the COVID measures in China and US crude oil inventories coming up less than the analysts have had expected.
British crude oil benchmark, BRENT, had broken the resistance of the triangle pattern, a strong bullish predictor, and the price might reach levels of 87.5 in the next couple of days. In an event of reversal of the trend, the price might reach levels of its previous low of 75.35
RSI and MACD both are confirming the bullish outlook, with MACD histogram above 0 and rising and RSI rising as well and approaching the 50 neutral line.
Risk Disclosure: Trading Foreign Exchange (Forex) and Contracts of Difference (CFD's) carries a high level of risk. By registering and signing up, any client affirms their understanding of their own personal accountability for all transactions performed within their account and recognizes the risks associated with trading on such markets and on such sites. Furthermore, one understands that the company carries zero influence over transactions, markets, and trading signals, therefore, cannot be held liable nor guarantee any profits or losses.

Financial Wave. CLWe continue to stick to our priority scenario in CL and believe that a rise in wave (c) looks the most likely. Price drop below $72.37 jeopardizes this scenario.

OPEC & The West Battling Over Oil Price. Who Wins?OPEC (and non OPEC members) are battling with the West led by the US over oil price. While the West wants oil price to hover around $60/barrel, OPEC and other oil producing countries led by Russia and Saudi Arabia feel no one should dictate the price of their commodity...
With oil price now sitting on important support level, will the price breaks down to go lower OR there will be a reversal to and price start to move high?
Technically, bulls came into the market early last week; drove the price high but bears later joined the market and brought price a little down. Coming week(s), if more bulls came into the market, then oil price will likely go up. Otherwise, if bears are more prominent in the next 1 or 2 weeks, then we might witness more decline in oil price.
N.B
- Let emotions and sentiments work for you
-ALWAYS Use Proper Risk Management In Your Trades

Crude Oil (WTI) Bearish Outlook For Next Week 🛢️
Hey traders,
Even though this week was bullish on Crude Oil,
I still remain bearish biased.
I spotted a falling parallel channel on a daily and the price has nicely respected its upper boundary.
I believe oil will drop next week.
Goal - 71.5
❤️If you have any questions, please, ask me in the comment section.
Please, support my work with like, thank you!❤️

Financial Wave. CLOur preferred scenario in CL is confirmed by the price action. We assumed a decrease in CL in the corrective wave (b). The down move looks complete or nearly complete, with wave (c) up to $79.87 most likely. For our scenario, the critical level is $72.37. A price drop below $72.37 will break our markup and change our view.

CRUDE OIL (WTI) Detailed Technical Outlook 🛢
Multiple time frame analysis on WTI Crude Oil.
Price action & key levels.
Directional bias & thoughts.
❤️Please, support this video with like and comment!❤️

Crude Oil (WTI) Detailed Technical Outlook 🛢️
Key levels & price action.
Directional bias & thoughts.
Your trading plan.
❤️Please, support this video with like and comment!❤️

BR1! - Possible to reach TP96 Bull Up condition :
1) BRENT candlestick has BO Level-2 of Raising Stage (E), next target going to be 96.55 (Level-3)
2) Tricol+ indicator - Banker's sentiment (red) above 75%, still in bullish trend
Support & Resistance:
S : 89.37 (-1.81%)
R : 96.55 (+6.08%)
Remark:
- length of AB=CD=DE=EF
DISCLAIMER:
Analysis above SOLELY for case study purpose, not a PROFESSIONAL ADVISE. This analysis does not provide any trading advise and buy or sell. Trade at your own risk. Trade only after you have acknowledged and accepted the risks involved.

Crude Oil (WTI): Will The Bearish Rally Continue? 🛢️
WTI Crude Oil is trading in a bearish trend since March.
The price broke and closed below a key daily demand zone last week.
The broken structure: 72.6 - 76.5 area, turned into a resistance now.
I believe that the market may drop lower from that.
Next target will be 62.3 - 66.3 area.
❤️If you have any questions, please, ask me in the comment section.
Please, support my work with like, thank you!❤️

Crude trader - closer to a mean reversion rally Having reached the double top target, we see that Crude is now 15% below from its 50 day MA - in the past 2 years we've been as stretched as 17% below this average before we saw solid mean reversion kick in - we are in oversold territory and that offers an elevated risk of short covering
By way of flow, we now see 67% of open positions in crude are now held long by clients, so they see upside - the selling pressure seems to be supported and the buyers are having more of a say.
Is price putting in a ST low? It seems to be the case - while we're yet to see momentum truly shift, it feels like the prospect of a squeeze higher has risen

Financial Wave. CLCL
In past reviews, we showed our priority scenario, the price drop almost led to the $68 level that we indicated as a target. Most likely this goal will be fulfilled by the market. Our scenario allows a pullback, but not above $75.50 - this level cancels the fall scenario. Let's see how the price near $68 will behave.

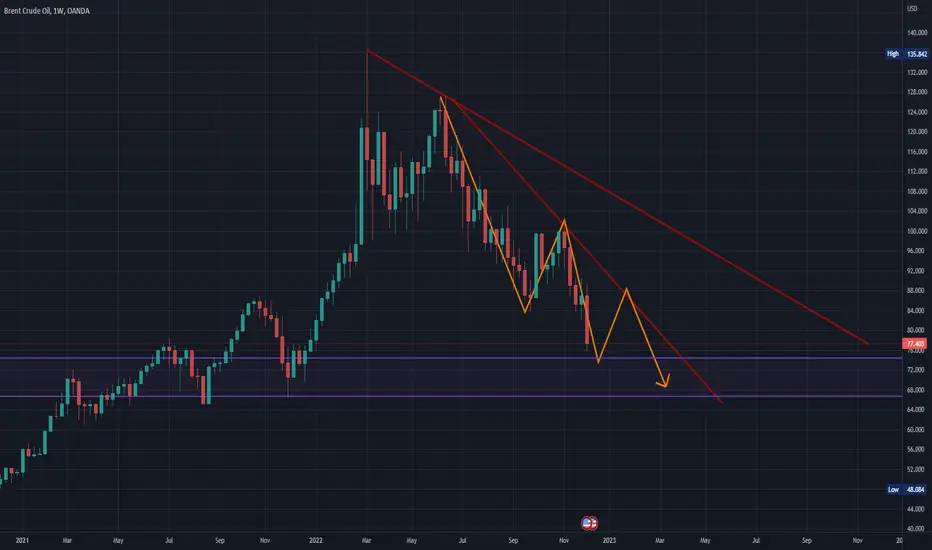
BOCOUSD-Brent OilBrent Oil: I don't think the downtrend is finished; I believe we will see lower prices on Brent Oil. However, I think the price has a correction or pullback to the trend line.
Crude Oil (WTI): Bearish Outlook 🛢️
WTI Crude Oil keeps falling.
The price violated a wide horizontal demand zone on a daily and closed below that.
The broken structure turned into a resistance now.
I believe that the market will go lower from that.
The next goal will be 66.0
Good luck!
❤️If you have any questions, please, ask me in the comment section.
Please, support my work with like, thank you!❤️

Brent: Christmas Miracle ✅🎄We're finally seeing green! After waiting the whole year for Brent to reach the green target zone between $77.10 and $42.16, our British friend finally came through! We're expecting the course to sink a bit further to finish off green wave before heading back North above the $80.79-mark.


China's turmoil, SPRs, and further deterioration in outlookIn our previous update on West Texas Intermediate crude oil, we updated our price target from long-term to medium-term. Additionally, we stated that this price target could soon become short-term, depending on oil market developments. Today, finally, USOIL hit a new yearly low at 73.62$, further confirming our bearish thesis. Accordingly, we continue to maintain our price target at 70$.
Our views are based on a combination of fundamental and technical factors. We expect the global recession to weigh heavily on oil prices in the coming months. In addition to that, we expect the United States to offset any price increases with more releases of Strategic Petroleum Reserves (SPR).
As if it was not enough, turmoil in China also does not support the bullish narrative, putting higher prices at risk. The same applies to OPEC member countries that seek to increase their production despite a slowing economy. Overall, we have no reason to change our bearish outlook.
Illustration 1.01
Illustration 1.01 displays the daily chart of USOIL.
Technical analysis - daily time frame
RSI, MACD, Stochastic, DM+, and DM- are all bearish. Overall, the daily time frame is bearish.
Illustration 1.02
The illustration shows the daily chart of USOIL, simple support/resistance levels, and two moving averages. At the moment, the price appears too far from these moving averages, likely foreshadowing a correction to the upside (as the price deviated too far from its MAs). Now, these MAs act as significant resistance levels.
Technical analysis - weekly time frame
RSI, MACD, Stochastic, DM+, and DM- are all bearish. Overall, the weekly time frame is bearish.
Please feel free to express your ideas and thoughts in the comment section.
DISCLAIMER: This analysis is not intended to encourage any buying or selling of any particular securities. Furthermore, it should not be a basis for taking any trade action by an individual investor. Therefore, your own due diligence is highly advised before entering a trade.
