Here's why oil prices continue to slumpBrent Crude remains under pressure and has really caught our eye. The weakness in recent weeks is significant. The price recently failed to hold above its 200-day moving average, reinforcing downside risks. Without momentum, prices could revisit June lows unless short-term hurdles at US$69 and US$72 are decisively cleared.
This weakness aligns with BP's latest Energy Outlook, which is due out this week (usually in July each year). We'll be keeping a close on global wind and solar capacities, which are projected to increase eightfold and fourteenfold, respectively, by 2050. This rapid growth in renewables, coupled with declining oil demand, suggests a structural shift in energy markets.
China is leading this shift. By 2030, it is projected to install over 500 gigawatts of solar capacity annually, surpassing the United States' total annual energy production. This underscores the scale of China's renewable energy expansion.
The technical rejection at the 200-day moving average, combined with BP's forecasted demand peak, indicates a bearish outlook for oil. Unless Brent can reclaim and sustain levels above key resistance points, further declines are likely.
The convergence of technical weakness and shifting demand dynamics underscores a bearish stance on oil. Traders should monitor key technical levels and remain cautious amid these evolving market conditions.
The forecasts provided herein are intended for informational purposes only and should not be construed as guarantees of future performance. This is an example only to enhance a consumer's understanding of the strategy being described above and is not to be taken as Blueberry Markets providing personal advice.
Brentcrude

Brent Crude Oil Long Swing Setup – Support Break at Key LevelBrent Crude Oil OANDA:BCOUSD has broken to the next key support level after a cease-fire announcement in the Middle East. A long position is considered only if support holds at $69.00.
📌 Trade Setup:
• Entry Zone: $69.00
• Take Profit Targets:
🥇 $73.50 – $76.00
🥈 $79.00 – $83.00
• Stop Loss: Daily close below $67.00
#BrentCrude #OilTrading #ForexTrading #LongPosition #SupportLevel #TradeSetup #CrudeOil #MarketAnalysis #TradingOpportunities #Commodities #OilMarket #Investing #PriceAction #OilPrices #TradingStrategy #ForexCommunity #InvestmentOpportunities #MarketUpdate

Oil Price Falls Below $69Oil Price Falls Below Pre-Escalation Levels of Middle East Conflict
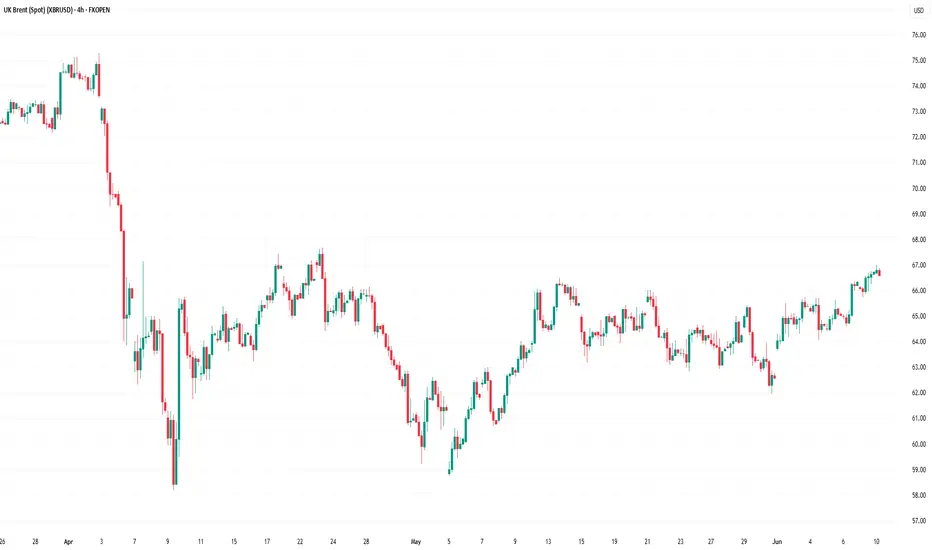
According to the XBR/USD chart:
→ Prior to Israel’s airstrikes on Iran on 13 June, the price of Brent crude was hovering around the $69.00 mark;
→ Following US bombings in Iran, the price spiked at the Monday market open, reaching a high of approximately $77.77 (as we reported on 23 June).
However, after President Trump announced a ceasefire between Iran and Israel — later confirmed by statements from both sides — oil prices dropped sharply. This morning, Brent is trading around $68, which is even lower than the level seen before the initial strikes.
Media outlets report that analysts broadly agree that fears have eased, even if the ceasefire appears fragile. Market participants seem to view the likelihood of the conflict escalating into a full-scale ground war — involving US troops and the closure of the Strait of Hormuz — as low. Shipping through the strait is reportedly returning to normal.
Technical Analysis of the XBR/USD Chart
Interestingly, the $69 level — from which prices surged on 13 June — acted as resistance yesterday (as indicated by the arrow on the chart).
It can be assumed that the longer the ceasefire holds, the less relevant the fears that have served as bullish drivers. In that case, Brent crude prices may continue fluctuating within a downward channel, outlined in red, with the possibility of a short-term rise toward its upper boundary.
Nevertheless, the key drivers for oil prices will remain the fundamental backdrop and official statements regarding the situation in the Middle East and other geopolitical factors.
This article represents the opinion of the Companies operating under the FXOpen brand only. It is not to be construed as an offer, solicitation, or recommendation with respect to products and services provided by the Companies operating under the FXOpen brand, nor is it to be considered financial advice.

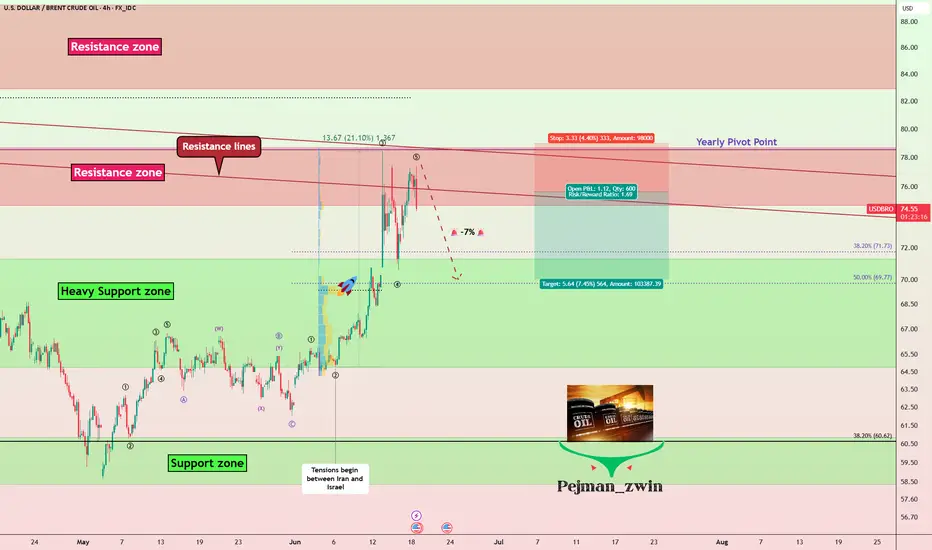
Geopolitics vs. Technical: Will Oil Correct -7%?Oil ( FX_IDC:USDBRO ) rose more than +20% after the start of tensions between Iran and Israel on Friday . I hope this tension ends as soon as possible because tensions have no winners.
The behavior and price movements of oil will certainly depend on the increase or decrease of tensions in the Middle East , but for the coming hours we can have a technical view .
Oil is currently moving in the Resistance zone($78.70-$74.70) and near the Resistance lines and the Yearly Pivot Point .
In terms of Elliott Wave theory , it seems that Oil has completed the second five-impulse waves . So that wave 5 is Truncated .
I expect Oil to decline in the coming hours, this decline could be -7% .
Note: If the USA is added to the Middle East tensions, Oil prices could rise again, so pay more attention to capital management.
Note: Stop Loss: $79.00
Please respect each other's ideas and express them politely if you agree or disagree.
U.S. Dollar/ BRENT CRUDE OIL (USDBRO), 4-hour time frame.
Be sure to follow the updated ideas.
Do not forget to put a Stop loss for your positions (For every position you want to open).
Please follow your strategy and updates; this is just my Idea, and I will gladly see your ideas in this post.
Please do not forget the ✅' like '✅ button 🙏😊 & Share it with your friends; thanks, and Trade safe.
Brent Oil Breakdown – Rejection & Freefall From Channel HighsBrent Oil delivered a textbook reversal last week.
After weeks of climbing within a rising channel, price printed a strong rejection wick at the upper boundary (~$79.45), then followed through with a violent sell-off, slicing through structure and breaking the channel cleanly.
🔍 Key Levels:
• Rejection High: $79.45
• Structure Break: $74.89 (former support, now resistance)
• 4H Demand Zone: $66.00–$69.00
• Daily Demand Confluence: Aligned with 4H zone
On the 1H and 23min, we’re now seeing price trying to stabilise above $69.80 — right on top of the 4H and daily zone confluence.
📉 Bias:
Currently bearish below $74.89.
A clean retest of that level could offer continuation entries.
However, price is now in a high-probability reaction zone, so intraday longs are possible if price shows strength above $70.
⛽ Watch For:
• Bullish price action around $68.50–$70.00
• Weak retracements into $72–$73 for potential short entries
• Break below $66.00 could open floodgates back toward $63 and $60.00

Oil Price Surges at Monday Open Amid US Strikes on IranOil Price Surges at Monday Open Amid US Strikes on Iran
As shown on the XBR/USD chart, the Brent crude oil price formed a bullish gap at the opening of financial markets this Monday, surpassing last week’s high.
Only three days ago, we drew attention to Donald Trump’s statement that a decision regarding US involvement in the Iran-Israel conflict would be made within two weeks – yet over the weekend, US aircraft dropped bombs on Iran’s nuclear facilities.
Now oil prices are likely to be affected by Iran’s potential move to block shipping traffic through the Strait of Hormuz. According to Reuters, analysts suggest that in such a scenario, the oil price could climb to $100.
Technical Analysis of the XBR/USD Chart
The ascending channel plotted last week remains valid.
The fact that the price is pulling back (as indicated by the arrow) from the high set at the market open suggests the market had already priced in a significant risk of US involvement in the Iran-Israel military conflict.
Key points:
→ Technical support in the near term may be provided by the area where the lower boundary of the blue channel intersects with the $76 level (which acted as resistance at the end of last week).
→ Ultimately, fundamental factors and official statements will play a decisive role in oil price movements. It’s worth noting that, following the strikes on its territory, Iran is threatening retaliation against the US.
This article represents the opinion of the Companies operating under the FXOpen brand only. It is not to be construed as an offer, solicitation, or recommendation with respect to products and services provided by the Companies operating under the FXOpen brand, nor is it to be considered financial advice.

XBR/USD Chart Analysis: Oil Price Falls After Trump’s DecisionXBR/USD Chart Analysis: Oil Price Falls After Trump’s Decision
As shown on the XBR/USD chart, the price of Brent crude oil has pulled back from yesterday’s 4.5-month high following a statement from the White House that President Donald Trump will make a decision within the next two weeks on whether the United States will take part in the Israel-Iran conflict.
According to Reuters, the US President is facing backlash from some members of his team over the prospect of launching a strike against Iran, which could drag the US into yet another prolonged war.
Technical Analysis of the XBR/USD Chart
From a technical standpoint, Brent crude oil price is developing within an upward channel (marked in blue), though several bearish signals are appearing on the chart:
→ a bearish gap that formed overnight;
→ a false bullish breakout (indicated by an arrow) above the $76.50 level, drawn from the 13 June high;
→ bearish divergence on the RSI indicator;
→ a break of the recent local ascending trendline (marked in orange).
Given the steep angle of the rising blue channel, it is reasonable to assume that bears may attempt to break through its lower boundary, which is currently acting as support. Whether this scenario materialises in the oil market will largely depend on developments in the Middle East.
This article represents the opinion of the Companies operating under the FXOpen brand only. It is not to be construed as an offer, solicitation, or recommendation with respect to products and services provided by the Companies operating under the FXOpen brand, nor is it to be considered financial advice.

Israel Strikes Iran. Oil and Gold Prices SurgeIsrael Strikes Iran. Oil and Gold Prices Surge
According to media reports, Israel launched a large-scale overnight strike on Iranian territory, targeting dozens of military and strategic facilities linked to the country’s nuclear programme and missile capabilities. Israeli officials justified the action by citing an existential threat from Tehran, which, according to their intelligence, is accelerating its development of nuclear weapons and expanding its arsenal of ballistic missiles.
In response, Iran has vowed severe retaliation, stating that the United States and Israel will “pay a heavy price” for the attack. US President Donald Trump has urgently convened a meeting to assess the situation.
Commodities Market Reaction
In the wake of these developments, gold — the primary safe-haven asset — surged sharply. The XAU/USD price broke above its May high, rising past $3,440. However, the all-time high near $3,498 remains intact for now.
Oil prices also spiked due to fears of supply disruption. The military conflict threatens shipping through the Strait of Hormuz, a crucial chokepoint through which one-fifth of the world’s oil supply passes. Traders quickly priced in the risk of war, anticipating a supply shortage driven by large-scale instability in the Middle East.
Technical Analysis of the XBR/USD Chart
Brent crude oil price has risen to the upper boundary of a large-scale descending channel (shown in red), which is defined by lower highs from 2024–2025. As anticipated, this upper boundary acted as resistance, with the price forming a peak above $76 before reversing downward (as illustrated by the black arrow).
From a technical standpoint, following such a sharp rally, Brent is vulnerable to a corrective move. In this scenario, a pullback into the orange zone is possible, where support may be found at:
→ The psychologically important $70 level;
→ The 50% Fibonacci retracement level;
→ The former resistance of the purple descending trendline, now turned support.
Nevertheless, given the scale of the geopolitical threat, it is unlikely that market sentiment will allow Brent to decline significantly in the near term.
This article represents the opinion of the Companies operating under the FXOpen brand only. It is not to be construed as an offer, solicitation, or recommendation with respect to products and services provided by the Companies operating under the FXOpen brand, nor is it to be considered financial advice.

XBR/USD Chart Analysis: Brent Crude Reaches 1.5-Month HighXBR/USD Chart Analysis: Brent Crude Reaches 1.5-Month High
In our analysis of Brent crude oil six days ago, we identified a large contracting triangle and a local ascending channel. We also outlined a potential scenario involving a bullish breakout above the upper boundary of the triangle.
Although this was not the base-case scenario, the XBR/USD chart now suggests it has played out: yesterday, the price climbed to nearly $67 per barrel — its highest level since the end of April.
The main bullish catalyst appears to be ongoing trade talks between the United States and China, which have raised hopes of a resolution to tariff-related tensions between the world’s two largest economies.
At the same time, rising oil prices may exacerbate geopolitical tensions, particularly amid Israeli threats to strike ports in Yemen — a risk that could disrupt supply chains across the Middle East.
Technical Analysis of the XBR/USD Chart
From a technical perspective:
→ Brent crude continues to move within an ascending channel (marked in blue);
→ the upper boundary may now act as a support level.
The fact that the price is holding in the upper half of the channel indicates strong demand-side pressure. Based on this, it is reasonable to assume that as long as Brent remains above the $65.75 level (the retest zone of the breakout), the technical outlook will remain predominantly bullish.
This article represents the opinion of the Companies operating under the FXOpen brand only. It is not to be construed as an offer, solicitation, or recommendation with respect to products and services provided by the Companies operating under the FXOpen brand, nor is it to be considered financial advice.
XBR/USD Chart Analysis: Oil Price Rises to Key ResistanceXBR/USD Chart Analysis: Oil Price Rises to Key Resistance
Yesterday, the price of Brent crude climbed above $65.60 — the highest level in over a week.
According to media reports, several bullish factors are driving this move:
→ Stalled negotiations between the US and Iran over abandoning Iran’s nuclear programme in exchange for lifting oil export sanctions;
→ Wildfires in Canada, which have significantly reduced oil output;
→ Market reaction to the OPEC+ meeting held over the weekend;
→ A weakening US dollar.
Technical Analysis of the XBR/USD Chart
From a technical standpoint, Brent crude oil:
→ Has been forming a short-term ascending channel (marked in blue) since the beginning of the week;
→ Has approached a major resistance level.
This resistance is defined by the upper boundary of a narrowing triangle, with its central axis around the $63.70 level — a price that could be considered a fair value based on trading over the past one and a half months.
This situation points to two possible scenarios:
→ A downward reversal from the key resistance, with expectations that the price will return to the triangle’s central axis. A break below the lower boundary of the local blue channel would support this scenario.
→ An attempt at a bullish breakout of the triangle. While this scenario cannot be ruled out, it appears less likely due to the global economic slowdown risks posed by tariff-related trade barriers.
This article represents the opinion of the Companies operating under the FXOpen brand only. It is not to be construed as an offer, solicitation, or recommendation with respect to products and services provided by the Companies operating under the FXOpen brand, nor is it to be considered financial advice.

Oil Prices Surge Amid Threat of Strike on IranOil Prices Surge Amid Threat of Strike on Iran
As shown on today’s XBR/USD chart, Brent crude oil prices have jumped (as indicated by the arrow) to a one-week high. This surge follows U.S. intelligence reports suggesting that Israel may be preparing to strike Iran’s nuclear facilities.
Although CNN, citing officials, noted that it remains unclear whether Israeli leaders have made a final decision, oil prices are rising as markets price in the risk of escalation disrupting Middle Eastern oil supply chains:
→ Iran is the third-largest oil producer within OPEC.
→ There is concern that Iran could retaliate by blocking the Strait of Hormuz in the Persian Gulf — a key shipping route used by Saudi Arabia, Kuwait, and others to export oil products.
Technical Analysis of XBR/USD
Brent crude oil price has climbed towards the descending trendline (marked in black), drawn through key highs from April and mid-May. From a bearish perspective, this key resistance could trigger a downward pullback.
On the other hand, recent price action in Brent suggests upward momentum (indicated by blue lines), with the $65.20 level — previously a cap — potentially turning into support after a breakout.
Whether the black resistance line is broken will largely depend on geopolitical developments. It is possible that reports of an imminent missile strike on Iran may later be refuted.
This article represents the opinion of the Companies operating under the FXOpen brand only. It is not to be construed as an offer, solicitation, or recommendation with respect to products and services provided by the Companies operating under the FXOpen brand, nor is it to be considered financial advice.

BRENT Crude INTRADAY oversold bounce capped at 6533The price sentiment for Brent Crude Oil remains bearish, in line with the prevailing downtrend. Recent price action shows an oversold rally, which has stalled near a previous consolidation zone around 6533 — a key resistance level.
Key Resistance Level: 6533
This level marks a previous intraday consolidation area and could act as a ceiling for the current rally.
Bearish Scenario:
If WTI fails to break above 6533, it may resume its decline toward:
6207 (near-term support)
6080
5885 (longer-term support)
Bullish Scenario:
A confirmed breakout and daily close above 6533 would shift momentum and open upside targets at:
6707
6860
7040
Conclusion:
WTI Crude Oil remains under bearish pressure unless it breaks and closes above 6533. Traders should monitor this level closely for signs of rejection or breakout.
This communication is for informational purposes only and should not be viewed as any form of recommendation as to a particular course of action or as investment advice. It is not intended as an offer or solicitation for the purchase or sale of any financial instrument or as an official confirmation of any transaction. Opinions, estimates and assumptions expressed herein are made as of the date of this communication and are subject to change without notice. This communication has been prepared based upon information, including market prices, data and other information, believed to be reliable; however, Trade Nation does not warrant its completeness or accuracy. All market prices and market data contained in or attached to this communication are indicative and subject to change without notice.

Brent Crude Opens with a Bearish GapBrent Crude Opens with a Bearish Gap
As shown on the XBR/USD chart, Brent crude oil opened this Monday morning around $59.00, forming a bearish gap relative to Friday’s closing price of approximately $61.40.
The current Brent crude oil price is near the yearly low reached about a month ago, following the announcement of Trump’s tariffs, which turned out to be significantly higher than expected.
Why Is Oil Falling?
As we noted on 30 April, market participants are closely watching news related to OPEC+. Over the weekend, during an online meeting (according to media reports), the following developments occurred:
→ It was stated that the current oil market is fundamentally healthy;
→ A decision was made to accelerate the pace of oil production increases.
According to the plan, output will rise by 411,000 barrels per day — with some believing this move is partly due to certain OPEC+ countries previously failing to adhere to production quotas.
Technical Analysis of the XBR/USD Chart
Oil price movements in 2025 form a descending channel (shown in red), with progressively lower highs and lows indicating bearish sentiment.
Although bulls may hope that the lower boundary of the channel could act as support, bears are showing signs of dominance (as indicated by arrows):
→ the median line of the channel previously acted as resistance;
→ now, similar behaviour is seen at line Q, which divides the lower half of the channel into two quarters;
→ the Rounding Top pattern also signals strong selling pressure.
Fundamentally, oil prices are supported by China’s willingness to negotiate tariffs with the US. However, considering the OPEC+ decision and ongoing fears of a global recession, the current downward channel on the Brent crude oil price chart is unlikely to lose relevance any time soon.
This article represents the opinion of the Companies operating under the FXOpen brand only. It is not to be construed as an offer, solicitation, or recommendation with respect to products and services provided by the Companies operating under the FXOpen brand, nor is it to be considered financial advice.

Brent Crude Oil oversold bounce capped at 7110Brent Crude Oil is showing bearish sentiment, in line with the current downtrend. Recent price action to be an oversold bounce back towards a key consolidation zone, adding pressure to the downside.
Key Levels:
Resistance: 7110 (current swing low, now resistance), 7240, 7390
Support: 6583, 6500, 6400
Bearish Outlook:
Price has broken below 7110, which was a key intraday consolidation level. If Brent Crude sees a short-term bounce but fails to break above 7110, it could resume its downward move toward 6583, then 6500, and possibly 6400 over time.
Bullish Scenario:
If Brent Crude breaks above 7110 and closes above it on the daily chart, the bearish setup would be invalidated. This could open the door for a rally toward 7240, then 7400.
Conclusion:
The trend remains bearish below 7110. A rejection at this level would reinforce the downside bias. However, a confirmed break and daily close above 7110 would shift the outlook to bullish in the short term.
This communication is for informational purposes only and should not be viewed as any form of recommendation as to a particular course of action or as investment advice. It is not intended as an offer or solicitation for the purchase or sale of any financial instrument or as an official confirmation of any transaction. Opinions, estimates and assumptions expressed herein are made as of the date of this communication and are subject to change without notice. This communication has been prepared based upon information, including market prices, data and other information, believed to be reliable; however, Trade Nation does not warrant its completeness or accuracy. All market prices and market data contained in or attached to this communication are indicative and subject to change without notice.

Brent Crude INTRADAY oversold bounce capped at 6620Brent Crude Oil selling pressure continuation
Brent Crude Oil is showing bearish sentiment, in line with the current downtrend. Recent price action confirms a break below a key consolidation zone, adding pressure to the downside.
Key Levels:
Resistance: 6620 (current swing high, now resistance), 6774, 6900
Support: 6230, 5870, 5480
Bearish Outlook:
Price has broken below 6900, which was a key intraday consolidation level. If Brent Crude sees a short-term bounce but fails to break above 6620, it could resume its downward move toward 6230, then 5870, and possibly 5480 over time.
Bullish Scenario:
If Brent Crude breaks above 6620 and closes above it on the daily chart, the bearish setup would be invalidated. This could open the door for a rally toward 6770, then 6900.
Conclusion:
The trend remains bearish below 6620. A rejection at this level would reinforce the downside bias. However, a confirmed break and daily close above 6620 would shift the outlook to bullish in the short term.
This communication is for informational purposes only and should not be viewed as any form of recommendation as to a particular course of action or as investment advice. It is not intended as an offer or solicitation for the purchase or sale of any financial instrument or as an official confirmation of any transaction. Opinions, estimates and assumptions expressed herein are made as of the date of this communication and are subject to change without notice. This communication has been prepared based upon information, including market prices, data and other information, believed to be reliable; however, Trade Nation does not warrant its completeness or accuracy. All market prices and market data contained in or attached to this communication are indicative and subject to change without notice.

Brent Crude Price ConsolidatesBrent Crude Price Consolidates
When analysing the Brent crude oil price chart six days ago, we:
→ identified a downward channel marked in red;
→ noted that the median line was acting as resistance;
→ suggested the price could find support at the lower boundary of the channel, reinforced by the psychological $60 per barrel level.
As shown on the XBR/USD chart, since then:
→ the price has indeed rebounded from the lower boundary (as indicated by the arrow), rising from its lowest level in nearly four years;
→ the median line has reaffirmed its role as resistance (highlighted by the marker).
Why Is Oil Consolidating?
From a technical perspective, several indicators suggest the market is consolidating. Notably, both the ADX and ATR indicators are trending downwards, which may be interpreted as a weakening of price momentum and volatility. Additionally, Brent’s price currently hovers around the channel’s median line — a level where supply and demand often reach equilibrium.
From a fundamental standpoint, it’s reasonable to assume that the current price has already factored in the latest developments surrounding the global trade war. However, another round of bold statements from the White House could still trigger a fresh move on the XBR/USD chart.
This article represents the opinion of the Companies operating under the FXOpen brand only. It is not to be construed as an offer, solicitation, or recommendation with respect to products and services provided by the Companies operating under the FXOpen brand, nor is it to be considered financial advice.

"UK oil / Brent" Energy Market Heist Plan (Scalping/Day)🌟Hi! Hola! Ola! Bonjour! Hallo! Marhaba!🌟
Dear Money Makers & Robbers, 🤑 💰💸✈️
Based on 🔥Thief Trading style technical and fundamental analysis🔥, here is our master plan to heist the "UK oil / Brent" Energy Market. Please adhere to the strategy I've outlined in the chart, which emphasizes long entry. Our aim is to escape near the high-risk ATR Zone. Risky level, overbought market, consolidation, trend reversal, trap at the level where traders and bearish robbers are stronger. 🏆💸"Take profit and treat yourself, traders. You deserve it!💪🏆🎉
Entry 📈 : "The heist is on! Wait for the MA breakout (65.500) then make your move - Bullish profits await!"
however I advise to Place Buy stop orders above the Moving average (or) Place buy limit orders within a 15 or 30 minute timeframe most recent or swing, low or high level for pullback entries.
📌I strongly advise you to set an "alert (Alarm)" on your chart so you can see when the breakout entry occurs.
Stop Loss 🛑: "🔊 Yo, listen up! 🗣️ If you're lookin' to get in on a buy stop order, don't even think about settin' that stop loss till after the breakout 🚀. You feel me? Now, if you're smart, you'll place that stop loss where I told you to 📍, but if you're a rebel, you can put it wherever you like 🤪 - just don't say I didn't warn you ⚠️. You're playin' with fire 🔥, and it's your risk, not mine 👊."
📍 Thief SL placed at the recent/swing low level Using the 1H timeframe (61.500) Scalping/Day trade basis.
📍 SL is based on your risk of the trade, lot size and how many multiple orders you have to take.
🏴☠️Target 🎯: 70.000 (or) Escape Before the Target
🧲Scalpers, take note 👀 : only scalp on the Long side. If you have a lot of money, you can go straight away; if not, you can join swing traders and carry out the robbery plan. Use trailing SL to safeguard your money 💰.
💰💵💸🛢"UK oil / Brent" Energy Market Heist Plan (Scalping/Day) is currently experiencing a bullishness,., driven by several key factors. 👇👇👇
📰🗞️Get & Read the Fundamental, Macro Economics, COT Report, Inventory and Storage Analysis, Seasonal Factors, Sentimental Outlook, Intermarket Analysis, Future trend targets & Overall Score... go ahead to check 👉👉👉🔗🔗
⚠️Trading Alert : News Releases and Position Management 📰 🗞️ 🚫🚏
As a reminder, news releases can have a significant impact on market prices and volatility. To minimize potential losses and protect your running positions,
we recommend the following:
Avoid taking new trades during news releases
Use trailing stop-loss orders to protect your running positions and lock in profits
💖Supporting our robbery plan 💥Hit the Boost Button💥 will enable us to effortlessly make and steal money 💰💵. Boost the strength of our robbery team. Every day in this market make money with ease by using the Thief Trading Style.🏆💪🤝❤️🎉🚀
I'll see you soon with another heist plan, so stay tuned 🤑🐱👤🤗🤩

Brent Crude Oil downtrend continuation below 6350Brent Crude Oil selling pressure continuation
Brent Crude Oil is showing bearish sentiment, in line with the current downtrend. Recent price action confirms a break below a key consolidation zone, adding pressure to the downside.
Key Levels:
Resistance: 6350 (former support, now resistance), 6622, 6774
Support: 5762, 5505, 5040
Bearish Outlook:
Price has broken below 6350, which was a key intraday consolidation level. If WTI sees a short-term bounce but fails to break above 6350, it could resume its downward move toward 5760, then 5505, and possibly 5040 over time.
Bullish Scenario:
If Brent Crude breaks above 6350 and closes above it on the daily chart, the bearish setup would be invalidated. This could open the door for a rally toward 6620, then 6770.
Conclusion:
The trend remains bearish below 6350. A rejection at this level would reinforce the downside bias. However, a confirmed break and daily close above 6350 would shift the outlook to bullish in the short term.
This communication is for informational purposes only and should not be viewed as any form of recommendation as to a particular course of action or as investment advice. It is not intended as an offer or solicitation for the purchase or sale of any financial instrument or as an official confirmation of any transaction. Opinions, estimates and assumptions expressed herein are made as of the date of this communication and are subject to change without notice. This communication has been prepared based upon information, including market prices, data and other information, believed to be reliable; however, Trade Nation does not warrant its completeness or accuracy. All market prices and market data contained in or attached to this communication are indicative and subject to change without notice.

Brent Crude Price Continues to FallBrent Crude Price Continues to Fall
Today, the price of Brent crude has dropped below $60 per barrel, marking its lowest level since March 2021. As shown on the XBR/USD chart, from the start of 2025, the price saw a rise of around 2.6% at the end of March 2025.
Why is oil falling?
The key driver is the escalation of the trade war. Yesterday, the US President announced the imposition of additional tariffs on trade with China, bringing the total to 104%.
The decline in Brent prices seems to reflect traders' concerns about the risks of a global recession.
Oil price forecasts for 2025 and 2026
Yesterday, analysts at Goldman Sachs released their oil price forecasts for Brent and WTI crude. They expect prices to reach $62 per barrel for Brent and $58 for WTI by December 2025. By December 2026, they anticipate a further decline to $55 and $51, respectively. However, analysts caveat that these forecasts are based on the assumption that the US will avoid a recession and that OPEC+ countries will increase their supplies.
In the event of a global economic slowdown, Brent prices could drop to $40 by the end of 2026.
Technical analysis of the XBR/USD chart today
The sharp decline in Brent prices has resulted in a forceful breach of key lows from 2024 and 2025 around the $68.68 level.
Additionally, the XBR/USD chart shows that the price continues to follow a downward channel (indicated in red), with the following levels acting as resistance (marked by arrows):
→ The upper boundary of the channel;
→ Its median (previously acting as support) – indicating the dominance of supply forces.
It is possible that the lower boundary of the channel, strengthened by the psychological level of $60.00, will provide support, slowing the bearish progress of Brent prices. However, the key factor will undoubtedly be the news flow, with sharp statements from the White House.
Traders are focusing on how China will react to the 104% tariffs announced by Donald Trump. As Reuters reports, the President stated yesterday, "We have many countries coming to us wanting to make deals," adding that he expects China to also seek an agreement.
This article represents the opinion of the Companies operating under the FXOpen brand only. It is not to be construed as an offer, solicitation, or recommendation with respect to products and services provided by the Companies operating under the FXOpen brand, nor is it to be considered financial advice.

"SPOT BRENT CRUDE OIL" Energy Market Heist Plan (Day Trade)🌟Hi! Hola! Ola! Bonjour! Hallo! Marhaba!🌟
Dear Money Makers & Robbers, 🤑 💰💸✈️
Based on 🔥Thief Trading style technical and fundamental analysis🔥, here is our master plan to heist the "SPOT BRENT CRUDE OIL" Energy market. Please adhere to the strategy I've outlined in the chart, which emphasizes long entry. Our aim is the high-risk Red Zone. Risky level, overbought market, consolidation, trend reversal, trap at the level where traders and bearish robbers are stronger. 🏆💸Book Profits Be wealthy and safe trade.💪🏆🎉
Entry 📈 : "The heist is on! Wait for the MA breakout (71.200) then make your move - Bullish profits await!"
however I advise to Place Buy stop orders above the Moving average (or) Place buy limit orders within a 15 or 30 minute timeframe most recent or swing, low or high level.
📌I strongly advise you to set an alert on your chart so you can see when the breakout entry occurs.
Stop Loss 🛑:
Thief SL placed at the recent / nearest low level Using the 30mins timeframe (69.500) swing trade basis.
SL is based on your risk of the trade, lot size and how many multiple orders you have to take.
🏴☠️Target 🎯: 74.000 (or) Escape Before the Target
🧲Scalpers, take note 👀 : only scalp on the Long side. If you have a lot of money, you can go straight away; if not, you can join swing traders and carry out the robbery plan. Use trailing SL to safeguard your money 💰.
🛢️ "SPOT BRENT CRUDE OIL" Energy Market Heist Plan (Day Trade) is currently experiencing a bullishness,., driven by several key factors.
📰🗞️Read the Fundamental, Macro Economics, COT Report, Seasonal Factors, Intermarket Analysis, Inventory and Storage Analysis, Sentimental Outlook, Future trend predict.
Before start the heist plan read it.👉👉👉
📌Keep in mind that these factors can change rapidly, and it's essential to stay up-to-date with market developments and adjust your analysis accordingly.
⚠️Trading Alert : News Releases and Position Management 📰 🗞️ 🚫🚏
As a reminder, news releases can have a significant impact on market prices and volatility. To minimize potential losses and protect your running positions,
we recommend the following:
Avoid taking new trades during news releases
Use trailing stop-loss orders to protect your running positions and lock in profits
💖Supporting our robbery plan 💥Hit the Boost Button💥 will enable us to effortlessly make and steal money 💰💵. Boost the strength of our robbery team. Every day in this market make money with ease by using the Thief Trading Style.🏆💪🤝❤️🎉🚀
I'll see you soon with another heist plan, so stay tuned 🤑🐱👤🤗🤩

Brent Crude Oil INTRADAY key trading level at 74.20Brent Crude Oil maintains a bullish sentiment, aligned with the prevailing uptrend. The recent price action suggests a corrective pullback toward a key support zone.
Key Level: 74.20
This level represents the previous consolidation range and now acts as a crucial support area.
Bullish Scenario: A bounce from 74.20 could see Brent resuming its upward trajectory, targeting 75.80, followed by 76.40 and 77.40 in the longer term.
Bearish Scenario: A break below 74.20 with a daily close under this level would weaken the bullish outlook, potentially leading to further declines toward 73.00 and 72.00.
Conclusion:
Brent Crude Oil remains bullish unless it loses support at 74.20. Traders should monitor this level for either a bounce or a breakdown to confirm the next move.
This communication is for informational purposes only and should not be viewed as any form of recommendation as to a particular course of action or as investment advice. It is not intended as an offer or solicitation for the purchase or sale of any financial instrument or as an official confirmation of any transaction. Opinions, estimates and assumptions expressed herein are made as of the date of this communication and are subject to change without notice. This communication has been prepared based upon information, including market prices, data and other information, believed to be reliable; however, Trade Nation does not warrant its completeness or accuracy. All market prices and market data contained in or attached to this communication are indicative and subject to change without notice.

Brent Crude Oil Price Rises Above $71Brent Crude Oil Price Rises Above $71
Brent crude oil is trading above $71 per barrel today, marking its highest level since late February. As shown on the XBR/USD chart, the price surged by approximately 2.6% on the last day of March.
Why Has Oil Risen?
Bullish sentiment in the market is driven by the US President’s stance on Russia and Iran. According to Trading Economics:
➝ Trump has vowed to impose tariffs of 25–50% on buyers of Russian oil if he believes Moscow is obstructing his efforts to end the war in Ukraine. This could put pressure on key importers such as India and China.
➝ He has also threatened Iran with further tariffs and airstrikes until the country agrees to abandon its nuclear weapons programme.
The rise in Brent crude prices appears to reflect traders’ concerns over potential disruptions to global oil supply chains.
Technical Analysis of XBR/USD
In early March, oil formed a bullish Double Bottom pattern (see the lows on 5 and 11 March), followed by an upward trend within a rising channel (marked in blue).
Notably, the XBR/USD chart shows that the price:
➝ Has moved into the upper half of the channel.
➝ Broke through key resistance at around $70.25, a level that previously acted as support multiple times (as indicated by the arrows).
As a result, the median of the channel, reinforced by the $70.25 level, may now serve as support, keeping Brent crude within the blue channel. However, market direction will likely depend on the news cycle, particularly sharp statements from the White House.
This article represents the opinion of the Companies operating under the FXOpen brand only. It is not to be construed as an offer, solicitation, or recommendation with respect to products and services provided by the Companies operating under the FXOpen brand, nor is it to be considered financial advice.

Brent Crude INTRADAY oversold bounce back The Brent Crude Oil price action remains bearish, in line with the prevailing downtrend. The recent move suggests an oversold bounce, but overall sentiment remains weak unless a significant breakout occurs.
Key Levels to Watch:
Resistance Levels: 74.25 (critical level), 74.90, 75.90
Support Levels: 71.70, 70.70, 69.13
Bearish Scenario:
A rejection from the 74.25 resistance level could confirm the bearish outlook, leading to further downside movement toward 71.70, with extended losses targeting 70.70 and 69.13 in the longer timeframe.
Bullish Scenario:
A breakout above 74.25 with a daily close above this level would challenge the bearish sentiment, opening the door for further gains toward 74.90, followed by 75.90.
Conclusion:
The market sentiment remains bearish, with the 74.25 level acting as a key resistance zone. A rejection from this level could reinforce the downside trend, while a confirmed breakout would shift the outlook to bullish, favoring further upside. Traders should closely monitor price action at this critical level for confirmation.
This communication is for informational purposes only and should not be viewed as any form of recommendation as to a particular course of action or as investment advice. It is not intended as an offer or solicitation for the purchase or sale of any financial instrument or as an official confirmation of any transaction. Opinions, estimates and assumptions expressed herein are made as of the date of this communication and are subject to change without notice. This communication has been prepared based upon information, including market prices, data and other information, believed to be reliable; however, Trade Nation does not warrant its completeness or accuracy. All market prices and market data contained in or attached to this communication are indicative and subject to change without notice.
