Brent Crude OilBrent crude oil had quite the month in July, climbing from $74 per barrel all the way up to $85. This price jump came from Russia cutting back on exports to Saudi Arabia, trimming all their oil production. Still, I don't think the price is going to burst out of its range of $72 - $88 per barrel yet.
What's interesting is the strengthening of "crack spreads"
Now you may be wondering what "crack spread" is. It's basically the difference between the buying cost of crude oil and the selling price of the final products, such as gasoline and diesel. There has been a significant increase in the crack spread for RBOB gasoline due to a production mismatch with the total demand and exports.
Although there was a decrease in demand in July, the low inventories of gasoline at a five-year low and diesel at a multi-decade rock-bottom level have helped maintain prices for refined products. Add to this mix a hike in jet fuel demand, mostly driven by China's international travel sector.
There's more. Due to the hot summer heat reducing shipping capacity along the Rhine River, European refineries might need to cut back production. This could prompt the U.S. to ramp up the export of key industrial fuels.
The Rhine River in Europe, vital for transporting fuel & goods, is running into some trouble. Water levels in a part of the river (Kaub chokepoint) are the lowest they've been in 30 years. That's not good because if the water's too low, the big boats (barges) can't get through.
Low water levels halted the barges last summer & may happen again without adequate rainfall. This impacts the delivery of critical goods (heating oil fuel)
Barges moving heating oil fuel from Rotterdam saw their cargo loads nearly cut in half from 2000 to 1200 tons within a week. Less water and harder access mean using barges is getting more expensive.
So a river that's too dry for boats to pass through properly could cause many problems with getting goods around Europe & might even make things more expensive. The inflation battle isn't over in Europe.
Now for those keeping an eye on inflation. As gasoline prices rise in tandem with crude oil, it inevitably drives up the price of pretty much everything. Diesel demand reflects the overall economy's well-being but has fluctuated throughout this year.
If there continues to be poor economic data from the US, China, and the EU, we could very well be starring down the barrel of a recession (pun intended ).
This is why limit the current price ceiling to the high $80s for crude oil.
The strength of crude has reached the upper limit of our forecast range and is still within the range of $72 to $87.
If it breaches $88, it may reach $95 and have a greater impact on refined products. However, concerns about a recession will likely keep a limit on the price for now.
The long-term impact of refinery shutdowns over the past 3 years and the current state of inventories is worth noting. If a recession hits and refinery runs dip, rebuilding inventories will be a severe challenge unless demand drops off a cliff.
There's a catch-22; central banks are trying to cause that drop by hiking interest rates. The downside is that these higher rates can deter drilling and exploration for new oil and gas, further compounding the problem down the line.
This is a vicious cycle. Destroying your economy to tackle inflation is like cutting off your arm because a paper cut is not something I would recommend.
I expect Brent will trade between $72 and $88 per barrel until Q4. After that, don't be surprised if it creeps close to the $90 mark.
As outlined in my blog I published on August 5th 2023
Brentcrude

SasolJSE:SOL has tested this MA several times and failed to remain above it. The stock is back above this level, but there's a bit of an overhead resistance. Taking TVC:UKOIL into consideration, a long position is worth a punt.

Brent Crude just gave my first buy signal since March 2022TECHNICALS:
We’re looking at the daily chart of Brent Crude oil.
We can see since March 2022, the price has indeed tanked from $136 down to $71.
During that time, we can see it’s formed a large Descending Triangle pattern.
This is generally a pattern which also forms what looks like a falling triangle.
The selling is stronger than the buying. And this is what brings the price down.
The $71 price however, is the crucial support (floor level) that’s been holding since 2021.
Each time it touches this level, the price tends to bounce back up.
Recently, the Brent Crude price has broken up and out of the Descending Triangle. This tells me the buyers are back and so is demand for the market.
The first target will be half way between the Descending Triangle’s high at $100.
Once we break that psychological $100 mark, I’ll be sure to send you the next prediction for Brent Crude.
FUNDAMENTALS:
It’s been a long and depressing time for the black gold commodity.
We’ve seen the price drop from $135 down to $71.00, over the last two years.
But now, Brent Crude is stealing the limelight.
With the impending oil shortages to the soaring global demand – the trend is finally changing.
In this article, we’ll go through the three main reasons why I expect Brent
Crude to rally back to its $100 mark.
Reason #1: The big shortage of oil
A key driver of why Brent Crude is ready to rally, is due to the recent prediction by the International Energy Administration (IEA).
They have stated there is an imminent oil shortage.
In fact, the IEA has warned the shortage in oil will materialize in the second half of 2023.
We could see demand potentially outpace supply by around 2 million barrels a day.
Also, Saudi Arabia, who is the world’s biggest crude exporter, has said it will prolong its reduction in oil production by 1 million barrels per day into August 2023.
This extension has followed from their sudden decision to reduce an additional million bpd for July.
Then we have Russia and Algeria who will also lower their August output and export levels by 500,000 bpd and 20,000 bpd.
And so, based on this, we’ve seen oil prices rise by over 5.29%.
This scenario leads me to believe oil prices are likely to climb for the following reasons:
1. Supply Disruption
First, with Saudi Arabia deciding to cut production, they are limiting the amount of oil available in the market.
When there is a lower supply, there is a ride in demand. And this puts upward pressure on oil prices.
2. OPEC Influence on other members
We know Saudi Arabia is a leading member of OPEC (Organization of Petroleum Exporting Countries).
And when they make a decision, this often sways other global oil markets to follow along.
This can result in other OPEC+ members to decide to cut their production.
And this lower supply, and increased demand will help increase the price of oil.
Reason #2: Goldman Sachs makes its prediction
Goldman Sachs has also spoken.
It has lifted its forecast for Brent to $95 a barrel, by the end of the year.
And raised its price prediction to $100 for 2024, based on the oil output change.

Brent to stall at trend of lower highs?Brent - 24h expiry
Daily signals are bearish.
Trend line resistance is located at 76.60.
50 1day EMA is at 76.35.
We look for a temporary move higher.
Preferred trade is to sell into rallies.
We look to Sell at 76.39 (stop at 77.39)
Our profit targets will be 73.89 and 73.39
Resistance: 75.90 / 76.40 / 77.34
Support: 75.20 / 74.80 / 74.40
Risk Disclaimer
The trade ideas beyond this page are for informational purposes only and do not constitute investment advice or a solicitation to trade. This information is provided by Signal Centre, a third-party unaffiliated with OANDA, and is intended for general circulation only. OANDA does not guarantee the accuracy of this information and assumes no responsibilities for the information provided by the third party. The information does not take into account the specific investment objectives, financial situation, or particular needs of any particular person. You should take into account your specific investment objectives, financial situation, and particular needs before making a commitment to trade, including seeking advice from an independent financial adviser regarding the suitability of the investment, under a separate engagement, as you deem fit.
You accept that you assume all risks in independently viewing the contents and selecting a chosen strategy.
Where the research is distributed in Singapore to a person who is not an Accredited Investor, Expert Investor or an Institutional Investor, Oanda Asia Pacific Pte Ltd (“OAP“) accepts legal responsibility for the contents of the report to such persons only to the extent required by law. Singapore customers should contact OAP at 6579 8289 for matters arising from, or in connection with, the information/research distributed.

Will Brent find buyers at crucial support once again?Brent - 24h expiry
A level of 72 continues to hold back the bears.
Daily momentum has stalled and our bias is now neutral.
Expect trading to remain mixed and volatile.
We look to buy dips.
The hourly chart technicals suggest further downside before the uptrend returns.
We look to Buy at 72.13 (stop at 71.13)
Our profit targets will be 74.63 and 75.13
Resistance: 73.30 / 74.00 / 75.00
Support: 72.40 / 72.00 / 71.62
Risk Disclaimer
The trade ideas beyond this page are for informational purposes only and do not constitute investment advice or a solicitation to trade. This information is provided by Signal Centre, a third-party unaffiliated with OANDA, and is intended for general circulation only. OANDA does not guarantee the accuracy of this information and assumes no responsibilities for the information provided by the third party. The information does not take into account the specific investment objectives, financial situation, or particular needs of any particular person. You should take into account your specific investment objectives, financial situation, and particular needs before making a commitment to trade, including seeking advice from an independent financial adviser regarding the suitability of the investment, under a separate engagement, as you deem fit.
You accept that you assume all risks in independently viewing the contents and selecting a chosen strategy.
Where the research is distributed in Singapore to a person who is not an Accredited Investor, Expert Investor or an Institutional Investor, Oanda Asia Pacific Pte Ltd (“OAP“) accepts legal responsibility for the contents of the report to such persons only to the extent required by law. Singapore customers should contact OAP at 6579 8289 for matters arising from, or in connection with, the information/research distributed.

UKOILThis is an update from the last time we took a trade on oil. Our approach was wrong, impatient and too easy, this time we have gone in with refinement and it has paid off.
- Pressure from the demand was very high
- retest of sensitive area
- break down of strength
- impulsive candle
This is to show that every time you refine your strategy you add to the skill so stay working on it and making it better, it is YOURS so only you can put in the work.


Brent Oil Critical ResistanceWhen we apply FRVP analysis to the Brent oil chart, I think HKEX:86 is a critical resistance on the daily timeframe. I can say that brent oil, which has failed to break this level by testing it many times, will test this level again.

Brent FuturesThe Chart looks quite simple for a complex geo polical commodity.
OPEC Cuts, Russian War, Recession and still the Price skeeps coming down.
One year down 26.4%

UKOIL D1 AnalysisPossible Reversal H&S.
We except higher prices as we analyzed before.
Have a look at our previous analysis, link below👇

UKOIL W1 AnalysisHey Traders.
TrendLine + Static Level increase probability of retracement.
We had a look at Brent Crude 3M chart before.

Brent: In the Jungle 🌳🌴🎍Wimoweh, wimoweh, wimoweh, wimoweh
Wimoweh, wimoweh, wimoweh, wimoweh
Wimoweh, wimoweh, wimoweh, wimoweh
Wimoweh, wimoweh, wimoweh, wimoweh
In the jungle, the mighty jungle
The lion sleeps tonight,
In the jungle the quiet jungle
The lion sleeps tonigh
Wee heeheehee…–
… – okay, let’s stop here before we won’t be able to get this song out of our heads. We should rather take a look at Brent, which has advanced deep into the dark green jungle between $77.13 and $42.20 and has left the mark at $75.09 behind. We hope, the course has taken a sharp machete along, as we expect it to penetrate the scrub further – ideally until the 61.80%-retracement at $62.71. There, it should complete wave 2 in green and subsequently turn upwards again.

Brent weaknessFX_IDC:USDBRO traded below $75 last week. Given the economic challenges, I'm open to weak oil prices. Unless there's a bounce at $71, we might see $64. How will this affect JSE:SOL , I don't know but I don't want to pay more than R30/L for petrol.

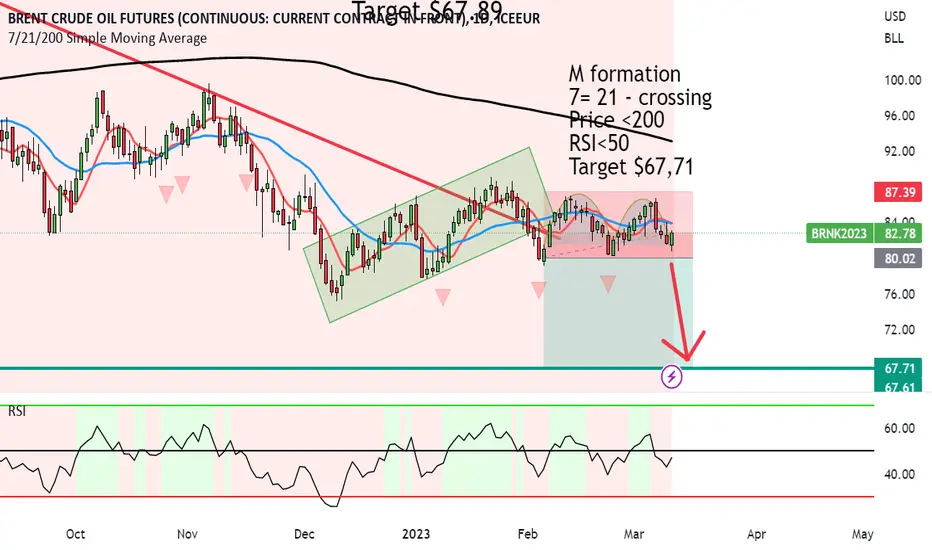
Brent showing two strong bearish patterns to target $67.71M formation has formed over the Rising Flag.
This confirms not one but 2 bearish patterns in the making.
There is a strong chance of the price coming down. and we have other indicators confirming.
7= 21 - crossing
Price <200
RSI<50
Target $67,71
USOIL top-down analysisHello traders, this is a complete multiple timeframe analysis of this pair. We see could find significant trading opportunities as per analysis upon price action confirmation we may take this trade. Smash the like button if you find value in this analysis and drop a comment if you have any questions or let me know which pair to cover in my next analysis.

USOIL - CRUDE OIL Investment & Uses🛢⛽Hi Traders, Investors and Speculators of the Charts 📈📉
Oil gets a bad rap these days, but the stuff is actually quite incredible. Many people think of crude oil as a thick, black liquid that is used to source our unquenchable thirst for gasoline and suffocate marine life. Although this isn't untrue; the reality is that each barrel of oil is refined to be used in a variety of applications that includes fuel, cosmetics, plastics, rubber, and candle wax.
Recently I saw many news outlet's post on the price of crude oil at their economic section. the sentiment was the same - buy. The reasoning was that oil will become more scarce in coming weeks and therefore, the demand will increase. Unsurprisingly, the price of oil has gone DOWN. These are usually coordinated traps in the market, and it's best to counter trade when the media is going with one sentiment.
The price of oil is declining seriously, with strong bearish pressure at $82. We see a nasty double top in the weekly, and I'll be looking for an entry between the support zone pointed out on the chart.
So, why consider oil as an investment?
The truth is, oil isn't going anywhere, any time soon. This is a commodity with a broad use case, and if you plan your trades, low risk trades with good profits can be made.
Here is everything that can be made from just one barrel of oil: 🛢
🚗 Enough gasoline to drive a medium-sized car over 450km (280 miles)
🚛 Enough distillate fuel to drive a large truck for almost 65km (40 miles)
⛽Nearly 70 kWh of electricity at a power plant generated by residual fuel
💥 About 1.8 kg (4 lbs) of charcoal briquettes
🏕 Enough propane to fill 12 small (14.1 ounce) cylinders for home, camping or workshop use
🚧 Asphalt to make about 3.8 L (one gallon) of tar for patching roofs or streets
⚙ Lubricants to make about a 0.95 L (one quart) of motor oil
🎂 Wax for 170 birthday candles or 27 wax crayons
But that’s not all. After producing all of the above products, there’s also enough petrochemicals leftover to be used as a base for one of the following:
👩👧👦 39 polyester shirts
👩🦰 750 pocket combs
😁 540 toothbrushes
🧺 65 plastic dustpans
⭕ 23 hula hoops
🧃 65 plastic drinking cups
🥛 195 one-cup measuring cups
☎ 11 plastic telephone housings
🥎 135 four-inch rubber balls
The above serves as one example of how a single barrel could be used, but here’s a list of many other oil applications. It includes everything from guitar strings to antihistamines. Whatever your opinion is on fossil fuels, it’s still pretty astonishing what can be produced out of each barrel of oil.
Here's a nice infographic to visualize :
_______________________
📢Follow us here on TradingView for daily updates and trade ideas on crypto , stocks and commodities 💎Hit like & Follow 👍
We thank you for your support !
CryptoCheck

BCOUSD Potential for Bearish Drop | 20th February 2023Looking at the H4 chart, my overall bias for BCOUSD is bearish due to the current price being below the Ichimoku cloud , indicating a bearish market.
Looking for a pullback sell entry at 8392.4, where the 38.2% Fibonacci line and overlap resistance is. Stop loss will be at 8673.5, where the recent swing high is. Take profit will be at 7902.9, where the previous swing low is.
Any opinions, news, research, analyses, prices, other information, or links to third-party sites contained on this website are provided on an "as-is" basis, as general market commentary, and do not constitute investment advice. The market commentary has not been prepared in accordance with legal requirements designed to promote the independence of investment research, and it is therefore not subject to any prohibition on dealing ahead of dissemination. Although this commentary is not produced by an independent source, FXCM takes all sufficient steps to eliminate or prevent any conflicts of interest arising out of the production and dissemination of this communication. The employees of FXCM commit to acting in the clients' best interests and represent their views without misleading, deceiving, or otherwise impairing the clients' ability to make informed investment decisions. For more information about the FXCM's internal organizational and administrative arrangements for the prevention of conflicts, please refer to the Firms' Managing Conflicts Policy. Please ensure that you read and understand our Full Disclaimer and Liability provision concerning the foregoing Information, which can be accessed on the website.

CL headed Higher - Volume ProfileThis is a small snapshot of the volume profile on the 30 minute, but the large view says higher, I believe, and in the shorter fractle, I believe this shows why. We have higher VAH, we are above POC, and we have cleared previous areas of volume.

Brent showing a further plummet to $67.89 Rising Flag has formed after the downtrend with Brent.
The price has broken below the rising flag which confirms bearishness.
200 > 21 > 7 - Bearish
RSI <50
Target $67.89
FUNDAMENTALS:
We've seen the US Dollar start to strengthen a bit which is can continue to do so for the next few weeks.
A strengthening US dollar can cause Brent crude price to drop because oil is priced in dollars. When the value of the dollar increases relative to other currencies, it makes oil more expensive for buyers using those currencies, which can result in decreased demand and lower prices. Additionally, a strong dollar can also make it more attractive for investors to sell commodities, including oil, in exchange for the higher-valued currency, putting downward pressure on prices.

Brent Could Cruise to $100 Soon- Demand from China is soaring.
- The US dollar index has recoiled.
- Supply is not rising as fast as demand is.
- I think recession fears are overblown. Where I live, people are traveling like crazy.
- European Union will announce new Russia sanctions on February 5.

UKOIL: Short from ResistanceAs evident on 4Hr Time-Frame with formation of Bearish Cypher harmonic pattern UKOIL a reversal is possible.
Seasonal Analysis shows JXY & DXY remain Bullish in January over 60% which have negative correlation with Oil. CXY on the other hand remain Bearish in January over 70% of times which indicates a low price of Oil.
TPs can be set as per Fib Lvls identified on chart and stop Loss on or above Point D of Cypher. It is my expectation that price action will retrace to 61.8% Fib level.
Manage your risk accordingly.

UKOIL: Bearish Reversal IdeaBearish Indications
• Resistance Zone at 85.26
• AB=CD where the D point is at 85.93 which indicates a reversal
• Gartley’s XABCD indicates 85.73 Area
• Seasonal Analysis Shows DXY remains Bearish at over 80% in December month
Bullish Indications
• Three White Soldiers
• Significant Support Zone at 0.68329
• Resistance Broken at 0.68629
• Support Zone at 84.23
• Seasonal Analysis shows UKOIL remains Bullish in December Month.
Biased: Short
Entry Short: 84.52 (Fib Level 78.6%)
TP1: 0.68236 (Fib Level 61.8%%)
TP2: 0.68085 (Fib Level 38.2%)
Stop Loss: 86.20
Risk/Reward: 1:1.6

BRENT CRUDE OIL BULISH PATTERNDemand for crude oil is expected to rise after a cold wave hit USA, which will likely increase the demand for oil distillates, easing of the COVID measures in China and US crude oil inventories coming up less than the analysts have had expected.
British crude oil benchmark, BRENT, had broken the resistance of the triangle pattern, a strong bullish predictor, and the price might reach levels of 87.5 in the next couple of days. In an event of reversal of the trend, the price might reach levels of its previous low of 75.35
RSI and MACD both are confirming the bullish outlook, with MACD histogram above 0 and rising and RSI rising as well and approaching the 50 neutral line.
Risk Disclosure: Trading Foreign Exchange (Forex) and Contracts of Difference (CFD's) carries a high level of risk. By registering and signing up, any client affirms their understanding of their own personal accountability for all transactions performed within their account and recognizes the risks associated with trading on such markets and on such sites. Furthermore, one understands that the company carries zero influence over transactions, markets, and trading signals, therefore, cannot be held liable nor guarantee any profits or losses.
