Brent Crude Oil capped by resistance at 7050 Key Support and Resistance Levels
Resistance Level 1: 7050
Resistance Level 2: 7130
Resistance Level 3: 7220
Support Level 1: 6800
Support Level 2: 6700
Support Level 3: 6590
This communication is for informational purposes only and should not be viewed as any form of recommendation as to a particular course of action or as investment advice. It is not intended as an offer or solicitation for the purchase or sale of any financial instrument or as an official confirmation of any transaction. Opinions, estimates and assumptions expressed herein are made as of the date of this communication and are subject to change without notice. This communication has been prepared based upon information, including market prices, data and other information, believed to be reliable; however, Trade Nation does not warrant its completeness or accuracy. All market prices and market data contained in or attached to this communication are indicative and subject to change without notice.
Brentcrudeoil

BCOUSD Long Swing Setup – Holding Support with Upside PotentialNYSE:BCO is currently sitting on a key support level, offering a potential long spot entry as buyers defend the $69.50 zone. A bounce from here could open the way for a move toward higher resistance levels.
📌 Trade Setup:
• Entry Zone: Around $69.50
• Take Profit Targets:
o 🥇 $73.50 – $76.00
o 🥈 $79.00 – $83.00
• Stop Loss: Daily close below $67.00

Brent Crude Oil loss of support now resistance at 7050Key Support and Resistance Levels
Resistance Level 1: 7050
Resistance Level 2: 7130
Resistance Level 3: 7220
Support Level 1: 6800
Support Level 2: 6700
Support Level 3: 6590
This communication is for informational purposes only and should not be viewed as any form of recommendation as to a particular course of action or as investment advice. It is not intended as an offer or solicitation for the purchase or sale of any financial instrument or as an official confirmation of any transaction. Opinions, estimates and assumptions expressed herein are made as of the date of this communication and are subject to change without notice. This communication has been prepared based upon information, including market prices, data and other information, believed to be reliable; however, Trade Nation does not warrant its completeness or accuracy. All market prices and market data contained in or attached to this communication are indicative and subject to change without notice.

"UK Oil/Brent Heist Plan: Thief Style Breakout Strategy"🛢️💣 "BRENT Energy Heist Plan 💸: The Thief Trader's Playbook to Rob the UK Oil Market!" 🔫📈
🚫 This is a creative and educational overview of a market strategy. It does not encourage illegal activity. Please trade responsibly and within your own risk tolerance.
🌍 Hola! Bonjour! Marhaba! Hello, Money Makers & Market Thieves! 🤑💰📊
Welcome to the Thief Trading Style — a unique, bold, and tactical approach to trading the UK Oil Spot (Brent) market like a pro bandit on Wall Street. We don’t chase the market… we set the trap, wait, and strike like skilled robbers at the vault. 🔓💼
🧠💡Game Plan Summary:
📌 Asset: UK Oil Spot / Brent
📌 Style: Day Trade / Scalping
📌 Bias: Bullish Breakout
📌 Thief’s Method: Layered DCA Entries, Breakout Setup, Swing-Based SL, Aggressive TP
🎯 ENTRY - “The Vault Break”
🚨 Codename: Break & Retest Mission
Wait for a clean breakout above the Moving Average Wall (around 70.500) followed by a retest confirmation. That’s your green light!
✅ Buy Stop Entry: Above 70.500 after a clean candle close & retest.
✅ Buy Limit (Pullback): Near recent swing low or 15–30 min timeframe zones. Use DCA or order layering to reduce risk.
📌 Tip: Set up alerts at the breakout level — never miss the move.
🛑 STOP LOSS - “Escape Route”
🎙️ "Yo, Thief Rule #1: Plan the exit before the entry."
📍 SL suggestion: Swing Low @ 64.000 (based on 2H structure).
🧠 Risk management is key – consider your lot size, margin, and how many layered orders you're stacking.
📢 Optional: Trail that SL once price moves in your favor — lock your loot!
💸 TAKE PROFIT - “The Clean Getaway”
🎯 Target: 72.200 — but don’t be greedy. If the market gets shaky, exit before the cops (sellers) show up!
📌 Be ready to close manually if you smell reversal.
🔍 Fundamentals & Macro View
UK Oil is experiencing strong bullish momentum, driven by:
📰 Geopolitical tensions
🛢️ Supply-demand imbalances
📊 Positive sentiment & institutional flow (Check COT, Macro Outlooks, and Sentiment Reports)
👉 Stay updated with news drops and macro data that can flip the script — set economic calendar alerts.
⚠️ News Release Survival Tips
❌ Avoid new entries during high-impact news.
✅ Use trailing SL to protect running trades.
🔄 Monitor position sizing — volatile swings can eat your equity.
💥 SUPPORT THE CREW!
If you’re vibing with this Heist-Style Trading Analysis, smash that ❤️ Boost Button on TradingView and join the growing crew of market robbers making money with precision and attitude! 🏆💰📈
🚨 More Heist Plans coming soon — follow for real-time setups & updates!
📌 DISCLAIMER:
This analysis is educational and based on personal trading style. Always DYOR (Do Your Own Research), and tailor trades to your own risk profile. Markets change fast — stay agile and sharp! 🧠💼

Brent Crude Key Trading Levels Key Support and Resistance Levels
Resistance Level 1: 7260
Resistance Level 2: 7310
Resistance Level 3: 7460
Support Level 1: 6860
Support Level 2: 6760
Support Level 3: 6690
This communication is for informational purposes only and should not be viewed as any form of recommendation as to a particular course of action or as investment advice. It is not intended as an offer or solicitation for the purchase or sale of any financial instrument or as an official confirmation of any transaction. Opinions, estimates and assumptions expressed herein are made as of the date of this communication and are subject to change without notice. This communication has been prepared based upon information, including market prices, data and other information, believed to be reliable; however, Trade Nation does not warrant its completeness or accuracy. All market prices and market data contained in or attached to this communication are indicative and subject to change without notice.

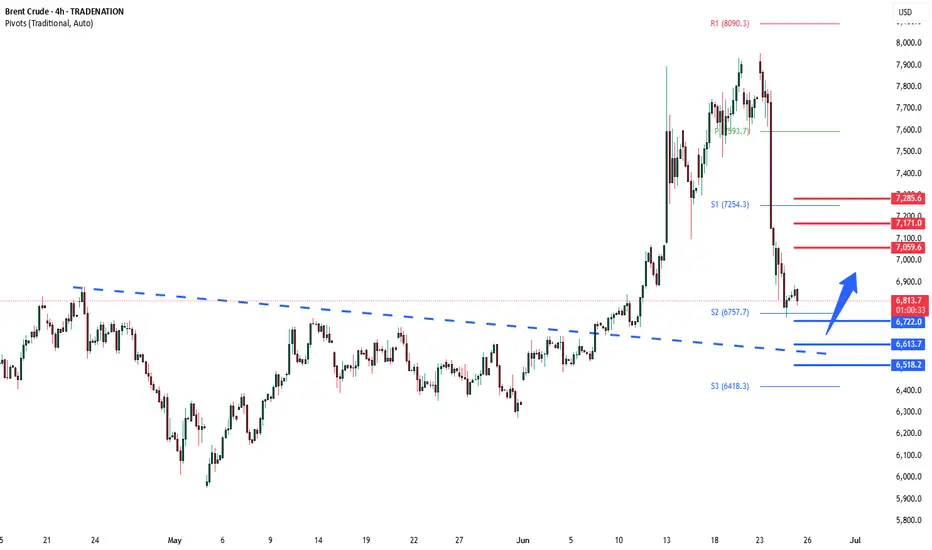
Brent Crude support at 6720Key Support and Resistance Levels
Resistance Level 1: 7060
Resistance Level 2: 7170
Resistance Level 3: 7280
Support Level 1: 6720
Support Level 2: 6610
Support Level 3: 6520
This communication is for informational purposes only and should not be viewed as any form of recommendation as to a particular course of action or as investment advice. It is not intended as an offer or solicitation for the purchase or sale of any financial instrument or as an official confirmation of any transaction. Opinions, estimates and assumptions expressed herein are made as of the date of this communication and are subject to change without notice. This communication has been prepared based upon information, including market prices, data and other information, believed to be reliable; however, Trade Nation does not warrant its completeness or accuracy. All market prices and market data contained in or attached to this communication are indicative and subject to change without notice.

Brent Oil Robbery: The Thief’s Guide to Energy Market Profits! 🚨💰 THE OIL VAULT HEIST: UK OIL SPOT/BRENT TRADING STRATEGY 💸🔫
🌟Hi! Hola! Ola! Bonjour! Hallo! Marhaba!🌟
Dear Money Makers & Robbers 🤑💰💸✈️
Based on our 🔥Thief Trading style analysis🔥 (both technical and fundamental), here’s the master plan to heist the UK Oil Spot/Brent Energy Market. Follow the blueprint carefully—this strategy focuses on long entries, with a daring escape planned near the high-risk RED MA Zone where bearish robbers and consolidation traps await. 🏆💸 Take your profit and treat yourself, fellow traders—you earned it! 💪🏆🎉
🕵️♂️ Entry 📈
💥 The vault is wide open! Time to swipe that bullish loot—heist is on!
Place buy limit orders within the 15 or 30-minute timeframe, near swing lows/highs for pullback entries.
🛑 Stop Loss 🛑
📍 Thief’s SL—recent swing low and below the moving average (4H timeframe) for day/swing trades.
📍 Adjust SL based on risk, lot size, and number of orders.
🎯 Target
🏴☠️💥 70.800 (Aim for the big loot!) OR escape before the target
🔥 Market Heist Overview
The UK Oil Spot/Brent market is currently showing bullishness 🐂, driven by key factors—perfect for a day/scalping trade robbery! ☝☝☝
📰 Additional Tools & Analysis
📊 Get the Fundamental, Macro, COT Report, Quantitative Analysis, Sentiment Outlook, Intermarket Analysis, Future Targets—check our bi0 liinks 👉👉👉🔗🔗
⚠️ Trading Alert: News Releases & Position Management
📰 News can rattle the vault! 💥
✅ Avoid new trades during news releases.
✅ Use trailing stop-loss orders to protect profits.
💖 Supporting our heist plan?
💥 Smash the Boost Button 💥 to empower the robbery team.
Let’s make money every day in this market with the Thief Trading Style! 🏆💪🤝❤️🎉🚀
👀 Stay tuned for the next robbery plan, thieves! 🤑🐱👤🤗🤩

Brent Oil Breakout Heist – Bullish Robbery in Progress!🕶️ Brent Oil Job in Motion – Market Robbery Blueprint by The Chart Bandits 💼💸
What’s up, gang? 👋 Hola, Ola, Bonjour, Hallo, Marhaba! 🌍
Calling all market robbers, trend thieves, and slick profit snatchers! 🤑💰💥
We’ve got eyes on the UK Oil Spot / Brent Energy Market – and this time, it’s a clean breakout job. According to our Thief Trading Code (yeah, that’s the street manual we use), the setup’s lit and the vault’s wide open. Here’s the drill:
📈 Entry Plan – The Break-In Point:
The score begins above MA level 65.400. When that line cracks, it’s time to move.
You can either:
🔹 Set buy stop orders just above the breakout zone
🔹 Or wait for a pullback to a 15m or 30m swing low/high and enter with style
🚨 Pro tip: Set your alerts. Real thieves don’t sleep on breakouts.
🛑 Stop Loss – Safety First, Bandits:
Let the breakout breathe. Don’t slam the SL too early.
Once it confirms, tuck your SL near the 4H swing low – around 64.000.
Lot size, risk appetite, number of positions – all play into where you hide your exit door.
Just don’t blame the crew if you jump in blind. ⚠️
🎯 Take Profit – The Escape Route:
Target set at 70.000 – hit it, grab the bags, and disappear before the bears sniff us out. 🏃♂️💨
📊 Why This Heist Works:
The market’s lookin’ bullish – real heat from fundamentals like:
Macro setups
COT positioning
Intermarket analysis
Sentiment vibes
Storage & inventory updates
🔍 Want the full blueprint? Fundamentals, charts, deep dives – check my profille for the linkss 🔗👀
⚠️ Heads-Up – News Drops Can Wreck the Getaway:
Don’t enter during high-impact news
Protect profits with a trailing SL
Always expect the unexpected, robbers 🚧📉
💥 Smash the Boost Button if you’re part of the Thief Crew!
We’re not just trading – we’re executing blueprints and stealing clean gains.
Stay tuned for the next setup. You know what time it is...
🕶️ Trade smart, loot fast, vanish smooth. 🐱👤💸🚀

Bren Crude Oil important support at 6720Key Support and Resistance Levels
Resistance Level 1: 7060
Resistance Level 2: 7170
Resistance Level 3: 7280
Support Level 1: 6720
Support Level 2: 6610
Support Level 3: 6520
This communication is for informational purposes only and should not be viewed as any form of recommendation as to a particular course of action or as investment advice. It is not intended as an offer or solicitation for the purchase or sale of any financial instrument or as an official confirmation of any transaction. Opinions, estimates and assumptions expressed herein are made as of the date of this communication and are subject to change without notice. This communication has been prepared based upon information, including market prices, data and other information, believed to be reliable; however, Trade Nation does not warrant its completeness or accuracy. All market prices and market data contained in or attached to this communication are indicative and subject to change without notice.
Oil Price Falls Below $69Oil Price Falls Below Pre-Escalation Levels of Middle East Conflict
According to the XBR/USD chart:
→ Prior to Israel’s airstrikes on Iran on 13 June, the price of Brent crude was hovering around the $69.00 mark;
→ Following US bombings in Iran, the price spiked at the Monday market open, reaching a high of approximately $77.77 (as we reported on 23 June).
However, after President Trump announced a ceasefire between Iran and Israel — later confirmed by statements from both sides — oil prices dropped sharply. This morning, Brent is trading around $68, which is even lower than the level seen before the initial strikes.
Media outlets report that analysts broadly agree that fears have eased, even if the ceasefire appears fragile. Market participants seem to view the likelihood of the conflict escalating into a full-scale ground war — involving US troops and the closure of the Strait of Hormuz — as low. Shipping through the strait is reportedly returning to normal.
Technical Analysis of the XBR/USD Chart
Interestingly, the $69 level — from which prices surged on 13 June — acted as resistance yesterday (as indicated by the arrow on the chart).
It can be assumed that the longer the ceasefire holds, the less relevant the fears that have served as bullish drivers. In that case, Brent crude prices may continue fluctuating within a downward channel, outlined in red, with the possibility of a short-term rise toward its upper boundary.
Nevertheless, the key drivers for oil prices will remain the fundamental backdrop and official statements regarding the situation in the Middle East and other geopolitical factors.
This article represents the opinion of the Companies operating under the FXOpen brand only. It is not to be construed as an offer, solicitation, or recommendation with respect to products and services provided by the Companies operating under the FXOpen brand, nor is it to be considered financial advice.

Oil Price Surges at Monday Open Amid US Strikes on IranOil Price Surges at Monday Open Amid US Strikes on Iran
As shown on the XBR/USD chart, the Brent crude oil price formed a bullish gap at the opening of financial markets this Monday, surpassing last week’s high.
Only three days ago, we drew attention to Donald Trump’s statement that a decision regarding US involvement in the Iran-Israel conflict would be made within two weeks – yet over the weekend, US aircraft dropped bombs on Iran’s nuclear facilities.
Now oil prices are likely to be affected by Iran’s potential move to block shipping traffic through the Strait of Hormuz. According to Reuters, analysts suggest that in such a scenario, the oil price could climb to $100.
Technical Analysis of the XBR/USD Chart
The ascending channel plotted last week remains valid.
The fact that the price is pulling back (as indicated by the arrow) from the high set at the market open suggests the market had already priced in a significant risk of US involvement in the Iran-Israel military conflict.
Key points:
→ Technical support in the near term may be provided by the area where the lower boundary of the blue channel intersects with the $76 level (which acted as resistance at the end of last week).
→ Ultimately, fundamental factors and official statements will play a decisive role in oil price movements. It’s worth noting that, following the strikes on its territory, Iran is threatening retaliation against the US.
This article represents the opinion of the Companies operating under the FXOpen brand only. It is not to be construed as an offer, solicitation, or recommendation with respect to products and services provided by the Companies operating under the FXOpen brand, nor is it to be considered financial advice.

XBR/USD Chart Analysis: Oil Price Falls After Trump’s DecisionXBR/USD Chart Analysis: Oil Price Falls After Trump’s Decision
As shown on the XBR/USD chart, the price of Brent crude oil has pulled back from yesterday’s 4.5-month high following a statement from the White House that President Donald Trump will make a decision within the next two weeks on whether the United States will take part in the Israel-Iran conflict.
According to Reuters, the US President is facing backlash from some members of his team over the prospect of launching a strike against Iran, which could drag the US into yet another prolonged war.
Technical Analysis of the XBR/USD Chart
From a technical standpoint, Brent crude oil price is developing within an upward channel (marked in blue), though several bearish signals are appearing on the chart:
→ a bearish gap that formed overnight;
→ a false bullish breakout (indicated by an arrow) above the $76.50 level, drawn from the 13 June high;
→ bearish divergence on the RSI indicator;
→ a break of the recent local ascending trendline (marked in orange).
Given the steep angle of the rising blue channel, it is reasonable to assume that bears may attempt to break through its lower boundary, which is currently acting as support. Whether this scenario materialises in the oil market will largely depend on developments in the Middle East.
This article represents the opinion of the Companies operating under the FXOpen brand only. It is not to be construed as an offer, solicitation, or recommendation with respect to products and services provided by the Companies operating under the FXOpen brand, nor is it to be considered financial advice.

Brent Crude Oil Bullish above 73.50Key Support and Resistance Levels
Resistance Level 1: 77.50
Resistance Level 2: 78.90
Resistance Level 3: 80.50
Support Level 1: 73.50
Support Level 2: 72.30
Support Level 3: 71.00
This communication is for informational purposes only and should not be viewed as any form of recommendation as to a particular course of action or as investment advice. It is not intended as an offer or solicitation for the purchase or sale of any financial instrument or as an official confirmation of any transaction. Opinions, estimates and assumptions expressed herein are made as of the date of this communication and are subject to change without notice. This communication has been prepared based upon information, including market prices, data and other information, believed to be reliable; however, Trade Nation does not warrant its completeness or accuracy. All market prices and market data contained in or attached to this communication are indicative and subject to change without notice.

BRENT - UniverseMetta - Signal#BRENT - UniverseMetta - Signal
H4 - Breakout of the trend line + formation of ABC structure in continuation of the uptrend. It is better to reduce risks. Stop behind the minimum of wave C.
Entry: 74.929
TP: 78.405 - 83.274 - 86.179 - 91.207
Stop: 70.314

Israel Strikes Iran. Oil and Gold Prices SurgeIsrael Strikes Iran. Oil and Gold Prices Surge
According to media reports, Israel launched a large-scale overnight strike on Iranian territory, targeting dozens of military and strategic facilities linked to the country’s nuclear programme and missile capabilities. Israeli officials justified the action by citing an existential threat from Tehran, which, according to their intelligence, is accelerating its development of nuclear weapons and expanding its arsenal of ballistic missiles.
In response, Iran has vowed severe retaliation, stating that the United States and Israel will “pay a heavy price” for the attack. US President Donald Trump has urgently convened a meeting to assess the situation.
Commodities Market Reaction
In the wake of these developments, gold — the primary safe-haven asset — surged sharply. The XAU/USD price broke above its May high, rising past $3,440. However, the all-time high near $3,498 remains intact for now.
Oil prices also spiked due to fears of supply disruption. The military conflict threatens shipping through the Strait of Hormuz, a crucial chokepoint through which one-fifth of the world’s oil supply passes. Traders quickly priced in the risk of war, anticipating a supply shortage driven by large-scale instability in the Middle East.
Technical Analysis of the XBR/USD Chart
Brent crude oil price has risen to the upper boundary of a large-scale descending channel (shown in red), which is defined by lower highs from 2024–2025. As anticipated, this upper boundary acted as resistance, with the price forming a peak above $76 before reversing downward (as illustrated by the black arrow).
From a technical standpoint, following such a sharp rally, Brent is vulnerable to a corrective move. In this scenario, a pullback into the orange zone is possible, where support may be found at:
→ The psychologically important $70 level;
→ The 50% Fibonacci retracement level;
→ The former resistance of the purple descending trendline, now turned support.
Nevertheless, given the scale of the geopolitical threat, it is unlikely that market sentiment will allow Brent to decline significantly in the near term.
This article represents the opinion of the Companies operating under the FXOpen brand only. It is not to be construed as an offer, solicitation, or recommendation with respect to products and services provided by the Companies operating under the FXOpen brand, nor is it to be considered financial advice.

Brent Bulls Eye $74 & $81 — 2 Profit Points, 1 Tight StopBrent crude has confirmed a bullish breakout on the daily chart after closing decisively above the key horizontal resistance near $66.65. This level had acted as strong overhead pressure over the last two months but has now flipped into support, reinforcing the bullish sentiment.
Price is currently trading at $68.18, just above the newly established support zone, and showing strength after consolidating in a tight range. The Ichimoku Cloud system further validates this bullish move. The price has cleanly broken through the Kumo (cloud), and the Tenkan-sen has crossed above the Kijun-sen, forming a classic bullish crossover. The Chikou Span is also above the price, indicating momentum is firmly in the bulls’ favor.
The immediate upside target is the $74.38 resistance, which corresponds to a key prior swing high from earlier this year. This zone is expected to act as the first major take-profit level for swing traders. If the bullish momentum persists, the next target lies at $81.40, a previous supply zone and psychological resistance. The path from current levels to that area appears technically open, with relatively little congestion in between.
Risk-reward analysis supports the long setup. Entering near the current price, with a stop-loss just below $66.10, provides a downside risk of around 3%, while the potential upside to TP1 and TP2 offers gains of approximately 9% and 19%, respectively. This yields a favorable R:R of roughly 1:3 to 1:6, depending on the exit strategy.
For scalpers, the area around $68.42 marks an intraday take-profit zone. However, scalpers must adjust their stop-losses dynamically, based on individual risk tolerance. A tighter stop might sit around $66.65, while more conservative scalpers may prefer to give room down to $66.10.
The secondary support around $58.83 marks a major floor but is currently distant and would only be in play if Brent fails to hold $65—an unlikely scenario given current strength and volume.
In summary, Brent crude’s technical structure favors further upside, with bullish momentum confirmed by both price action and Ichimoku alignment. A retest of $66.65 could present a buying opportunity, but failure to hold above that would invalidate the setup. As long as the price stays above the cloud and key supports, the bullish case remains intact.

Brent Crude Oil Bullish continuation supported at 6620Trend Overview:
Brent Crude Oil remains in a bullish trend, characterised by higher highs and higher lows. The recent intraday price action is forming a continuation consolidation pattern, suggesting a potential pause before a renewed move higher.
Key Technical Levels:
Support: 6620 (primary pivot), followed by 6530 and 6440
Resistance: 6900 (initial), then 7000 and 7080
Technical Outlook:
A pullback to the 6620 level, which aligns with the previous consolidation zone, could act as a platform for renewed buying interest. A confirmed bounce from this support may trigger a continuation toward the next resistance levels at 6900, 7000, and ultimately 7080.
Conversely, a daily close below 6620 would suggest weakening bullish momentum. This scenario would shift the bias to bearish in the short term, potentially targeting 6530 and 6440 as downside levels.
Conclusion:
Brent Crude Oil maintains a bullish structure while trading above the 6620 support. A bounce from this level would validate the consolidation as a continuation pattern, with upside potential toward the 6900 area. A breakdown below 6620, however, would invalidate this view and suggest deeper corrective risk.
This communication is for informational purposes only and should not be viewed as any form of recommendation as to a particular course of action or as investment advice. It is not intended as an offer or solicitation for the purchase or sale of any financial instrument or as an official confirmation of any transaction. Opinions, estimates and assumptions expressed herein are made as of the date of this communication and are subject to change without notice. This communication has been prepared based upon information, including market prices, data and other information, believed to be reliable; however, Trade Nation does not warrant its completeness or accuracy. All market prices and market data contained in or attached to this communication are indicative and subject to change without notice.

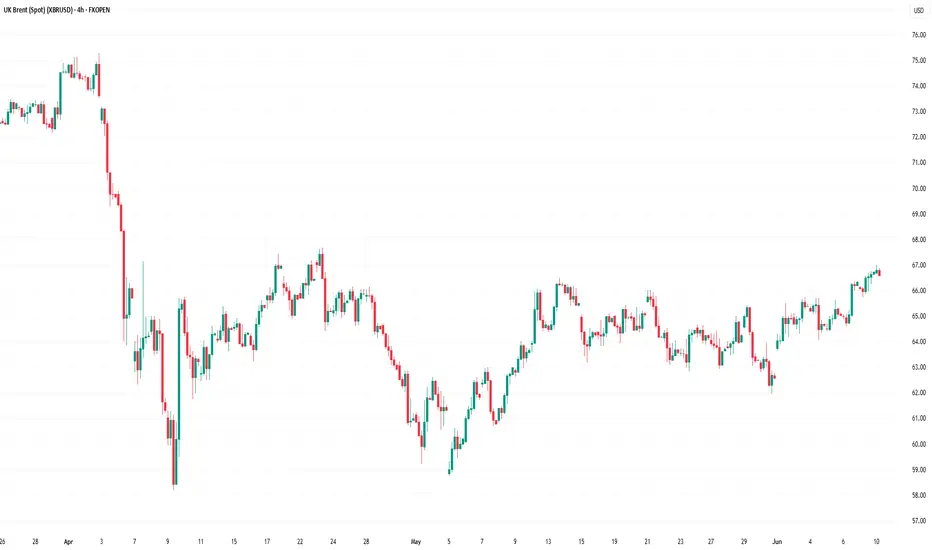
XBR/USD Chart Analysis: Brent Crude Reaches 1.5-Month HighXBR/USD Chart Analysis: Brent Crude Reaches 1.5-Month High
In our analysis of Brent crude oil six days ago, we identified a large contracting triangle and a local ascending channel. We also outlined a potential scenario involving a bullish breakout above the upper boundary of the triangle.
Although this was not the base-case scenario, the XBR/USD chart now suggests it has played out: yesterday, the price climbed to nearly $67 per barrel — its highest level since the end of April.
The main bullish catalyst appears to be ongoing trade talks between the United States and China, which have raised hopes of a resolution to tariff-related tensions between the world’s two largest economies.
At the same time, rising oil prices may exacerbate geopolitical tensions, particularly amid Israeli threats to strike ports in Yemen — a risk that could disrupt supply chains across the Middle East.
Technical Analysis of the XBR/USD Chart
From a technical perspective:
→ Brent crude continues to move within an ascending channel (marked in blue);
→ the upper boundary may now act as a support level.
The fact that the price is holding in the upper half of the channel indicates strong demand-side pressure. Based on this, it is reasonable to assume that as long as Brent remains above the $65.75 level (the retest zone of the breakout), the technical outlook will remain predominantly bullish.
This article represents the opinion of the Companies operating under the FXOpen brand only. It is not to be construed as an offer, solicitation, or recommendation with respect to products and services provided by the Companies operating under the FXOpen brand, nor is it to be considered financial advice.
XBR/USD Chart Analysis: Oil Price Rises to Key ResistanceXBR/USD Chart Analysis: Oil Price Rises to Key Resistance
Yesterday, the price of Brent crude climbed above $65.60 — the highest level in over a week.
According to media reports, several bullish factors are driving this move:
→ Stalled negotiations between the US and Iran over abandoning Iran’s nuclear programme in exchange for lifting oil export sanctions;
→ Wildfires in Canada, which have significantly reduced oil output;
→ Market reaction to the OPEC+ meeting held over the weekend;
→ A weakening US dollar.
Technical Analysis of the XBR/USD Chart
From a technical standpoint, Brent crude oil:
→ Has been forming a short-term ascending channel (marked in blue) since the beginning of the week;
→ Has approached a major resistance level.
This resistance is defined by the upper boundary of a narrowing triangle, with its central axis around the $63.70 level — a price that could be considered a fair value based on trading over the past one and a half months.
This situation points to two possible scenarios:
→ A downward reversal from the key resistance, with expectations that the price will return to the triangle’s central axis. A break below the lower boundary of the local blue channel would support this scenario.
→ An attempt at a bullish breakout of the triangle. While this scenario cannot be ruled out, it appears less likely due to the global economic slowdown risks posed by tariff-related trade barriers.
This article represents the opinion of the Companies operating under the FXOpen brand only. It is not to be construed as an offer, solicitation, or recommendation with respect to products and services provided by the Companies operating under the FXOpen brand, nor is it to be considered financial advice.

Brent Crude INTRADAY key resistance retest at 6700Trend: Overall bearish sentiment continues, in line with the dominant downtrend.
Recent Price Action: The market is in a sideways consolidation, signaling indecision after recent declines.
Key Levels
Resistance:
6700 – Main resistance and pivot level.
Above that: 6860, then 7000 – Upside targets if bullish breakout occurs.
Support:
6350 – Initial downside target.
Below that: 6180, then 6080 – Further supports on continued weakness.
Trading Scenarios
Bearish Continuation:
A failed rally near 6700 followed by rejection could lead to a move toward 6350, 6180, and 6080.
Bullish Reversal:
A daily close above 6700 would break the bearish structure, targeting 6860 and potentially 7000.
Conclusion
Brent Crude remains bearish but is currently consolidating. A rejection at 6700 supports further downside. A breakout above that level would shift sentiment to bullish. Watch 6700 as the key decision point.
This communication is for informational purposes only and should not be viewed as any form of recommendation as to a particular course of action or as investment advice. It is not intended as an offer or solicitation for the purchase or sale of any financial instrument or as an official confirmation of any transaction. Opinions, estimates and assumptions expressed herein are made as of the date of this communication and are subject to change without notice. This communication has been prepared based upon information, including market prices, data and other information, believed to be reliable; however, Trade Nation does not warrant its completeness or accuracy. All market prices and market data contained in or attached to this communication are indicative and subject to change without notice.

Brent Crude Oil INTRADAY resistance at 6700Trend: Overall bearish sentiment continues, in line with the dominant downtrend.
Recent Price Action: The market is in a sideways consolidation, signaling indecision after recent declines.
Key Levels
Resistance:
6700 – Main resistance and pivot level.
Above that: 6860, then 7000 – Upside targets if bullish breakout occurs.
Support:
6350 – Initial downside target.
Below that: 6180, then 6080 – Further supports on continued weakness.
Trading Scenarios
Bearish Continuation:
A failed rally near 6700 followed by rejection could lead to a move toward 6350, 6180, and 6080.
Bullish Reversal:
A daily close above 6700 would break the bearish structure, targeting 6860 and potentially 7000.
Conclusion
Brent Crude remains bearish but is currently consolidating. A rejection at 6700 supports further downside. A breakout above that level would shift sentiment to bullish. Watch 6700 as the key decision point.
This communication is for informational purposes only and should not be viewed as any form of recommendation as to a particular course of action or as investment advice. It is not intended as an offer or solicitation for the purchase or sale of any financial instrument or as an official confirmation of any transaction. Opinions, estimates and assumptions expressed herein are made as of the date of this communication and are subject to change without notice. This communication has been prepared based upon information, including market prices, data and other information, believed to be reliable; however, Trade Nation does not warrant its completeness or accuracy. All market prices and market data contained in or attached to this communication are indicative and subject to change without notice.

Dive into the oil storm of 2025!In 2025, oil prices declined due to rising output from OPEC+ countries, growing inventories in the U.S., weakening global demand, a stronger dollar, and ongoing trade tensions between major economies. Further pressure came from OPEC+’s plan to boost production by 411,000 barrels per day — three times more than previously scheduled. A final decision is expected at the May 31 meeting. This move aims to strengthen the Alliance’s market position, particularly against U.S. shale producers, but it has deepened the supply-demand imbalance, pushing prices to their lowest levels in four years .
Despite current challenges, several factors could support a recovery in oil prices :
1. Rising demand in emerging markets : Developing economies are expected to continue increasing energy consumption as they grow, boosting oil demand.
2. Limited investment in production : Lower investment in exploration and drilling — especially in a low-price environment — may lead to tighter future supply, which can support prices.
3. Geopolitical risks : Conflicts and instability in oil-producing regions can disrupt supply chains, traditionally driving prices higher.
4. Slower non-OPEC+ output growth : While non-OPEC+ production is expected to rise in 2025, the U.S. Energy Information Administration forecasts slower growth in 2026, easing pressure on prices.
5. Possible OPEC+ output cuts : If the current production increase fails to deliver the desired results, OPEC+ may reverse course and reduce output to stabilize the market.
In 2025, the oil market is under strain due to surging OPEC+ output, inventory surpluses, weak global demand, and economic uncertainty. Yet, despite prices plunging to four-year lows, there’s still room for recovery. Future price trends will hinge on OPEC+ decisions, emerging market demand, geopolitical events, and investment patterns in the energy sector. The upcoming OPEC+ meeting could be a turning point for the entire market.

Brent Crude Oil Weekly Short Trade SetupBrent Crude Oil Weekly Short Trade Setup (as of May 22, 2025)
This chart reflects a prolonged downtrend within a clearly defined descending channel. Brent Crude Oil continues to respect the dynamic resistance of the upper boundary and has failed to sustain bullish momentum in recent months. The current price action presents a low-risk, high-reward short opportunity based on technical structure and projected price movement.
Entry Price: 64.994
The entry level at 64.994 is tactically chosen near the midpoint of the descending channel and slightly below the recent consolidation area. This level marks a rejection zone where price previously attempted to break higher but failed to gain traction.
The reason for this entry is:
• Price is reacting to the 20-period moving average (blue line), which has consistently acted as dynamic resistance.
• The last bullish push failed to close above the mid-channel zone and reversed near the projected retest line, indicating sellers are still in control.
• Entering here means you're entering after confirmation of a failed breakout rather than preemptively.
This is a conservative but smart entry point, favoring a continuation move in the direction of the dominant trend.
Stop Loss: 68.867
The stop loss is placed at 68.867, which aligns with the chart’s "Conservative Projected Retest Price Level" marked in green.
Here’s why this stop makes technical sense:
• This area corresponds to prior horizontal resistance and is very close to the descending channel’s upper boundary.
• A move above this zone would invalidate the bearish structure, suggesting a potential shift in momentum.
• Setting the stop here protects the trade against a deeper bullish retracement while still giving it enough room to breathe around minor fluctuations.
The risk is controlled, and you're only exiting if the market structure genuinely breaks.
Take Profit: 56.850
The take profit level is projected at 56.850, slightly above the "Weak Support Zone" marked in red.
The reasoning:
• This zone has acted as prior psychological support, but the label “weak” implies limited buyer strength here, increasing the chance of a breakdown.
• Price has tested this level before and rebounded only modestly, suggesting vulnerability.
• It also aligns closely with the lower boundary of the descending channel, which provides technical confluence as a realistic downside target.
• Setting TP just above support allows for safer profit booking without being too greedy, avoiding the risk of reversal right at a major support.
This exit point balances profit potential and probability, giving the trade a favorable risk-to-reward ratio.
Trade Structure Summary
• Trend: Bearish (confirmed by lower highs/lower lows and downward-sloping channel)
• Technical Confluence: Dynamic resistance, channel boundaries, horizontal zones, moving average rejection
• Market Sentiment: Weak upside follow-through despite occasional rallies, suggesting bearish control
Risk-Reward Outlook
• Entry: 64.994
• Stop Loss: 68.867
• Take Profit: 56.850
• Risk (SL - Entry): 3.873
• Reward (Entry - TP): 8.144
• Risk-Reward Ratio: Approximately 1:2.1
This setup offers more than twice the reward for the risk taken, making it an attractive candidate for traders seeking asymmetrical returns.
