Brent Crude Oil - Weekly technical analysis updateMidterm forecast:
While the price is below the resistance 46.50, beginning of downtrend is expected.
We make sure when the support at 36.95 breaks.
If the resistance at 46.50 is broken, the short-term forecast -beginning of downtrend- will be invalid.
Technical analysis:
While the RSI downtrend #1 is not broken, bearish wave in price would continue.
A peak is formed in daily chart at 45.44 on 11/11/2020, so more losses to support(s) 41.70, 40.00 and minimum to Major Support (36.95) is expected.
Price is above WEMA21, if price drops more, this line can act as dynamic support against more losses.
Relative strength index (RSI) is 54.
❤️ If you find this helpful and want more FREE forecasts in TradingView
. . . . . Please show your support back,
. . . . . . . . Hit the 👍 LIKE button,
. . . . . . . . . . Drop some feedback below in the comment!
❤️ Your Support is very much 🙏 appreciated! ❤️
💎 Want us to help you become a better Forex trader ?
Now, It's your turn !
Be sure to leave a comment let us know how you see this opportunity and forecast.
Trade well, ❤️
ForecastCity English Support Team ❤️
Brentcrudeoil

Brent Crude Oil - Weekly technical analysis updateMidterm forecast:
While the price is below the resistance 46.50, beginning of downtrend is expected.
We make sure when the support at 36.95 breaks.
If the resistance at 46.50 is broken, the short-term forecast -beginning of downtrend- will be invalid.
Technical analysis:
While the RSI downtrend #1 is not broken, bearish wave in price would continue.
A peak is formed in daily chart at 45.44 on 11/11/2020, so more losses to support(s) 41.70, 40.00 and minimum to Major Support (36.95) is expected.
Price is above WEMA21, if price drops more, this line can act as dynamic support against more losses.
Relative strength index (RSI) is 54.
❤️ If you find this helpful and want more FREE forecasts in TradingView
. . . . . Please show your support back,
. . . . . . . . Hit the 👍 LIKE button,
. . . . . . . . . . Drop some feedback below in the comment!
❤️ Your Support is very much 🙏 appreciated! ❤️
💎 Want us to help you become a better Forex trader ?
Now, It's your turn !
Be sure to leave a comment let us know how you see this opportunity and forecast.
Trade well, ❤️
ForecastCity English Support Team ❤️


UKOIL (BRENT) SELL PLANIf you found my analysis useful, you can support it with your likes and comments.

Brent Crude Oil - Weekly technical analysis updateMidterm forecast:
41.70 is a major resistance, while this level is not broken, the Midterm wave will be downtrend.
We will close our open trades, if the Midterm level 41.70 is broken.
Technical analysis:
The RSI bounced from the resistance #1 at 55 and it prevented price from more gains.
A peak is formed in daily chart at 43.65 on 10/15/2020, so more losses to support(s) 36.95, 33.80, 19.40 and more depths is expected.
Price is below WEMA21, if price rises more, this line can act as dynamic resistance against more gains.
Relative strength index (RSI) is 32.
❤️ If you find this helpful and want more FREE forecasts in TradingView
. . . . . Please show your support back,
. . . . . . . . Hit the 👍 LIKE button,
. . . . . . . . . . Drop some feedback below in the comment!
❤️ Your Support is very much 🙏 appreciated! ❤️
💎 Want us to help you become a better Forex trader ?
Now, It's your turn !
Be sure to leave a comment let us know how you see this opportunity and forecast.
Trade well, ❤️
ForecastCity English Support Team ❤️

Oil looking super interesting Will we get a continuation to the downside or will we have an impulse to the upside followed by a continuation for further upside momentum


Brent crude. Today's matrix for intraday trading.
For timeframes m5. Detailed levels for buy / sell. On the screenshot below 🠗🠗🠗
ibb.co
Hi everyone. My analysis done for my main timeframe m5. I start from higher timeframes D1, H1 and move down to lowest m5.
Futures contract for Brent crude , London exchange ICE 12-20
My trading is based on market phases by Wyckoff.

Brent Crude Oil - Weekly technical analysis updateMidterm forecast:
46.50 is a major resistance, while this level is not broken, the Midterm wave will be downtrend.
Technical analysis:
A peak is formed in daily chart at 44.15 on 09/18/2020, so more losses to support(s) 36.95, 33.80, 19.40 and more depths is expected.
Price is below WEMA21, if price rises more, this line can act as dynamic resistance against more gains.
Relative strength index (RSI) is 34.
❤️ If you find this helpful and want more FREE forecasts in TradingView
. . . . . Please show your support back,
. . . . . . . . Hit the 👍 LIKE button,
. . . . . . . . . . Drop some feedback below in the comment!
❤️ Your Support is very much 🙏 appreciated! ❤️
💎 Want us to help you become a better Forex trader ?
Now, It's your turn !
Be sure to leave a comment let us know how you see this opportunity and forecast.
Trade well, ❤️
ForecastCity English Support Team ❤️
Brent Crude Oil Ascending Triangle Pattern ?Ascending Triangle >> It is not an Investment Advice. It is for Tracking Purposes
Good Luck :))

BCO USD SELL (BRENT CRUDE OIL - US DOLLAR)Hi there. Price is forming a continuation pattern to the downside. Wait for the price to complete the pattern and watch strong price action for sell.

UKOIL BRENT Nose-dive to $32 and beyond?After the 2h 50 EMA crossed below the 200 EMA first time since May 05, 2020,
the 3h 50 EMA crossed below the 200 EMA on Sep 04, first time since May 07, 2020.
What exactly can stop oil from going diving back to low $30's ? More cuts from OPEC?
Winter coming to the Northern Hemisphere? Miracle vaccine ?
Doubt it. Let's see...

Brent Crude Oil - Weekly technical analysis updateMidterm forecast:
While the price is below the resistance 46.50, beginning of downtrend is expected.
We make sure when the support at 40.00 breaks.
If the resistance at 46.50 is broken, the short-term forecast -beginning of downtrend- will be invalid.
Technical analysis:
A peak is formed in daily chart at 39.56 on 09/14/2020, so more losses to support(s) 41.70 and minimum to Major Support (40.00) is expected.
Price is above WEMA21, if price drops more, this line can act as dynamic support against more losses.
Relative strength index (RSI) is 52.
❤️ If you find this helpful and want more FREE forecasts in TradingView
. . . . . Please show your support back,
. . . . . . . . Hit the 👍 LIKE button,
. . . . . . . . . . Drop some feedback below in the comment!
❤️ Your Support is very much 🙏 appreciated! ❤️
💎 Want us to help you become a better Forex trader ?
Now, It's your turn !
Be sure to leave a comment let us know how you see this opportunity and forecast.
Trade well, ❤️
ForecastCity English Support Team ❤️

wti crude oilthis thing is going long ... I would jump in if my account was large 10.00 lot size .. 100,000 in 2 days

CRUDE OIL Short to Target $20.00 by Christmas 2020.BRENT OIL 1 Week Chart, with Ichimoku Cloud.
So we all know from May this year that about $20.00 is the limit where OPEC & Russia will start holding hands and interfere with the oil price.
And you think about the below reasons, and look at the Weekly chart....
Reasons:
1. COVID - Economies around the world are NOT recovering to previous levels, LESS consumption by Industry.
2. COVID - More companies are adjusting to remote work, LESS driving, LESS gas consumption bu cars.
3. CHINA - China bought all the cheap available oil, latest prediction is that it would take 45 days just to use that stored oil
4. TANKERS - More tankers are available after they transported oil, More oil to go to floating tankers for storage
5. SAUDI ARABIA - Just had to lower its oil sale prices,
6. RUSSIA - Still eyeing a clash with Saudis
7. OPEC - Turns out UAE produced over its quotas, Iraq wants to be out of the limitations.
8. US SHALE - Some still have to produce, adding to the glut
9. AIRLINE INDUSTRY - Jet fuel consumption have never been this low, and doesn't seem it will be able to recover anytime soon.
Conclusion:
A SHORT position today ($41.35) with a STOP LOSS of $44.50, TARGET of $20.00...
And all in 15 Weeks before Christmas...
If the price breaks above $44.50, before Christmas, the trade is null.
*NOT an investment advice!*

Brent Crude Oil - Weekly technical analysis updateMidterm forecast:
. While the price is below the resistance 46.50, beginning of downtrend is expected.
. We make sure when the support at 40.00 breaks.
. If the resistance at 46.50 is broken, the short-term forecast -beginning of downtrend- will be invalid.
Technical analysis:
. There is a divergence in RSI and price between the peak at 43.315 on 2020-06-08 and the peak at 46.525 on 2020-08-26, the probability of uptrend continuation is decreased and the probability of beginning of downtrend is increased.
. The RSI support #1 at 55 is broken, so the probability of beginning of downtrend is increased.
. A peak is formed in daily chart at 46.50 on 08/25/2020, so more losses to support(s) 41.70 and minimum to Major Support (40.00) is expected.
. Price is below WEMA21, if price rises more, this line can act as dynamic resistance against more gains.
. Relative strength index (RSI) is 35.
❤️ If you find this helpful and want more FREE forecasts in TradingView
. . . . . Please show your support back,
. . . . . . . . Hit the 👍 LIKE button,
. . . . . . . . . . Drop some feedback below in the comment!
❤️ Your Support is very much 🙏 appreciated! ❤️
💎 Want us to help you become a better Forex trader ?
Now, It's your turn !
Be sure to leave a comment let us know how do you see this opportunity and forecast.
Trade well, ❤️
ForecastCity English Support Team ❤️

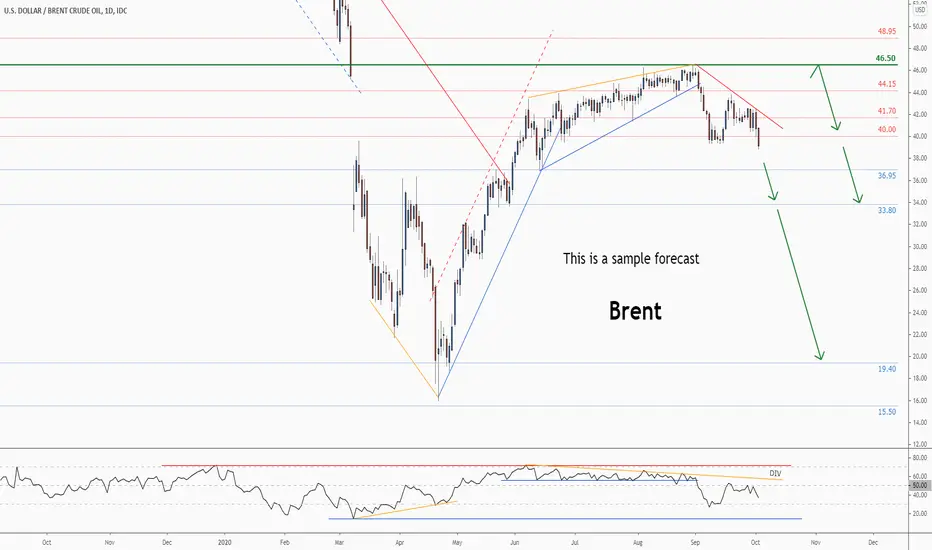
Brent Crude Oil - Weekly technical analysis updateMidterm forecast:
While the price is below the resistance 46.30, beginning of downtrend is expected.
We make sure when the support at 36.95 breaks.
If the resistance at 46.30 is broken, the short-term forecast -beginning of downtrend- will be invalid.
Technical analysis:
There is a divergence in RSI and price between the peak at 43.315 on 2020-06-08 and the peak at 46.32 on 2020-08-05, the probability of uptrend continuation is decreased and the probability of beginning of downtrend is increased.
While the RSI support #1 at 55 is not broken, the probability of price decrease would be too low.
A peak is formed in daily chart at 46.30 on 08/04/2020, so more losses to support(s) 41.70, 40.00 and minimum to Major Support (36.95) is expected.
Price is above WEMA21, if price drops more, this line can act as dynamic support against more losses.
Relative strength index (RSI) is 54.
❤️ If you find this helpful and want more FREE forecasts in TradingView
. . . . . Please show your support back,
. . . . . . . . Hit the 👍 LIKE button,
. . . . . . . . . . . Drop some feedback below in the comment!
❤️ Your Support is very much 🙏 appreciated!❤️
💎 Want us to help you become a better Forex trader?
Now, It's your turn!
Be sure to leave a comment let us know how do you see this opportunity and forecast.
Trade well, ❤️
ForecastCity English Support Team ❤️

Brent Crude Oil Important technical analysis updateMidterm forecast:
. While the price is below the resistance 45.00, beginning of downtrend is expected.
. We make sure when the support at 36.95 breaks.
. If the resistance at 45.00 is broken, the short-term forecast -beginning of downtrend- will be invalid.
Technical analysis:
. There is a divergence in RSI and price between the peak at 43.315 on 2020-06-08 and the peak at 45 on 2020-07-21, the probability of uptrend continuation is decreased and the probability of beginning of downtrend is increased.
. While the RSI support #1 at 55 is not broken, the probability of price decrease would be too low.
. A peak is formed in daily chart at 45.00 on 07/21/2020, so more losses to support(s) 41.70, 40.00 and minimum to Major Support (36.95) is expected.
. Price is above WEMA21, if price drops more, this line can act as dynamic support against more losses.
. Relative strength index (RSI) is 56.
❤️ If you find this helpful and want more FREE forecasts in TradingView
. . . . . Please show your support back,
. . . . . . . . Hit the 👍 LIKE button,
. . . . . . . . . . Drop some feedback below in the comment!
❤️ Your Support is very much 🙏 appreciated! ❤️
💎 Want us to help you become a better Forex trader ?
Now, It's your turn !
Be sure to leave a comment let us know how do you see this opportunity and forecast.
Trade well, ❤️
ForecastCity English Support Team ❤️
