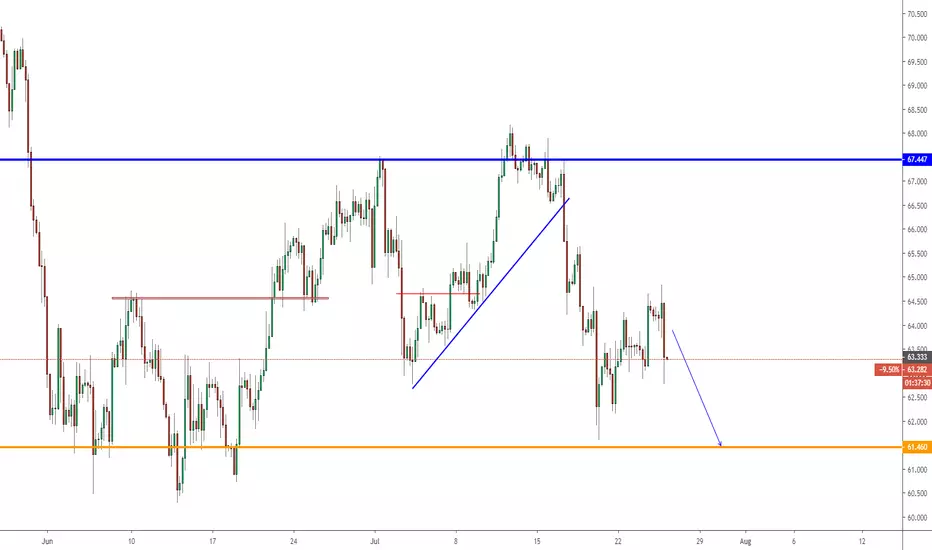
BCOUSD, Sell on H1.BCOUSD, Sell on H1.
H1:
- Test resistance D1 and move down
- Downtrend forming
- Tendency: Downward
- Below resistance and 2 EMA
-> Waiting re-test resistance
--> Give signal candle
==> Sell ( Continuous downtrend - Minor downtrend)
Brentcrudeoil

BCOUSD, Continuous downtrend on H4.BCOUSD, Continuous downtrend on H4.
H4:
- Structure: Downtrend
- Tendency: Downward
- Test resistance daily and move down
=> Sell

BRENT CRUDE OIL TO MONTHLY LOWSBRENT CRUDE OIL is continuing to form lower lows and lower highs on the daily timeframe. Oil
prices look bearish here with the monthly lows of 52.00 likely to be targeted for long term swing positions.
The daily chart suggests we could see a retracement back into the lows of 60.32 where we could see sellers
continue the downtrend.

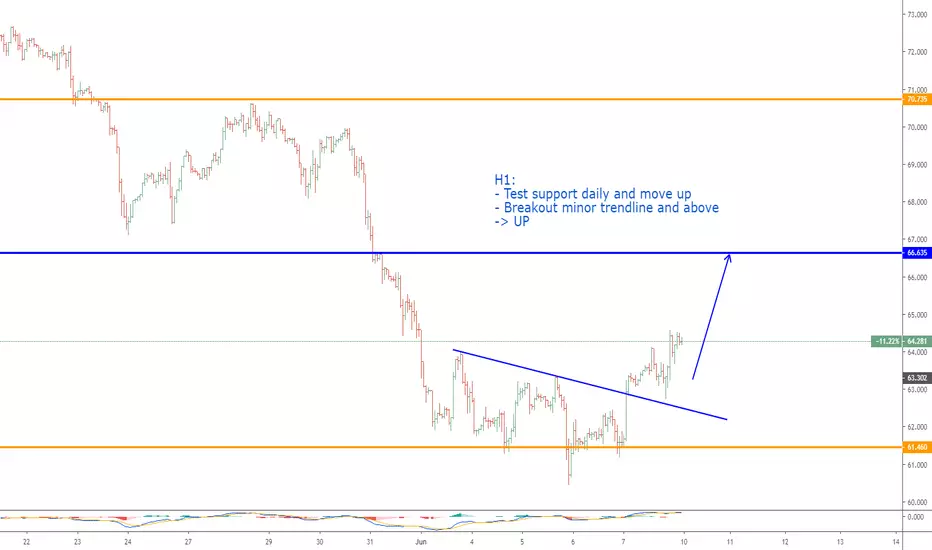
UK OIL UPSIDE PUSH TO FOLLOW?Hi fellow traders.
Looking at UKOIL right now, we can see that the RSI indicator has fallen towards the oversold region and is currently looking for a rally to the upside. Considering that UK Oil Supply is to remain the same, and with the UK Iran Oil Tanker tensions rising, it looks like UKOIL could look to push to the upside.
At this point in time 64.20ish would be an ideal buy in position region. I have been considering a buy position from 64.05.
Additionally, we can see that we could be rebounding from a critical support level at 63.90. In this case, it looks like it could be the perfect time to long this pair.
For a quick bullish squeeze out of this pair, the main ideal target would be around 63.56.
For a longer swing on this pair for a few days, looking from a bullish price action point of view, 65.00 region could be an ideal take profit region.
Stops should look to be placed around the previously mentioned critical support level of 63.90.
If you managed to read it this far down, thanks for reading this! If you could, please do offer your ideas & perspectives on this pair. Buy or Sell and why? Additionally, drop me your charts for it, that'd be great so I can see where you are coming from. I'm a new guy to the FX & Crypto market, trying to learn FX & Crypto, and I'd appreciate any help people may offer!
Please drop a follow! I need reputation points!!


BRENT CRUDE OIL - US DOLLAR SELLHi there. Price is forming a continuation pattern to the downside. Watch strong price action at the current price for sell.

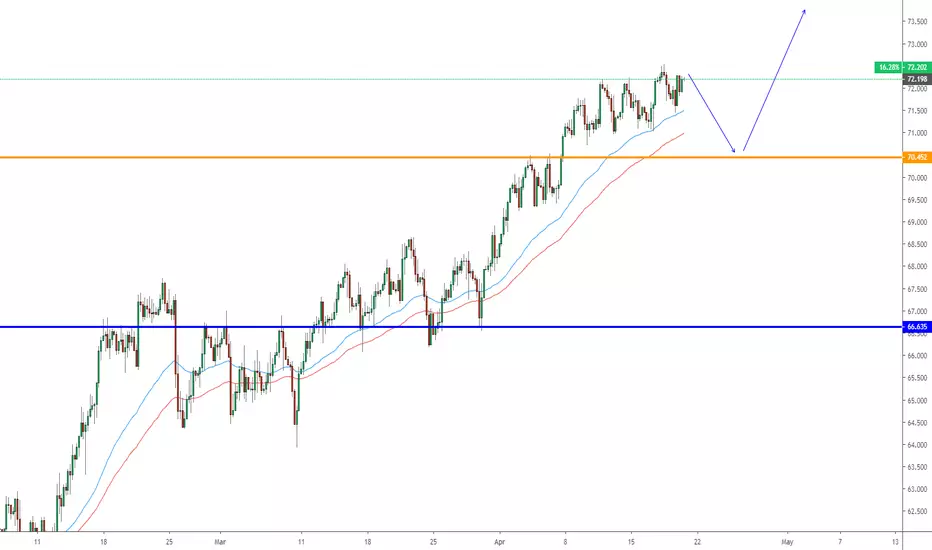
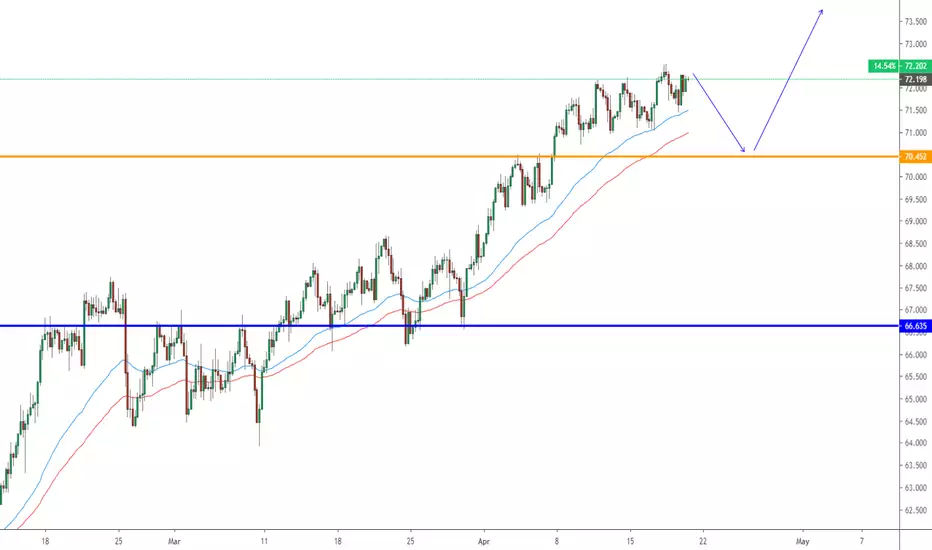
Brent Crude OilAfter a perfect bullish move Brent Oil has reached an area where is facing horizontal resistance, downtrend resistance and it is at the upper end of the uptrend channel.
I am foreseeing the price to come down to the lower end of the channel, at around 64.6 area where it will also be the lower end of the channel.
On the 4H chart I want to see a break of structure, marked by the black line, before going short. If the price holds above it might signal a price compression and that is a bullish signal.

BCO USD SELL (BRENT CRUDE OIL - US DOLLAR)Hi there. Price is moving impulsively to the downside. Wait for the price to complete the continuation pattern that its forming and watch strong price action for sell.

$110 oil coming soon?Looks like Brent Crude Oil could be headed to $110 soon as it seems to be on an impulse wave up.

BCO USD SELL (BRENT CRUDE OIL - US DOLLAR)Hi there. Price is forming a continuation pattern to the downside. Watch strong price action at the current price for sell.


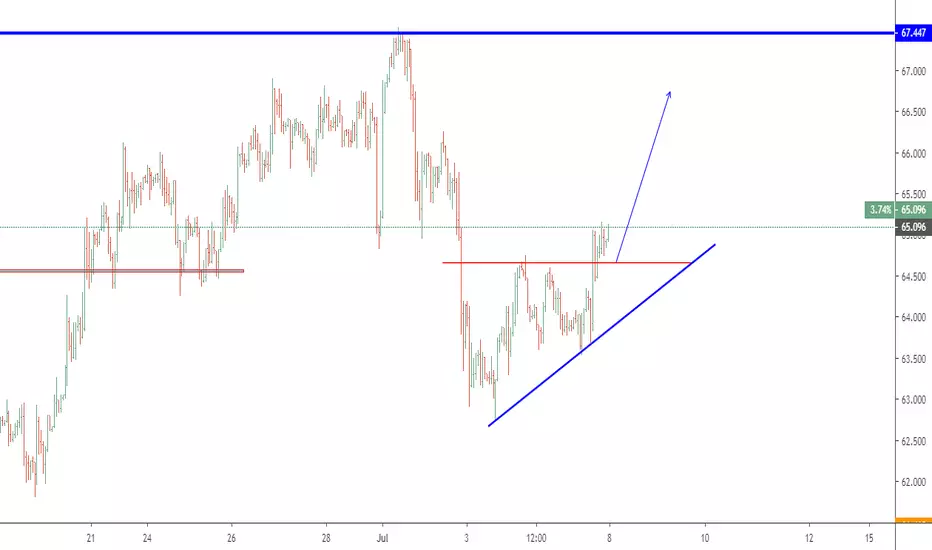
BCOUSD, Pullback: BUYBCOUSD, Pullback: BUY
H1:
- Test support daily and move up
- Breakout minor trendline and above
-> UP
Now Bulls are coming! Crude OilThe past month was super bearish. As looking at the past oil price is always take longer to climb up but it collapses in just a few days.
With the production cut from OPEC, I highly doubt that we will see below $50 again. Simple Fibonacci retracement shows below $51.5 is a full 61.8% retracement from the bullish run that started in December. It is better to fill buy order on the green area.

Brent Crude Oil futures bearish forecastBrent Crude Oil futures bearish forecast with new supply levels imbalances being created. Brent crude oil is correcting strongly after such a strong bullish move in the past months. Bullish impulses have become corrections and now there are a few daily supply levels created on the way down after such a strong rally.
Three supply imbalances have been created on Brent Crude Oil Futures around $74, $72 and $69. Price has not retraced to them but it did retrace at lower timeframe supply levels on the H4 timeframe.

UPDATE : BRENT LOOKS WEAK , BE READY TO SHORTbased on my previous projection ; brent oil can push for a little more upside but will fallback to 46-50$ / barrel range in Q3-2019.
for longer term : i'm expecting a very strong bull market. above 110$ in 2021.
good luck.


UKOIL READY TO PLUMMET!Hi traders!
Today, UKOIL has seen a move to the upside from 70.88 to 71.75.
1 of the following 2 scenarios could occur:
- Scenario 1: (ideal scenario)
As price has re-entered the daily and hourly resistance region highlighted in a pink/purple box at the top. Price has previously rejected from this resistance zone and on the 1H, there appears to be a double top candlestick pattern, giving way for some bearish price action. On the 14 day RSI, it seems to be oversold on both the 1H & 1D time frames. Additionally, looking back to November, this same resistance region acted as a support region for this pair, before snapping and paving the way for a huge sell-off. This gives space for a move to the downside. This would mean price could head down, ideally to the 61.8% of the Fibonacci Retracement tool, around 71.14 and then it could drop below. I would look for price to first move to the downside before considering any real targets, once 71.14 is taken out. We could really see price hit the red trend line drawn, as it has been some time since it last melted down and bounced off that line.
- Scenario 2:
If the resistance region highlighted is broken, price could easily spike to the upside, towards 71.80 and beyond. I would recommend a tight stop loss just above the resistance zone highlighted at the top. If price breaks the resistance level it has previously rejected from, this pair does have space to just rocket up.
If you read it to all the way down here, thanks for showing some support to this article! Tell me where you think UKOIL will be heading next! Comment below all your ideas about the future of the UKOIL! Buy or Sell and why? Additionally, drop me your charts/ideas for it, that'd be great so I can see where you are coming from. I'm a new guy to the FX, Stocks & Crypto market, and I'd appreciate any help people may offer!
Please drop a follow/like! I need reputation points!
