BRENT CRUDE OIL FUNDAMENTAL ANALYSISOil prices have remained under pressure over the past month, with Brent crude falling 13.6% amid recession fears in the US and weaker-than-expected economic data out of China. Still-elevated Russian exports and the sizable inventory build at the start of this year due to a milder winter in the Northern Hemisphere have also played a role.
We now see the Brent price reaching USD 95 a barrel by the end of this year, down from our previous forecast of USD 105/bbl, as we expect Russian oil output to stay at around 9.6 million barrels per day (mbpd) instead of 9mbpd in the second half of this year.
However, this means an upside of over 25% from current levels. We still see several main reasons to expect the oil market to be under supplied in coming months:
The International Energy Agency sees robust global oil demand. In its latest monthly oil market report published this week, the Paris-based agency raised its forecast for global 2023 oil demand by 100,000bpd to 102mbpd. It also anticipated tighter market balances in the second half of the year, “when demand is expected to eclipse supply by almost 2mbpd.” While our own forecast puts current global demand at around 101mbpd, we see higher demand in June, boosted by the driving season in the US and more oil being used to generate power to cool down buildings in the Middle East. In fact, we expect the oil market to be undersupplied by nearly 1.5mbpd next month.
Inventory draws are set to be more visible in the months ahead. The US Department of Energy said earlier this week that it plans to purchase 3 million barrels of crude oil for the Strategic Petroleum Reserve for delivery in August, after a record sale last year that pushed the level of the reserve to the lowest since 1983. It remains to be seen whether the tender will be concluded, but we expect to see larger inventory draws as the Northern Hemisphere enters summer while the impact of strategic oil reserve release fades.
OPEC+ cuts should tighten the market further amid other supply constraints. The voluntary output cut by nine OPEC+ members this month should continue to tighten the market, while wildfires in Canada’s primary oil-producing province Alberta has forced shutdowns of oil and gas production. Iraq’s total oil exports this month are also likely to be limited amid continued suspension of production in the north. We anticipate oil production will fall back toward 100mbpd in May from around 101mbpd in 1Q23.
A tighter market should convince financial investors to return to the oil market, thus supporting prices. So, we maintain our most-preferred rating on oil alongside our positive stance on broad commodities. We continue to advise risk-taking investors to add long exposure via first-generation indexes or longer-dated Brent contracts, or to sell Brent’s downside price risk. We also see value in emerging market energy bonds for an attractive yield pickup versus developed market government and investment grade debt.
Brentcrudeoil

UKOIL D1 AnalysisPossible Reversal H&S.
We except higher prices as we analyzed before.
Have a look at our previous analysis, link below👇

Brent Crude Oil Swing TradeThe price of Brent Crude Oil has fallen and tested the previous support level (Blue Line) outlined in the previous newsletter. Currently, we could see a potential swing back upwards. If the price breaks the support level, we could see a fall in price. However, I see the former as the more likely scenario, as the 0.5 Fibonacci level (Green Line) is also below the trendline - providing further support.
This support is further backed by the Stochastic RSI and MACD indicator coming to show potential buy signals.
To see why I chose these support and Resistance Levels see my linked idea below.

Weekly Price Projection for Brent Crude Oil W/C 17th April 2023Price Range Projection:
Weekly High: ~ $86.58
Weekly Low: ~ $82.818
In the chart above, you can see the price on the 3-hour timescale, along with a fixed range volume profile.
Weekly High Projection
The fixed range volume profile (the horizontal histogram) is an indicator that can be used to show resistance and support levels. The red horizontal line in the close-up chart above indicates the point of control, which is the price level that had the most volume. As you can see, the price stalled around this point. This is where I see the weekly high.
Weekly Low Projection
I have placed the weekly low at a previous support level, which was formed from a chart pattern that had a breakout more than a month ago. This is shown with the two blue trendlines.

Petro Dollar - A controlled Demolition 🇺🇸 🛢 💸 Petro-Dollar chart to illustrate the inevitable collapse of the current world reserve currency:
The U.S. needs cheap oil prices for the dollar to remain competitive globally and to retain the world reserve currency status 🇺🇸 🛢 💸
They accomplish this by controlling oil production globally, flooding the market with oil products, while synthetically increasing our reliance on the product.
When oil prices get too high, it taxes other countries who need to trade their currency for dollars in order to buy oil 🛢 making these dollar transactions very expensive.
If oil prices can't be negotiated lower, then they need to cause a financial crisis to weaken the dollar to make it cheaper to transact in. They create this liquidity by inflating the currency 🖨 i.e. "Quantitative Easing."
If Trump & the BRICS Nations cut ✂️ the oil supply, the FED would soon bleed out as the dollar melts upward and runs out of liquidity. They'd be forced to cause yet another collapse and hyper-inflate the dollar away 💵 to make transacting in it competitive again. Risk assets would soar under these conditions, ending with the pop of the everything bubble.
The Great Reset.....
a planned demolition.

UKOIL🛢️ macro movesBrent Crude Oil : Multiyear(2015-2022) inverted Head and Shoulders triggered at the beginning of this year. Price broke the major downtrendline and subsequently iH&S neckline at 87 (lime) and then skyrocketed to 138. Now pulling back down to the neckline. We could actually see the backtest of the major downtrendline and dip into the S/R Zone 76-68. This would be great buying opportunity. Price shouldn't get much below right shoulder (65.8), otherwise the setup would be invalidated. Will set SL to 60, Target 157.
Check my other stuff in related ideas.
Please boost🚀, comment🗣️, follow me✒️, enjoy📺!
⚠️Disclaimer: I'm not financial advisor. This is not a financial advice. Do your own due dilingence.

Brent: In the Jungle 🌳🌴🎍Wimoweh, wimoweh, wimoweh, wimoweh
Wimoweh, wimoweh, wimoweh, wimoweh
Wimoweh, wimoweh, wimoweh, wimoweh
Wimoweh, wimoweh, wimoweh, wimoweh
In the jungle, the mighty jungle
The lion sleeps tonight,
In the jungle the quiet jungle
The lion sleeps tonigh
Wee heeheehee…–
… – okay, let’s stop here before we won’t be able to get this song out of our heads. We should rather take a look at Brent, which has advanced deep into the dark green jungle between $77.13 and $42.20 and has left the mark at $75.09 behind. We hope, the course has taken a sharp machete along, as we expect it to penetrate the scrub further – ideally until the 61.80%-retracement at $62.71. There, it should complete wave 2 in green and subsequently turn upwards again.

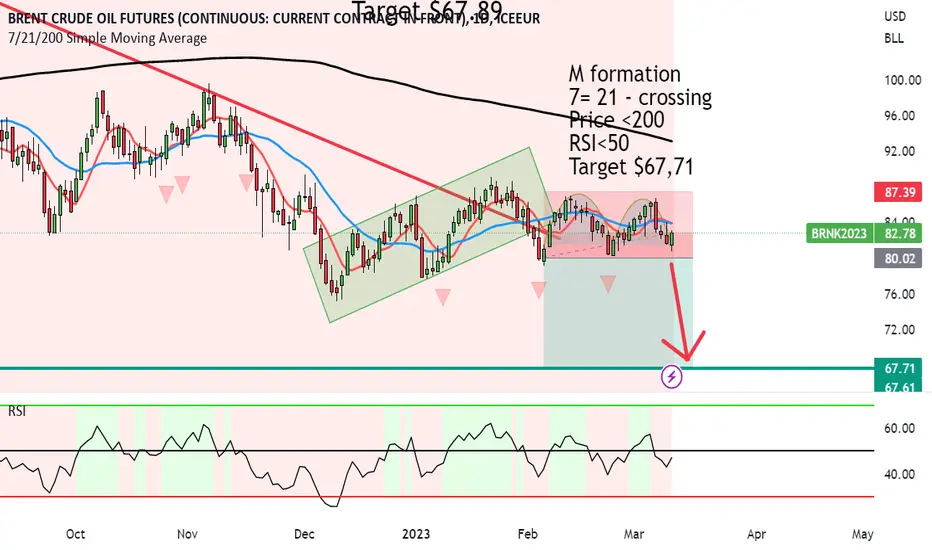
Brent showing two strong bearish patterns to target $67.71M formation has formed over the Rising Flag.
This confirms not one but 2 bearish patterns in the making.
There is a strong chance of the price coming down. and we have other indicators confirming.
7= 21 - crossing
Price <200
RSI<50
Target $67,71
USOIL - CRUDE OIL Investment & Uses🛢⛽Hi Traders, Investors and Speculators of the Charts 📈📉
Oil gets a bad rap these days, but the stuff is actually quite incredible. Many people think of crude oil as a thick, black liquid that is used to source our unquenchable thirst for gasoline and suffocate marine life. Although this isn't untrue; the reality is that each barrel of oil is refined to be used in a variety of applications that includes fuel, cosmetics, plastics, rubber, and candle wax.
Recently I saw many news outlet's post on the price of crude oil at their economic section. the sentiment was the same - buy. The reasoning was that oil will become more scarce in coming weeks and therefore, the demand will increase. Unsurprisingly, the price of oil has gone DOWN. These are usually coordinated traps in the market, and it's best to counter trade when the media is going with one sentiment.
The price of oil is declining seriously, with strong bearish pressure at $82. We see a nasty double top in the weekly, and I'll be looking for an entry between the support zone pointed out on the chart.
So, why consider oil as an investment?
The truth is, oil isn't going anywhere, any time soon. This is a commodity with a broad use case, and if you plan your trades, low risk trades with good profits can be made.
Here is everything that can be made from just one barrel of oil: 🛢
🚗 Enough gasoline to drive a medium-sized car over 450km (280 miles)
🚛 Enough distillate fuel to drive a large truck for almost 65km (40 miles)
⛽Nearly 70 kWh of electricity at a power plant generated by residual fuel
💥 About 1.8 kg (4 lbs) of charcoal briquettes
🏕 Enough propane to fill 12 small (14.1 ounce) cylinders for home, camping or workshop use
🚧 Asphalt to make about 3.8 L (one gallon) of tar for patching roofs or streets
⚙ Lubricants to make about a 0.95 L (one quart) of motor oil
🎂 Wax for 170 birthday candles or 27 wax crayons
But that’s not all. After producing all of the above products, there’s also enough petrochemicals leftover to be used as a base for one of the following:
👩👧👦 39 polyester shirts
👩🦰 750 pocket combs
😁 540 toothbrushes
🧺 65 plastic dustpans
⭕ 23 hula hoops
🧃 65 plastic drinking cups
🥛 195 one-cup measuring cups
☎ 11 plastic telephone housings
🥎 135 four-inch rubber balls
The above serves as one example of how a single barrel could be used, but here’s a list of many other oil applications. It includes everything from guitar strings to antihistamines. Whatever your opinion is on fossil fuels, it’s still pretty astonishing what can be produced out of each barrel of oil.
Here's a nice infographic to visualize :
_______________________
📢Follow us here on TradingView for daily updates and trade ideas on crypto , stocks and commodities 💎Hit like & Follow 👍
We thank you for your support !
CryptoCheck

Brent showing a further plummet to $67.89 Rising Flag has formed after the downtrend with Brent.
The price has broken below the rising flag which confirms bearishness.
200 > 21 > 7 - Bearish
RSI <50
Target $67.89
FUNDAMENTALS:
We've seen the US Dollar start to strengthen a bit which is can continue to do so for the next few weeks.
A strengthening US dollar can cause Brent crude price to drop because oil is priced in dollars. When the value of the dollar increases relative to other currencies, it makes oil more expensive for buyers using those currencies, which can result in decreased demand and lower prices. Additionally, a strong dollar can also make it more attractive for investors to sell commodities, including oil, in exchange for the higher-valued currency, putting downward pressure on prices.

Brent: Wax your Skis ⛷️Brent accomplished the climb above the $86.06-mark and should continue to rise to finish the blue wave . Once completed, we see the course heading for a steep downwards slope to dip right into the green target zone between $77.13 and $42.20. Within the target zone, we expect the Oil to sink further to end the blue wave around the $62-mark, before rising back North to wrap up the blue wave . Followed by another correction, the course should dig deeper and get closer to the bottom of the green target zone, in order to finalize the green wave .

UKOIL and two high targets.UKOIL will touch 170 and after pullback will hit 203.
RSI is in best condition.

🛢Brent oil: wave III target remains $150+●● Preferred count
● CFDs on Brent Crude Oil (TVC) , 🕐TF: 1M
Fig.1
The three-wave movement within the framework of wave III of (V) is not completed. The minimum target is the same — to exceed the wavelength of wave II , which will lead to a rise in the price to $ 150+ . The subsequent wave IV will return the price to the current levels.
______________________________
● Brent Crude Oil (OANDA) , 🕐TF: 2D
Fig.2
From July 2022 , a correction Ⓧ is predicted.
Upon completion of the consolidation in wave (B) , a decline will follow within wave (C) in the form of an impulse. This forecast is based on the norm of the alternation of waves " A " and " C " within a zigzag.
______________________________
● Brent Crude Oil (OANDA) , 🕐TF: 4h
Fig.3
Correction (B) is expected to take the form of a triangle, but other sideways correction are not excluded. The option of counting in the form of a triangle is schematically indicated by a red dotted line. Black color marks an alternative count with a completed wave (B) in the form of a running flat. With the breakdown of the top of wave B , the activation of the alternative marking will follow.
📚 Elliott Wave Guide & Ellott Wave Archive ⬇️⬇️

Brent Crude Oil TargetsBrent oil, which has been in a downtrend for weeks, will break the trend if it closes this day above $86. If it continues this movement with volume, the target of $ 98 will be valid. As long as it stays above the $84 support, the positive outlook will continue.

Brent Crude Oil: Potential for a further corrective move higherCurrent price remains below its 40 week moving average (200 days) which indicates that the longer term trend is lower (100 days or more), however, the scope for a further near term (25 to 50) corrective upside rally from the November high - December low remains on the table, provided the key resistance near $85.05 can be overcome for prospective extension move towards the $91.66 (50% retracement from the 52 week high/low); downside risk seen near the $78.3 support.

BRENT CRUDE OIL BULISH PATTERNDemand for crude oil is expected to rise after a cold wave hit USA, which will likely increase the demand for oil distillates, easing of the COVID measures in China and US crude oil inventories coming up less than the analysts have had expected.
British crude oil benchmark, BRENT, had broken the resistance of the triangle pattern, a strong bullish predictor, and the price might reach levels of 87.5 in the next couple of days. In an event of reversal of the trend, the price might reach levels of its previous low of 75.35
RSI and MACD both are confirming the bullish outlook, with MACD histogram above 0 and rising and RSI rising as well and approaching the 50 neutral line.
Risk Disclosure: Trading Foreign Exchange (Forex) and Contracts of Difference (CFD's) carries a high level of risk. By registering and signing up, any client affirms their understanding of their own personal accountability for all transactions performed within their account and recognizes the risks associated with trading on such markets and on such sites. Furthermore, one understands that the company carries zero influence over transactions, markets, and trading signals, therefore, cannot be held liable nor guarantee any profits or losses.

Brent: Christmas Miracle ✅🎄We're finally seeing green! After waiting the whole year for Brent to reach the green target zone between $77.10 and $42.16, our British friend finally came through! We're expecting the course to sink a bit further to finish off green wave before heading back North above the $80.79-mark.

cadjpy, longAs you can see in the chart, due to the weakness in the decline and the reaction to the support level, I expect an upward correction first, and then I will update the analysis if there is a reaction to the resistance level.
Stay with me to get more analysis after following me by sharing with friends and leaving a comment.
According to my risk and capital management system, the risk of each trade is one percent per position.
What do you think about this analysis and other analyses?
What symbol would you like me to analyze for you?

USOILBeen charting this move since mid July 2022, we are getting close to a bottom IMO, currently
testing the bottom TL of the mega phone pattern.
Now looks like a support flipped into resistance.
Targets remain $45-$55 for a bottom and likely big bounce from there. Which is the 618% from the covid 2020 crash when prices went negative.

Brent Crude Oil Simple Chart AnalysisBrent Crude Oil - Seem supported if we draw a 2 red arrow there. If this area indeed supported & rebound, we will see our KLSE energy moved. Might retest 100 as resistance here.
Risk side, it might just be a technical rebound here cause there are no red chip aggressively appearing.

Brent is in nomans landRectangle Formation has formed on Daily and it's anyone guess where it's going.
On the bearish side, 3 Black Crows candles have formed as the price touches the medium beartrend line.
We need to wait for a breakout before we do anything...
Bull $120
Bear $67.65

Brent Crude weaknessTVC:UKOIL is back at the previous support level. Will it find support again? If $85-ish fails then $76-ish becomes the next potential support level.
What does this mean for JSE:SOL NYSE:SSL ?

POtential Ascending Triangle on Brent Crude to $122Potential Ascending Triangle on Brent Crude forming. We are just waiting for the price to break up and out of the resistance and then the first target will be around $122...
Moving Averages look good 7>21 <200
