Brent: Down, Down! 😈😈😈We are still waiting for the Brent Crude to drop and approach its yellow trading zone. Here, we expect a massive turnaround, followed by long-term increases in the price. However, direct increases are possible, too, if the course reaches above $76.12.
Stay patient!
Brentcrudeoil

Just A BIG BEAR!!!Look at price reactions to the RSI level 70,. in the 4-hour time frame. If we do not consider Price and fundamental reasons, such as coronavirus news, And only consider the price reaction to RSI 70, Again, the amount of correction, as in previous times, is so considerable that it cannot be ignored


Climbing Oil Price Range 2021As we enter the 4th quarter of 2021 we see that some countries are imposing strict measures to curb Covid-19. At the same time, restrictions are loosening. thus, allowing economies to demand more oil to fill the need for increased economic activity. We can see that oil has remained in a steady climb with price making small fluctuations. But the trend is bullish as economic activity picks up as travel restrictions are loosened. As can be seen in the chart, there are events that effect the oil price like rebel strikes against Saudi oil facilities. Also, China has added extra inspection measures at its ports which affected the oil price negatively.
I see oil ascending further as global economic activity picks up and restrictions loosened.
Disclaimer: There are amateur opinions.

Oil is on a daily downtrendThe general trend in daily time seems to be declining.
But now it seems to be a good place to enter the hourly time.
The new support level seems to be broken and the return to the new resistance level is complete and it is time to fall.

Brent Crude Oil 1-day classic patternsQ: What has the highest probability of occurring?
Since February 2021 price has been stabilising on $65 per barrel.
There is a combination of 2 classic patterns forming at 65.00 support.
The inverse head & shoulders, which is in the process of forming the right shoulder, is currently invalid.
This pattern projects 85.25 as the target.
The double bottom, having recently tested and rejected 65.00, would need to breakout from 76.50 to be validated.
This pattern projects 52.00 as the target.
Objectively looking at 65.00 support the two high volume bars appear to be putting the weight in favour of the formation of the double bottom following the ~15% correction.
Since the double bottom is not validated so the current position is neutral with a bias in favour of the uptrend continuing.
It is worth paying attention to the high of the left shoulder at ~72.00 and how the bulls and bears interact as validation of the double bottom is required at 76.50

Ascending correction and descending returnOil is in the daily trend of correction
In general, the $ 2 climb today is considered a correction, and the target for oil prices this week is $ 64.
Oil is in the daily trend of correction
In general, the $ 2 climb today is considered a correction, and the target for oil prices this week is $ 64

💌 BRENT - Inflation and Geopolitics 🕊️🌎''One way to control inflation is to have cheap Oil around'' the Fxprofessor
News:
Brent crude oil price down below $67 per barrel on London’s ICE first since May 24
The price of WTI oil also went down by 2.52%
MOSCOW, August 19. /TASS/. The price of futures contracts of Brent crude oil for October 2021 delivery went down by 2.18% on London's ICE on Thursday to $66.99 per barrel, diving below $67 per barrel for the first time since May 24, according to the trading data as of 10:00 am Moscow time.
As of 10:25 am, the price of Brent oil was down by 2.11% compared with the previous closing at $66.79 per barrel. Meanwhile, the price of WTI oil was down by 2.52% at $63.53 per barrel.
The MOEX Index was down by 1.35% at 3,872.18 points, while the RTS was down by 1.74% at 1,645.99. The dollar’s exchange rate was up by 0.45% at 74.14 rubles, while the euro’s exchange rate was up by 0.09% at 86.55 rubles.
Geopolitics:
If prices of Oil and Natural Gas are TOO high, Russia is becoming TOO dangerous (in the eyes of Americans, not in my eyes. In my eyes Russia and America should be best friends and fix this planet💌☮️🕊️🌎).
-Russia is the world's largest producer of crude oil (including lease condensate) and the second-largest producer of dry natural gas. Russia also produces significant amounts of coal.
- In early June, when Brent climbed above $70 per barrel, Russian Deputy Prime Minister Alexander Novak said the oil price reflected the balance of supply and demand and was “good enough” for Russia.
Tell me what you think.
the FXPROFESSOR

Breaking: The OPEC report is issuedOPEC monthly report was issued a few minutes ago, and the report was not positive for OPEC+ and the oil-producing countries within the group, led by Saudi Arabia. OPEC kept its forecast for oil demand in 2021 unchanged at an increase of 6 million barrels per day, bringing the average to 96.6 million barrels per day, and also kept its forecast for the growth of oil demands in 2022 by 3.3 million barrels per day, bringing the average production to 99.86 million barrels per day.
While OPEC+ raised its expectations for an increase in the production of oil-producing countries outside the group by 840 thousand barrels per day, to reach an increase of 2.9 million barrels per day, with a total average of 66.9 million barrels per day in 2022.
It also raised its forecast for the production growth of oil-producing countries outside the group in 2021 by 270,000 barrels per day to reach 1.1 million barrels per day, with a total average of 64 million barrels per day.

Brent Crude Oil. Wave (b)(Yellow). "May" reach 9.00 ?! 20/7/21For Oil Related Stocks.. Brent Crude Oil / UKOIL possible reaching its multi year top and forming an expanding flat pattern on its Super Cycle wave which is Wave (b)(Yellow) where price of Brent Crude Oil Could Oil Could reach at around 9.00 ?! as 1)Major Demand Zone 2)The Lower Trend line of Wedge Pattern .3) Pitchfork Line Support .

Technical Analysis: Brent oil bulls aren’t out of the woodsBrent oil struggles to keep bounce off 200-SMA above $76.00 as sellers attack 50-SMA amid early Monday. However, MACD is about to positive while RSI is strong as well, not to forget the black gold’s sustained trading above the key SMA. Hence, oil buyers are bracing for a leap towards the monthly resistance line around $79.00, which in turn will refresh the multi-month high. In doing so, the latest high surrounding $76.30 and $77.50 may entertain energy optimists. Should the Brent bulls keep reins past $79.00, the $80.00 psychological magnet will be a tough nut to crack for them.
On the downside, a clear break of $75.80, comprising 50-SMA, will direct short-term sellers towards 200-SMA support of $73.38. However, any further weakness needs to conquer a horizontal area from June 03, around $72.10, to recall the oil sellers. Following that, May 18 swing high near $70.30 may offer an intermediate halt during the fall to the $70.00 threshold and $69.00 support levels. Overall, Brent oil remains on the bullish trend and any pullback above $72.10, can be considered a buying opportunity.


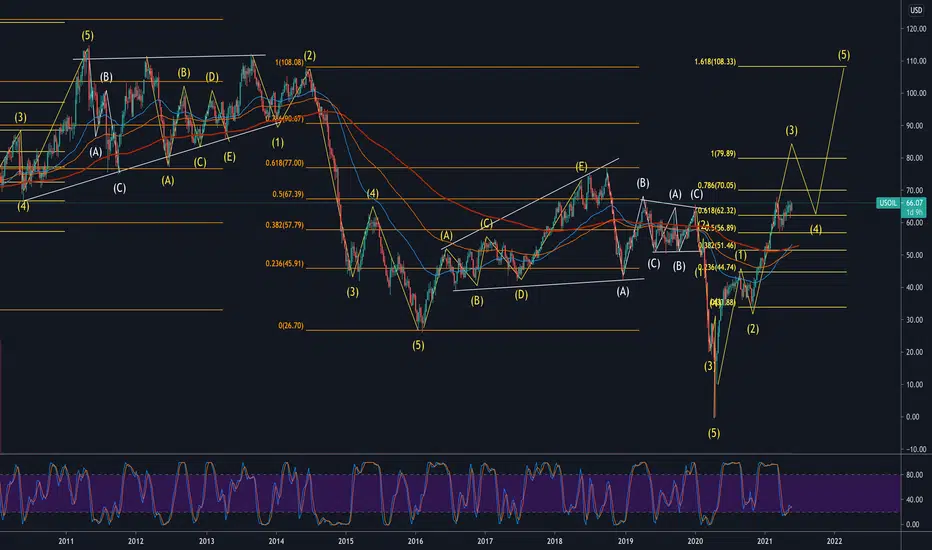
USOIL#usoil long term weekly chart. I think we are heading to somewhere around $80 to complete wave 3 b4 the wave 4 pull back then finally finishing wave 5 at $108
Brent: Where are the Bears? 🐨🐨🐨As regards the oil market, we are still waiting for the bears to fight back and pull the price under $64.56 and $60.26, respectively. By doing so, they’ll enable us great entry chances for the upcoming bullish run which we expect to reach way above $80 in the longer run. Only a premature breakout above $71.36 would make us change this scenario.
Keep trading!

Brent Oil - ConsolidationAfter strong friday Brent is facing some downside. In expectation further plunge a double top is in.

15% Move for Brent Oil Brent Oil trading within the Apex we are soon to
get a breakout or breakdown .
As detailed on the chart we can see that the .75 Fib has been
a Strong support for Brent since December 2020 and is still respected .
With that said we have a measured move of around 15 percent for this to extend
its uptrend into the 80 dollar zone or retreat back to the 56 Dollar level where we can expect support to hold .
Like and Follow for Daily Analysis , signals and to see or hear my perspective .
Know your Invalidation and Trade With a Plan .
PLEASE NOTE THIS PERSPECTICE IS BASED UPON TECHNICAL ANALYSIS ONLY
I DO NOT FOLLOW ANY GEO POLITICS THAT OF COURSE CAN EFFECT THE OUTCOME
SHOW ME THE CHART AND I WILL TELL YOU THE NEWS IS HOW I WORK

OIL Daily - Pulled into buy zone ... waiting confoReversed off overhead resistance into our 65 buy zone. Would like to see daily bullish candle to confirm support. Bull flag still in play

BRENT CRUDE OIl short setupHy trader
good mood and profitable deals!
Analysis:
3-way deathcross
continuation pattern
Set up:
Short
Trigger breakout, bullback
Wait for the triangle breakout until the 4h candle closes under the pattern, or trade the bullback!
Keep in mind that things can change!
If you like this idea support me with likes and comments!


Brent Crude has peakedBrent Crude looks like it needs a retracement after its stellar recovery. On the weekly chart we can see that its overbought on all three signals. Oil producers need the price to stay above roughly $40 a barrel. In a controlled environment with limited exogenous impacts the price of oil should stay above $40 a barrel. That being said, $70 a barrel isn't going to work for the non-US consumer.
By early April we should see the chart reflecting a healthy retracement.
Oil producers have benefited from the recovery in the oil price and the increase in demand post lock downs. Perhaps now is the time to take profits or close out one's position in the oil industry.
Please note, this idea is shared for educational and discussion purposes only and should not result in speculative investment decisions in any asset class.

