Energies Weekly ReviewFirstly, please support our work by clicking like button & or following! These really assist us to reach more investors & traders like you!
Natural Gas remains the top performer regardless of subdued demand on the global markets. Oil rallied on increased geo-political risks
in the Middle East, when a port in the city of Beirut was flattened out by an explosion. However, as the week progressed prices corrected onto the downside.
Brentoil


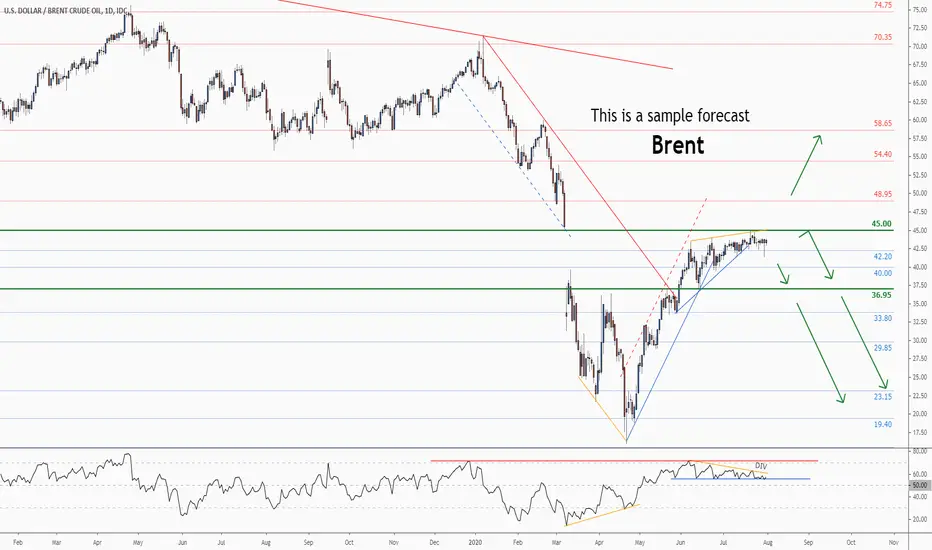
Brent Crude Oil Important technical analysis updateMidterm forecast:
. While the price is below the resistance 45.00, beginning of downtrend is expected.
. We make sure when the support at 36.95 breaks.
. If the resistance at 45.00 is broken, the short-term forecast -beginning of downtrend- will be invalid.
Technical analysis:
. There is a divergence in RSI and price between the peak at 43.315 on 2020-06-08 and the peak at 45 on 2020-07-21, the probability of uptrend continuation is decreased and the probability of beginning of downtrend is increased.
. While the RSI support #1 at 55 is not broken, the probability of price decrease would be too low.
. A peak is formed in daily chart at 45.00 on 07/21/2020, so more losses to support(s) 41.70, 40.00 and minimum to Major Support (36.95) is expected.
. Price is above WEMA21, if price drops more, this line can act as dynamic support against more losses.
. Relative strength index (RSI) is 56.
❤️ If you find this helpful and want more FREE forecasts in TradingView
. . . . . Please show your support back,
. . . . . . . . Hit the 👍 LIKE button,
. . . . . . . . . . Drop some feedback below in the comment!
❤️ Your Support is very much 🙏 appreciated! ❤️
💎 Want us to help you become a better Forex trader ?
Now, It's your turn !
Be sure to leave a comment let us know how do you see this opportunity and forecast.
Trade well, ❤️
ForecastCity English Support Team ❤️


Crude Oil Elliott Wave IdeaAs posted by a fellow EW technician Aibek a little while ago on Brent, WTI looks to be forming an ending diagonal.
The lower trendline has been hit and there is bullish divergence on 4H timeframe (the same divergence that kick started the move from $39 to mid $42) so the 5th and final wave could have already started.
The 0.618 extension of wave 2/3 is at $43,07 and the 0.618 extension of wave 1/3 is at $43,97.
If it is an ending diagonal there could be a considerable fall once it completes.

United States OilFUNDAMENTALS:
Ever since the reverse stock split back in April of this year, this chart has become problematic in future price discovery. I have no skin in this, but I want to take on the oil markets as a challenge to myself to focus in on the global markets, and how political shenanigans play a factor in the price of oil. Just keep in mind what drove the prices of oil down this year, and think about the coming presidential election. That will be your unknown variable to the fundamentals in the price.
TECHNICAL ANALYSIS:
I have chosen the daily time frame for this chart since it has done the reverse stock split that has complicated the price ranges. I have found that the price is possibly forming an ASCENDING TRIANGLE or a PENNANT. This pattern I have outlined in white lines. There WILL be a breakout of this pattern in the coming days or weeks. A break below will happen based on the fundamentals of the global economic, and the fear virus.
A break above this pattern will allow the price push higher and retest the orange lines.
Remember, I am not your financial advisor, and I am not legally qualified to give advice or tell you what to do with your money. Do your own research.

Brent Crude Oil - Trends of Support & ResistanceHere I have laid out historical trend lines that prove previous support, and resistance prices. Using technical analysis to predict the future price of Brent Crude Oil is only one variable to the equation. I believe that the most important factor for future price discovery will be the global fundamentals. The United states of America is coming up on a presidential election. This is very important for future production.
I have mapped out the price levels I expect to see resistance, and support. The orange horizontal lines are the areas I would take profits. Brent Crude is currently testing resistance between the price of 45-47 dollar range. Day traders and swingers (Lol) may be setting up for shorts going into the weekend. Long term, based on previous trends I would expect a push back up to the upper 86.00 dollar region.
This is not financial advice, and I am legally able to tell you what to do with your money. these markets are extremely volatile during the election years, and the rise of the fear factor pandemic. Trade safe, and use stop losses, and do your own research into the fundamental factor that will impact this asset.
"Ju$t Follow The Money Matrix."


CRUDE is Back up on Major Key Level, Whats Next?Welcome to Profitlio Trading!
What's up traders! Thanks for Jumping back on my Analysis, 👨💻 Trader champ is here on your Service, Also hit thumbs up 👍 and support the work
Thanks for all the support! Sketch up your own trade setup and make sure you meet with the required confirmations first before you make your move!
⭕️ ✅ Scroll Down 👇 ⬇️ to signature section for 📲 contact details 💰💰💰
Profitlio Trading ( Since 2014 in Financial Markets )
________________________________________________
Traders Disclaimer: Non of our analysis or trade setups being shared here on trading view is a trading advice. As we keep on weekly updates with our predictions and expectations. We may take them as a trade only if trade setup meets the required criteria ( Confirmations ). Unless we will never take them as a trade if it never reach our trading requirements.
Take them at your own risk as trading is highly risky and you may loss your investments. Our trades are based on Swinging and Mid to long term approaches. All trades executed will be handled under the name of Profitlio Trading only.

Brent crude oil BCO - Make or Break at $44Ascending triangle pattern (tightening volatility) suggests a breakout sooner rather than later

USDCAD H4 OUTLOOK! (OIL RELATED CURRENCY PAIRING)Good day trader, I hope you guys are having a great day and doing well in trading.
Let's talk about USDCAD, on H4 chart, we can see that USDCAD is in a consolidation process. Price has not been able to break above 1.372 and couldn't break below 1.349 starting early of June 2020. Therefore, we will be looking closely at the price action right now, a break of 1.372 (Case 1) will expose the price to much higher territory while a break of 1.349 (Case 2) will expose the price towards daily support as indicated in the chart.
Fundamental wise, oil stockpiles have dropped 7.5 million barrels which mean the demand of oil is started to immerse. This news is particularly good for both USD and CAD since US and Canada have produced more oil than other countries.
As of now, we will be waiting for the price to break below 1.349, if H4 candlestick closed below the consolidation demand zone, we will be looking for short setup.
Always go for a clear analysis and always control your own risk management. It's not about you versus the market, it's always you versus yourself.


CRUDE OIL waiting for the sell setup to formon DAILY: CRUDE OIL is sitting around a strong resistance zone so we will be looking for objective sell setups on lower timeframes.
on H4: CRUDE OIL is trading inside our red wedge pattern but the lower trendline is not valid yet so we are waiting for a third swing to form around our lower trendline to consider it our last swing and then enter on it break downward.
so also have a regular bearish divergence adding more confluence to our sell setup.


Brent Crude Oil Important technical analysis updateMidterm forecast:
. While the price is below the resistance 44.55, beginning of downtrend is expected.
. We make sure when the support at 36.95 breaks.
. If the resistance at 44.55 is broken, the short-term forecast -beginning of downtrend- will be invalid.
Technical analysis:
. There is a divergence in RSI and price between the peak at 43.315 on 2020-06-08 and the peak at 43.93 on 2020-06-23, the probability of uptrend continuation is decreased and the probability of beginning of downtrend is increased.
. While the RSI support #1 at 50 is not broken, the probability of price decrease would be too low.
. A peak is formed in daily chart at 43.80 on 07/06/2020, so more losses to support(s) 42.20, 40.00 and minimum to Major Support (36.95) is expected.
. Price is above WEMA21, if price drops more, this line can act as dynamic support against more losses.
. Relative strength index (RSI) is 62.

Energies Recovered!Firstly, please support our work by clicking like button or following! These really assist us to reach more investors & traders like you!
Energies spent a greater part of the week consolidating before collapsing on Thursday. Heading into next the outlook looks bullish as
economic data from across the globe is picking up the space in the positive direction.


BRENT oil – my point of view. The 2nd variant!
Continuation !
The 2nd Variant:
The 2nd variant in my point of view at the present moment consists of two variants.
The 2nd variant of the course of events refers to as the notorious 4th wave can take as a simple correctional formation ABC, so as a variably complex formation ABCDE ( other variants are also possible and at the present moments it is very difficult to say how the wave structure will be formed there is no structure), two variants in the simplest way I have tried to show on the chart, as I see them at the moment
Both two variants reflect more possible, classical variants of correction development in 4 waves, taking in consideration the rules of interchanging etc. 😉
Conclusion:
The chart from the technical point of view tells that the price is tapped in the bearish trend, in the sideway movement, in the range with the upper limit of 60 $ and with the lower limit of 10-15 $.
In my opinion such situation will continue for the following 6 or even 10 years, with the call to the lower limit.
The fundamental image also approves at the present moment this variant of the course of events in accordance with energy alternative types development!
**************
Important!
Once again for understanding, the wave structure, patterns, and graphic models tend to change or change the structure, therefore confirmation is important.
The author does not sell anything! He does not give signals to enter or exit a deal!
Does not take funds into management!
Does not educate others on a paid or free basis! Well and so on 😉
Remember!
Forecasts of financial markets are the private opinion of the author.
The current analysis is not a trading guide.
The author is not responsible for the results of work that may arise when using trading recommendations from the submitted reviews.

Crude Oil Elliott Wave IdeaUpdate on below idea:
Think an ABC completed at 1.618 ($41,15) in an ending diagonal and now nearing the start of wave 3.
This idea is invalid above $41,13 and would start confirmation below $39,95

Brent oil will rise to $ 50?as you can see on my chart, the price of oil each time approaches the resistance level of $ 43.5, creating accumulation as part of an uptrend to go up with breaking through the resistance level, previously there was a double top option, but this double top turned into a more growing one picture, I expect a break through the level of $ 43.5 with an increase of up to $ 50 in the coming days.
