Brent - good start of oil in the new year!Brent oil is above EMA200 and EMA50 in the 4-hour time frame and is moving in its upward channel. On the ceiling of the ascending channel, we will look for oil selling positions. In case of a valid break of the $75 range, we can see the continuation of the downward trend. On the other hand, within the demand zone, we can buy with a suitable risk reward.
Over the past three months, the Brent crude oil market has emerged as the largest commodity market in the world, with a daily trading volume of $75.2 billion. The credit rating agency Fitch has stated that geopolitical tensions may increase volatility in the global oil and gas sector. The agency expects global oil demand in 2025 to grow at a similar pace to 2024, although this growth is likely to be slower than in 2022 and 2023.
President Joe Biden is reportedly planning to impose a 20-year ban on leasing public lands for oil and gas exploration in Nevada. According to Fox News, this move is being considered in the final weeks of Biden’s presidency, just ahead of Donald Trump’s inauguration. This prohibition would prevent companies from leasing federal lands in the region for oil and gas exploration or extraction activities.
As reported by Axios, Biden has been reviewing potential options for a military strike on Iran’s nuclear facilities. This action would only be considered if Iran takes significant steps toward building nuclear weapons before January 20. Reports indicate that Iran has enriched uranium to 60%, which is close to the 90% threshold required for weapons-grade material. Additionally, advancements in Iran’s centrifuge technology suggest the country could achieve this level within a matter of days.
However, reports also caution that developing a nuclear warhead would still require at least one year. These assessments come as Biden approaches the end of his term and Donald Trump prepares to assume the presidency.
Trump’s approach to Iran and its nuclear program is a topic of great interest, given his record during his first term. Previously, Trump adopted a “maximum pressure” strategy against Iran and withdrew from the Joint Comprehensive Plan of Action (JCPOA). The question now arises whether he will pursue a similar course of action or take a different approach in his new administration.
Brentoil

Descending Triangle on Brent @ D1A descending triangle pattern has formed on the daily chart of the spot Brent oil. It follows a long-term downtrend in the oil price and can be used for a bearish breakout setup. The triangle's borders are marked with the yellow lines. The cyan line is where my potential entry level will be. It is located at 10% of the pattern's height below the lower border. The green line denotes my take-profit level. It is set to the 100% of the pattern height plotted below the lower border. I will set the stop-loss level to the triangle's highest point (81.710) - the red line. I will ignore bullish breakouts from this trend continuation pattern.

UKOILSPOT "Brent Crude Oil" Energies Market Bullish Heist Plan🌟Hi! Hola! Ola! Bonjour! Hallo!🌟
Dear Money Makers & Robbers, 🤑 💰
Based on 🔥Thief Trading style technical analysis🔥, here is our master plan to heist the UKOILSPOT "Brent Crude Oil" Energies market. Please adhere to the strategy I've outlined in the chart, which emphasizes long entry. Our aim is the high-risk Red Zone. Risky level, overbought market, consolidation, trend reversal, trap at the level where traders and bearish robbers are stronger. 👀 So Be Careful, wealthy and safe trade.💪🏆🎉
Entry 📈 : You can enter a bull trade at Pullback,
however I advise placing Multiple Buy limit orders within a 15 or 30 minute timeframe. Entry from the most recent or closest low & high level should be in retest.
Stop Loss 🛑: Using the 4H period, the recent / nearest low level.
Goal 🎯: 78.437
80.000
Scalpers, take note : only scalp on the Long side. If you have a lot of money, you can go straight away; if not, you can join swing traders and carry out the robbery plan. Use trailing SL to safeguard your money 💰.
Warning⚠️ : Our heist strategy is incompatible with Fundamental Analysis news 📰 🗞️. We'll wreck our plan by smashing the Stop Loss 🚫🚏. Avoid entering the market right after the news release.
Take advantage of the target and get away 🎯 Swing Traders Please reserve the half amount of money and watch for the next dynamic level or order block breakout. Once it is resolved, we can go on to the next new target in our heist plan.
💖Supporting our robbery plan will enable us to effortlessly make and steal money 💰💵 Tell your friends, Colleagues and family to follow, like, and share. Boost the strength of our robbery team. Every day in this market make money with ease by using the Thief Trading Style.🏆💪🤝❤️🎉🚀
I'll see you soon with another heist plan, so stay tuned 🫂

Year 2025 and Beyond: Where to Place Your Bets?S&P 500:
US indices may continue their upward trend until the first quarter of 2025. The ultimate target appears to be above 6300, where they may peak and begin a significant correction. A global stock sell-off could potentially trigger a stock market crash similar to that of 2008.
India's Nifty 50:
India's Nifty 50 may find support around the 23,000–22,700 range and resume its upward movement in the final fifth wave, targeting a peak near 29,000. The Nifty 50 is likely to follow a trend similar to the S&P 500. The bullish cycle that began in 2009 is expected to conclude near the 29,000 level. Subsequently, a significant sell-off in Indian indices could trigger a major bear market, potentially erasing up to 50% of market capitalization from its peak.
Gold:
Gold may continue its consolidation for another month or two. A final surge toward the $3,000–$3,100 range is expected to mark the end of the rally that began in December 2015 at the $1,050 level. However, the bear market in equities is unlikely to spare even the perceived safe haven, leading to a pullback in gold prices as well.
Brent Crude:
Since March 2020, Brent crude experienced a remarkable rise, surging from $15 per barrel to $139 per barrel by March 2022. Over the past 33 months, it has already corrected by more than 47%. Brent crude is still expected to decline further, potentially reaching $50 per barrel within the next 3 to 6 months. However, the current inflationary trend could drive Brent prices beyond $160 per barrel later in 2025, before eventually succumbing to a deflationary trend that may persist for several years.
US Dollar Index:
The US Dollar Index peaked at around 114 in September 2022. Since then, it declined to 100 by July 2023 before starting to rise again in a corrective A-B-C pattern, forming part of a larger (A)-(B)-(C) decline. The Wave C of (B) is expected to conclude near 109, followed by another decline toward 98 by the first half of 2025. However, a renewed bullish trend in the US Dollar Index could reinforce the "Cash is King" narrative during a global equity market downturn.
USD/INR:
The bullish trend in USD/INR, which began in January 2008 at the 39 level, has seen the Indian Rupee weaken by over 60% against the US Dollar over the past 17 years. In the short term, USD/INR may peak around 86. However, the Rupee is likely to weaken further, reaching 90 against the US Dollar by the second quarter of 2025.
US Govt. 10 years bond yield:
The long-term yield on U.S. Government 10-year bond's yield indicates rising interest rates for this decade. In the short term, the yield may ease to 3%-2.6% by the second quarter of 2025. However, fears of a U.S. Government default could push the yield to 10% or higher over the next couple of years. The "Bond Ghost," along with a global equity rout, may haunt investors again in 2025-2026.
Bitcoin (BTC):
Bitcoin's bullish trend may continue until the first quarter of 2025, albeit at a slower pace. BTC still has the potential to reach around $115k-$120k, concluding the bullish run that began in November 2022 from the level of $15,500. Over the past decade and a half, BTC has significantly outpaced any other asset class globally. However, global risk aversion, which may start with an initial global equity market sell-off, could pause Bitcoin's bullish journey for the rest of 2025. Before the end of 2025, BTC might lose up to 50% of its value from its peak.
In the longer run, however, BTC has the potential to become the most valuable asset class globally, even after experiencing a 50% erosion in its value.

What Is the Difference Between Brent and WTI Crude OilWhat Is the Difference Between Brent and WTI Crude Oil for Traders?
Brent Crude and WTI are two of the most important oil benchmarks in the world, influencing global markets and trading strategies. While both represent high-quality crude, they differ in origin, composition, pricing, and market dynamics. This article explores questions like “What is Brent Crude?”, “What is WTI Crude?”, and “What is the difference between Brent and crude oil from West Texas?”, helping traders navigate their unique characteristics.
Brent Oil vs Crude Oil from West Texas
Brent Crude and West Texas Intermediate (WTI) are two primary benchmarks in the global oil market, each representing distinct qualities and origins.
What Is Brent Crude Oil?
Brent Crude originates from the North Sea, encompassing oil from fields between the United Kingdom and Norway, like Brent, Forties, Oseberg, Ekofisk, and Troll. This region's offshore production benefits from direct access to sea routes, facilitating efficient transportation to international markets. The North Sea's strategic location allows Brent Crude to serve as a global pricing benchmark and influence oil prices worldwide.
This blend is slightly heavier and contains more sulphur compared to WTI. Despite this, Brent Crude is extensively traded and serves as a pricing reference for about two-thirds of the world's oil contracts, primarily on the Intercontinental Exchange (ICE).
What Is WTI Crude Oil?
West Texas Intermediate is primarily sourced from US oil fields in Texas, North Dakota, and Louisiana. The landlocked nature of these production sites means that WTI relies heavily on an extensive network of pipelines and storage facilities for distribution. A key hub for WTI is Cushing, Oklahoma, which serves as a central point for oil storage and pricing. This infrastructure supports WTI's role as a benchmark for US oil prices.
Known for its lightness and low sulphur content, West Texas Crude is ideal for refining into gasoline and other high-demand products. WTI serves as a major benchmark for oil prices in the United States and is the underlying commodity for the New York Mercantile Exchange's (NYMEX) oil futures contract.
Brent and WTI Crude Oil CFDs
Most retail traders interact with Brent and WTI through Contracts for Difference (CFDs) instead of futures contracts. CFDs enable traders to speculate on price fluctuations without having to own the underlying physical oil. Instead, they open buy and sell positions and take advantage of the difference in the price from the time the contract is opened to when it’s closed.
This makes CFDs a popular choice for retail traders looking to make the most of short-term price fluctuations in oil without the complexities of physical ownership, storage, or delivery. CFDs also offer leverage, allowing traders to control larger positions with smaller capital.
You can trade Brent and WTI crude oil at FXOpen with tight spreads and low commissions! Check the recent oil prices at the TickTrader trading platform.
Quality and Composition Differences
Brent Crude is classified as a light, sweet crude oil. It has an API gravity of approximately 38 degrees, indicating a relatively low density. Its sulphur content is about 0.37%, making it less sweet compared to WTI. Brent's composition is well-suited for refining into diesel fuel and gasoline, which are in high demand globally.
But what is WTI like? Known for its superior quality, WTI boasts an API gravity of around 39.6 degrees, making it lighter than Brent. Its sulphur content is approximately 0.24%, classifying it as a sweeter crude. This lower sulphur content simplifies the refining process, allowing for the production of higher yields of gasoline and other high-value products.
These differences in API gravity and sulphur content are significant for refiners. Lighter, sweeter crudes like WTI are generally more desirable because they require less processing to meet environmental standards and produce a higher proportion of valuable end products. However, the choice between Brent and WTI can also depend on regional availability, refinery configurations, and specific product demand.
Trading Volumes and Market Liquidity
Brent Crude and WTI both see significant trading volumes, but they differ in terms of their market liquidity and global reach.
As mentioned above, Brent Crude is widely traded on international markets, and it serves as the pricing benchmark for roughly two-thirds of the world's oil contracts. Its broad appeal comes from being a global benchmark, which makes it highly liquid in global exchanges like ICE Futures Europe.
This high liquidity means traders can buy and sell contracts with relative ease, often with tighter spreads. As a result, it’s popular among traders looking for high-volume, internationally-influenced oil exposure.
On the other hand, WTI is primarily traded in the US through exchanges like the NYMEX (New York Mercantile Exchange). While still highly liquid, WTI's trading volumes tend to be more concentrated within the US market.
Despite this, it remains a crucial benchmark, especially for traders focusing on the US oil industry. Its close ties to the domestic market mean liquidity can be slightly more affected by US-specific factors.
Pricing Influences and Differences Between Brent and WTI
The geographic focus and market influence distinguish WTI Crude vs Brent oil. Brent is a globally traded benchmark, making it more reactive to international forces, while WTI’s market is more US-centric, with pricing heavily influenced by domestic factors and energy dynamics.
Therefore, Brent Crude and WTI often trade at different prices, with Brent Crude typically priced higher. This price difference, known as the Brent-WTI spread, reflects the varying dynamics between global and US markets. Traders keep a close eye on this spread, as it signals the relative strength of international versus US oil markets.
Price Influences for Brent Crude
- Geopolitical events: Brent is highly sensitive to tensions or conflicts in major oil-producing regions like the Middle East and North Africa. Any disruptions to supply routes or production in these areas can cause its prices to spike.
- OPEC+ decisions: Since many OPEC+ members produce oil that influences Brent’s pricing, their decisions on production cuts or increases have a direct impact on its price. A reduction in global output typically raises prices.
- Global shipping and transport logistics: Brent is traded internationally, so shipping costs, potential blockages in transport routes (e.g., the Strait of Hormuz), and other logistics play a role in price movements.
- Global energy demand: Trends in global demand, especially from key regions like Europe and Asia, affect pricing. For instance, economic growth in these regions tends to push prices higher.
Price Influences for WTI
- US shale oil production: WTI is highly responsive to the levels of US shale oil output. When production surges, oversupply can put downward pressure on prices.
- US oil inventory levels: Key storage hubs like Cushing, Oklahoma, are crucial for pricing. Rising inventory levels signal oversupply, which typically lowers prices, while declining inventories may indicate higher demand and push prices up.
- Pipeline and transportation infrastructure: Bottlenecks in US oil pipelines or delays in transportation can influence WTI pricing. For instance, limited capacity in pipelines can restrict oil flow to refineries, leading to fluctuations in prices.
- Domestic energy policies: Government regulations, taxes, or subsidies affecting US energy production can impact prices, with changes in drilling activity or environmental policies influencing supply levels.
Which Oil Should Traders Choose?
When deciding between WTI vs Brent, traders consider their market focus, trading strategy, and the factors driving each benchmark. Here’s an overview of what might help you choose:
1. Geopolitical Focus
- Brent Crude is more sensitive to global geopolitical events, making it a strong choice for traders who focus on international markets. If you analyse global tensions, OPEC+ decisions, or international energy policies, Brent is likely more relevant.
- WTI is less influenced by global events and more driven by US domestic factors. Traders focused on US politics, infrastructure, and energy policies may find WTI a better fit.
2. Market Liquidity and Trading Volume
- Brent Crude is widely traded across global exchanges, giving it strong liquidity. It’s ideal for traders who prefer access to international markets and global trading volumes. Its liquidity also makes it attractive for those trading larger volumes or seeking tighter spreads.
- WTI has high liquidity as well, but it’s more concentrated in US markets. This makes it better suited for traders with a specific interest in US oil dynamics.
3. Price Volatility
- Brent Crude tends to react more to geopolitical shocks, meaning it can experience more volatility from global crises. Traders looking for opportunities driven by international supply disruptions or geopolitical risks might prefer Brent.
- WTI is typically influenced by domestic production and inventory levels, which can result in different volatility patterns. US-focused traders or those tracking domestic shale oil production often gravitate toward WTI for its more region-specific volatility.
4. Regional Focus
- Brent Crude is favoured by traders who have a global outlook or trade oil products tied to European, Asian, or African markets.
- WTI is a solid choice for traders interested in US oil markets or those who rely on data from domestic US reports like the EIA.
The Bottom Line
In summary, understanding the differences between Brent Crude and WTI is crucial for traders analysing global oil markets. Both benchmarks offer unique opportunities depending on your trading strategy and market focus, whether you prefer the global influence of Brent or the US-centric dynamics of WTI. To get started with Brent and WTI CFDs, consider opening an FXOpen account for access to these key markets alongside low-cost trading conditions.
FAQ
Why Is Oil Called Brent Crude?
Brent Crude gets its name from the Brent oil field located in the North Sea, discovered by Shell in the 1970s. The name "Brent" was derived from a naming convention based on birds—specifically, the Brent goose. Over time, it’s become the benchmark for oil produced in the North Sea, now serving as a global pricing standard for much of the world's oil supply.
What Does WTI Stand For?
WTI stands for West Texas Intermediate. It refers to a grade of crude oil that is primarily produced in the United States, specifically from oil fields in Texas, North Dakota, and surrounding regions. WTI is one of the key benchmarks for oil pricing, particularly in North America.
Is Brent Crude Sweet or Sour?
Brent Crude is considered a light, sweet crude oil. It has a low sulphur content, making it easier to refine into high-value products like gasoline and diesel. However, it contains slightly more sulphur than WTI, which is why it's marginally classified as less sweet.
Why Is Brent Always More Expensive Than WTI?
Brent is often more expensive than WTI due to its global demand and greater sensitivity to geopolitical risks. Brent is influenced by international factors, including OPEC+ decisions and conflicts in key oil-producing regions, which often lead to supply disruptions. WTI, meanwhile, is more affected by domestic US supply and demand.
Is Saudi Oil Brent or WTI?
Saudi oil is neither Brent nor WTI. It falls under its own classification, primarily as Arabian Light Crude. However, Brent Crude is often used as a pricing benchmark for oil exports from Saudi Arabia and other OPEC nations.
This article represents the opinion of the Companies operating under the FXOpen brand only. It is not to be construed as an offer, solicitation, or recommendation with respect to products and services provided by the Companies operating under the FXOpen brand, nor is it to be considered financial advice.

Brent - oil waiting for regional stability!Brent oil is below the EMA200 and EMA50 in the 4H timeframe and is moving in its upward channel. At the bottom of the rising channel, we will look for positions to buy oil. In case of a valid failure of this channel, we can witness the continuation of the downward trend.
U.S. President Joe Biden announced that Israel and Lebanon have agreed to a ceasefire. He expressed gratitude to French President Emmanuel Macron and emphasized that Israel did not initiate this war, nor were the Lebanese people seeking conflict. Biden stated that Israel has destroyed Hezbollah’s infrastructure in southern Lebanon but stressed that lasting security cannot be achieved solely on the battlefield. The ceasefire is set to take effect at 4 a.m. local time tomorrow, aiming for a permanent end to hostilities.
Meanwhile, Goldman Sachs predicted that Brent crude oil prices face short-term risks that could push them to around $80 per barrel in the first half of 2025, assuming Iranian oil supply drops by 1 million barrels per day due to stricter sanctions. In contrast, the bank expects medium-term risks to Brent prices to tilt downward due to high spare capacity in the market. Goldman Sachs also estimated that Brent crude prices could fall below $60 per barrel in 2026 if a 10% tariff is imposed or OPEC increases its supply in 2025.
Separately, Bloomberg reported that China’s small and private refineries are paying higher prices for Iranian oil due to reduced shipments and fewer offers. These refineries have been purchasing light Iranian crude for December delivery at smaller discounts compared to ICE Brent benchmarks. Limited shipping availability and delays have constrained Iran’s oil exports to China.
Russian Deputy Prime Minister Alexander Novak, during a meeting with OPEC’s Secretary-General, stated that Russia intends to strengthen its cooperation with OPEC. Novak highlighted that the energy market remains under significant pressure, with price volatility being one of the key challenges. He stressed the importance of closer collaboration between Russia and OPEC to address these issues, asserting that joint efforts can contribute to greater stability in the energy market. Novak also revealed that Russia is preparing to lift its gasoline export ban, with the necessary documentation expected to be finalized soon, although no exact timeline was provided. He pointed to the market’s balance achieved through OPEC+ actions and quota implementation, emphasizing the importance of continued measures to ensure stability.
According to the latest JODI data, Saudi Arabia’s crude oil exports increased by 80,000 barrels per day in September, reaching 5.75 million barrels per day, the highest level in three months. This rise in exports likely resulted from reduced direct crude oil consumption for power generation as the country’s hottest months came to an end. JODI data showed that direct crude burning fell by 296,000 barrels per day in September, reaching approximately 518,000 barrels per day.
Saudi Arabia, the world’s largest crude oil exporter, saw a slight decrease in oil production in September, down by 17,000 barrels per day to 8.98 million barrels per day. Refinery throughput in the country reached 2.756 million barrels per day in September, the highest in four months and 35,000 barrels per day higher than in August.
This production level aligns with Saudi Arabia’s summer commitment to maintain output at “around 9 million barrels per day,” consistent with OPEC+ cuts and a voluntary reduction of 1 million barrels per day.
Saudi Arabia and its OPEC+ partners have postponed their planned production increases from December 2024 to January 2025. The group now plans to begin increasing supply in January, initially by 180,000 barrels per day for the first month.
Saudi Arabia is expected to deliver less crude oil to China, the world’s largest oil importer, in December. Trade sources told Reuters last week that weak demand in China has prompted Saudi Arabia to reduce its shipments to the country.

Brent/UK Oil Spot Market Money Heist Plan on Bullish SideHallo! My Dear Robbers / Money Makers & Losers, 🤑 💰
This is our master plan to Heist Brent/UK Oil Spot Market Market based on Thief Trading style Technical Analysis.. kindly please follow the plan I have mentioned in the chart focus on Long entry. Our target is Red Zone that is High risk Dangerous level, market is overbought / Consolidation / Trend Reversal / Trap at the level Bearish Robbers / Traders gain the strength. Be safe and be careful and Be rich.
Entry 📈 : Can be taken Anywhere, What I suggest you to Place Buy Limit Orders in 15mins Timeframe Recent / Nearest Low Point take entry in pullback.
Stop Loss 🛑 : Recent Swing Low using 2H timeframe
Attention for Scalpers : Focus to scalp only on Long side, If you've got a lot of money you can get out right away otherwise you can join with a swing trade robbers and continue the heist plan, Use Trailing SL to protect our money 💰.
Warning : Fundamental Analysis news 📰 🗞️ comes against our robbery plan. our plan will be ruined smash the Stop Loss 🚫🚏. Don't Enter the market at the news update.
Loot and escape on the target 🎯 Swing Traders Plz Book the partial sum of money and wait for next breakout of dynamic level / Order block, Once it is cleared we can continue our heist plan to next new target.
💖Support our Robbery plan we can easily make money & take money 💰💵 Follow, Like & Share with your friends and Lovers. Make our Robbery Team Very Strong Join Ur hands with US. Loot Everything in this market everyday make money easily with Thief Trading Style.
Stay tuned with me and see you again with another Heist Plan..... 🫂

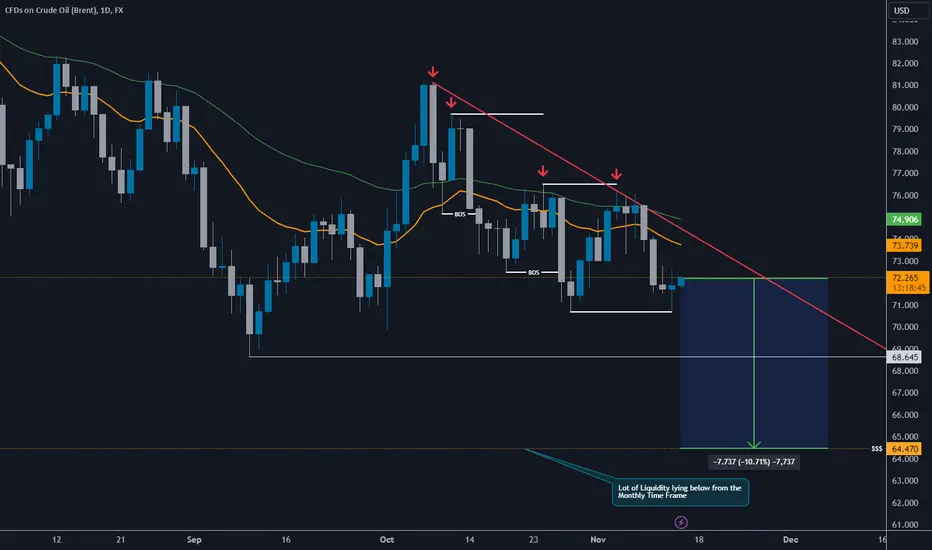
SHORT OIL (10% Profit from Current Prices)- BRENT started a Downward Trend since it Broke $75.13 creating lower highs and Lower lows
- Dollar is Clearly in an upward Trend
- Trumps policy is with increasing US Shale Oil production which is negative for price
- Monthly and Weekly Timeframes are all showing weakness
- Short at current Prices to Target liquidity around the $64.50
UKOIL / BRENT CRUDE OIL Market Money Heist Plan on Bullish SideHaaiii!! My Dear Robbers / Money Makers & Losers, 🤑 💰
This is our master plan to Heist UKOIL / BRENT CRUDE OIL Market based on Thief Trading style Technical Analysis.. kindly please follow the plan I have mentioned in the chart focus on Long entry. Our target is Red Zone that is High risk Dangerous level, market is overbought / Consolidation / Trend Reversal / Trap at the level Bearish Robbers / Traders gain the strength. Be safe and be careful and Be rich.
Entry : Can be taken Anywhere, What I suggest you to Place Buy Limit Orders in 15mins Timeframe Recent / Nearest Low Point.
Stop Loss 🛑 : Recent Swing Low using 2h timeframe
Attention for Scalpers : If you've got a lot of money you can get out right away otherwise you can join with a swing trade robbers and continue the heist plan, Use Trailing SL to protect our money 💰.
Warning : Fundamental Analysis news 📰 🗞️ comes against our robbery plan. our plan will be ruined smash the Stop Loss. Don't Enter the market at the news update.
Loot and escape on the target 🎯 Swing Traders Plz Book the partial sum of money and wait for next breakout of dynamic level / Order block, Once it is cleared we can continue our heist plan to next new target.
Support our Robbery plan we can easily make money & take money 💰💵 Follow, Like & Share with your friends and Lovers. Make our Robbery Team Very Strong Join Ur hands with US. Loot Everything in this market everyday make money easily with Thief Trading Style.
Stay tuned with me and see you again with another Heist Plan..... 🫂

Scenario Brent Crude OilI will first focus on the marked circle where the overall turning point can take place, if the price does not reach the support, it is quite possible to move from the marked triangle in the direction of the long, because based on Elliott's wave theory, there is a long formation, if the price breaks below this zone, it is quite possible to weaken prices and proceeding to lower prices

Oil prices may fall more than expected.I think Brent crude oil prices will continue to fall.
In the coming years, renewable energy could steadily reduce demand for Brent crude oil.
* What i share here is not an investment advice. Please do your own research before investing in any asset.
* Never take my personal opinions as investment advice, you may lose all your money.

WEEKLY FORECAST OCT 26th: SELL US & UK CRUDE OIL In this video, we will analyze the CRUDE OIL markets in the US and UK, looking through the lens of ICT Concepts.
Price has traded up into a bearish FVG, so therefore I am BEARISH. Price can turn neutral in this geopolitical environment, but maybe the inside bar will act as a harbinger of bearish things to come.
Check the comments section below for updates regarding this analysis throughout the week.
Enjoy!
May profits be upon you.
Leave any questions or comments in the comment section.
I appreciate any feedback from my viewers!
Like and/or subscribe if you want more accurate analysis.
Thank you so much!
Disclaimer:
I do not provide personal investment advice and I am not a qualified licensed investment advisor.
All information found here, including any ideas, opinions, views, predictions, forecasts, commentaries, suggestions, expressed or implied herein, are for informational, entertainment or educational purposes only and should not be construed as personal investment advice. While the information provided is believed to be accurate, it may include errors or inaccuracies.
I will not and cannot be held liable for any actions you take as a result of anything you read here.
Conduct your own due diligence, or consult a licensed financial advisor or broker before making any and all investment decisions. Any investments, trades, speculations, or decisions made on the basis of any information found on this channel, expressed or implied herein, are committed at your own risk, financial or otherwise.

WTI CRUDE OIL & BRENT OIL Weekly Outlook: Wait For SELL Setup!This weekly forecast is for Oct 21 - 25th.
US & UK Oil have been up and down throughout this Mid East crises. WIth a strong bearish candle and close last week, the indications are that the market has taken a bearish turn.
I will be watching the market closely for a pullback to the newly formed Daily -FVG for a high
probability short setup.
Take caution, day traders. As there will be buys to take as price retraces up, but I would urge you to remain patient and wait for the HP sells.
Check the comments section below for updates regarding this analysis throughout the week.
Enjoy!
May profits be upon you.
Leave any questions or comments in the comment section.
I appreciate any feedback from my viewers!
Like and/or subscribe if you want more accurate analysis.
Thank you so much!
Disclaimer:
I do not provide personal investment advice and I am not a qualified licensed investment advisor.
All information found here, including any ideas, opinions, views, predictions, forecasts, commentaries, suggestions, expressed or implied herein, are for informational, entertainment or educational purposes only and should not be construed as personal investment advice. While the information provided is believed to be accurate, it may include errors or inaccuracies.
I will not and cannot be held liable for any actions you take as a result of anything you read here.
Conduct your own due diligence, or consult a licensed financial advisor or broker before making any and all investment decisions. Any investments, trades, speculations, or decisions made on the basis of any information found on this channel, expressed or implied herein, are committed at your own risk, financial or otherwise.

BRENT (H4)Oil managed to close the weekly negative and accordingly we are looking to sell from levels of 75.31 Stop hourly close above levels of 76.600
With targets at levels of 73.30
Second target: 71.98
Third target: 69.55
BLACKBULL:BRENT

CRUDE OIL (WTI): Short-Term Bearish Sentiment
Crude Oil looks bearish after a breakout of a key daily horizontal support.
The next key supports are 68.5 - 69.2 and 66.4 - 67.4.
The price will most likely continue falling, at least to the first support.
❤️Please, support my work with like, thank you!❤️

Will the World's Most Vital Artery Become Its Achilles' Heel?In the intricate dance of global energy markets, few factors wield as much influence as the Strait of Hormuz. This narrow waterway, often overlooked in daily discourse, stands as a silent titan, controlling the ebb and flow of 21% of the world's daily oil consumption. As geopolitical tensions simmer in the Middle East, the stability of this crucial chokepoint hangs in delicate balance, challenging us to confront a stark reality: how vulnerable is our global economy to disruptions in this single maritime passage?
The potential for conflict to spill over into the Strait of Hormuz presents a fascinating study in risk assessment and market psychology. Despite the looming threat of supply disruptions that could send oil prices soaring to unprecedented heights—some analysts project as high as $350 per barrel—the market remains surprisingly sanguine. This dichotomy between potential catastrophe and current calm invites us to explore the complex interplay of factors that shape oil prices, from geopolitical maneuvering to the subtle influence of alternative supply routes.
As we stand at this crossroads of energy security and global trade, we are challenged to think critically about the future of oil markets and international relations. The Strait of Hormuz serves not just as a geographical feature, but as a mirror reflecting our world's intricate dependencies and the delicate balance of power that underpins global stability. In contemplating its significance, we are invited to look beyond the immediate concerns of oil prices and consider broader questions of energy resilience, diplomatic strategy, and the evolving landscape of international trade in an increasingly uncertain world.

Brent Oil – Breakout and Targeting the Next ResistanceI'm watching Brent oil closely as we're approaching a key resistance level. If we break through this resistance, my target will be the next resistance level. At that point, there could be a potential short opportunity or it may be a good idea to reduce long positions to lock in profits.
Strategy: I'll be monitoring for a confirmed breakout and will adjust my position based on price action at the next resistance.

UKOIL "BRENT" Market Money Heist Plan on Bullish Side.Hola! My Dear Robbers / Money Makers & Losers, 🤑 💰
This is our master plan to Heist UKOIL "BRENT" Market based on Thief Trading style Technical Analysis.. kindly please follow the plan I have mentioned in the chart focus on Long entry. Our target is Red Zone that is High risk Dangerous level, market is overbought / Consolidation / Trend Reversal / Trap at the level Bearish Robbers / Traders gain the strength. Be safe and be careful and Be rich.
Entry : Can be taken Anywhere, What I suggest you to Place Buy Limit Orders in 15mins Timeframe Recent / Nearest Swing Low
Stop Loss 🛑 : Recent Swing Low using 2H timeframe
Attention for Scalpers : If you've got a lot of money you can get out right away otherwise you can join with a swing trade robbers and continue the heist plan, Use Trailing SL to protect our money 💰.
Warning : Fundamental Analysis news 📰 🗞️ comes against our robbery plan. our plan will be ruined smash the Stop Loss. Don't Enter the market at the news update.
Loot and escape on the target 🎯 Swing Traders Plz Book the partial sum of money and wait for next breakout of dynamic level / Order block, Once it is cleared we can continue our heist plan to next new target.
Support our Robbery plan we can easily make money & take money 💰💵 Follow, Like & Share with your friends and Lovers. Make our Robbery Team Very Strong Join Ur hands with US. Loot Everything in this market everyday make money easily with Thief Trading Style.
Stay tuned with me and see you again with another Heist Plan..... 🫂

Brent crude: Buying into the stormAny trade you take in oil right now is probably going to make you a quick win or loss .
Oil has easily been the most volatile market this week - it's pretty obvious why
1) Hurricanes in the US disrupting supply
2) War in the Middle East
For us, the trend is higher since breaking through $76 / bbl. And the latest fractal forming a higher low helped confirm this idea.
This uptrend has not been properly established with 2 higher highs, which offers bigger possible upside but also a greater chance of never getting going.
You can see the price is trapped between the 50 SMA and 200 SMA.
We see a chance for a favourable 2:1 risk reward by trading the pullback from yesterday's bullish engulfing candlestick up to this week's high around 81.50.
What do you think? Please share your ideas in a comment

CRUDE OIL SHOWING STRENGTH EXPANDING TRIANGLE CORRECTIONSCrude Oil corrections!
N.B!
- USOIL price might not follow drawn lines . Actual price movement may likely differ from the forecast.
- Let emotions and sentiments work for you
- ALWAYS Use Proper Risk Management In Your Trades
#usoil
#crudeoil
#wti
#brentoil

Brent Crude Oil Analysis==>> Fundamental + TechnicalBrent Crude Oil ( FX_IDC:USDBRO ) began to rise from the Heavy Support zone($71.30-$64.80) after Iran attacked Israel . ( It seemed that before the attack of Iran, Brent oil intended to fall and correction further ).
Today's fundamental analysis of Brent crude oil prices is influenced by several key factors:
Geopolitical Tensions : The ongoing conflict in the Middle East, especially between Iran and Israel, has raised concerns about potential disruptions to oil production and exports. Any attacks on Iranian oil infrastructure, particularly in the Strait of Hormuz, a crucial passage for global oil exports, could reduce supply and drive prices higher. These concerns have contributed to the recent rise in Brent prices, pushing it above $80 per barrel.
Global Demand : China's recent large-scale economic stimulus aimed at boosting recovery has increased optimism for higher oil demand. As the world's largest oil consumer, any rise in demand from China directly influences global oil prices.
OPEC+ Supply Capacity : Although OPEC+ still has significant spare production capacity, there are worries that a severe crisis in the region could overwhelm this capacity, preventing the group from compensating for any sudden drop in supply.
Overall, the short-term outlook for Brent crude appears bullish, driven by geopolitical uncertainties and potential increases in demand from China. However, the market remains cautious to see if these trends will hold over time.
Now, according to the fundamental analysis of Brent Crude Oi, let's see which area is suitable for buying Brent Crude Oi .
Brent Crude Oil is moving near the Support zone and the Support line .
Brent Crude Oil's movement structure is corrective , and we should expect it to move upwards again .
I expect Brent Crude Oil to start rising again from or near the Support zone and at least to $81(Yearly Pivot Point) and then attack the Resistance lines .
Brent Crude Oil Analyze (USDBRO), Daily time frame⏰.
🔔 Be sure to follow the updated ideas. 🔔
Do not forget to put Stop loss for your positions (For every position you want to open).
Please follow your strategy and updates; this is just my Idea, and I will gladly see your ideas in this post.
Please do not forget the ✅' like '✅ button 🙏😊 & Share it with your friends; thanks, and Trade safe.

XBR/USD Analysis: Brent Crude Price Fails to Hold Above $80XBR/USD Analysis: Brent Crude Price Fails to Hold Above $80
As shown on the XBR/USD chart, Brent crude oil prices surged by over 8.5% last week — marking the largest increase in 2024, driven by escalating tensions in the Middle East.
Although oil prices continued to climb earlier this week, a pullback occurred on Tuesday, causing Brent crude to drop below the $80 level. It appears that market participants expect U.S. authorities to prevent the conflict from worsening ahead of the presidential elections, prompting them to lock in profits from previous long positions based on the technical outlook.
XBR/USD Technical Analysis
Today's analysis of the XBR/USD chart shows that Brent crude is moving within an upward channel (shown in blue) that began in the first half of September. The recent downturn (indicated by an arrow) comes as:
→ The price has entered a resistance zone, marked by the psychological $80 level and the August highs around $81.5.
→ The RSI indicator has risen above 85.
→ The price has touched the upper boundary of the channel.
If tensions in the Middle East ease, we could see a pullback on the XBR/USD chart following the impressive rally.
Brent crude prices may find support at the median line of the blue channel, the $77.50 level, and the purple lines marking last week’s strong price growth.
This article represents the opinion of the Companies operating under the FXOpen brand only. It is not to be construed as an offer, solicitation, or recommendation with respect to products and services provided by the Companies operating under the FXOpen brand, nor is it to be considered financial advice.

Brent oil and the global recessionConsidering the events in the Middle East and the possibility of the involvement of oil-rich countries, and on the other hand, the economic policies of the United States and the growth of emerging countries in the economic field and the increase in demand from the behavioral financial point of view, oil has the potential to reach the range of $125 per barrel and after that. It has the construction of historical prices in 2025.
