CRUDE OIL (WTI): Potential Scenarios For Next Week 🛢️
Crude Oil is consolidating after a strong bullish wave.
The price formed a horizontal range on a daily.
Next week, wait for a breakout of one of the boundaries of the range for a confirmation.
Bearish violation - a daily candle close below a support of the range, will give you a strong
bearish signal. A bearish continuation will be expected to 83.0 level then.
Alternatively, a bullish breakout of the resistance of the range - a daily candle close above,
will push the prices higher to 89.0 level.
Wait for a breakout, it will give you a strong confirmation.
❤️Please, support my work with like, thank you!❤️
Brentoil

CRUDE OIL Heist Plan to Rob the oil barrelsHola Traders,
This is our Excellent master plan to Heist Bullish side of Crude oil barrels. My dear Looters U can enter at the any point above the green MA pullback area, Our target is Red Zone that is High risk Trap area. Put Stop loss in recent swing LOW. Dear Robbers we can steal oil barrells and finally sell in the commodities market then make money and take money. Be safe and be Rich.

CRUDE OIL (WTI): Bullish Continuation After Pullback 🛢️
Crude Oil set a new local higher high higher close on a daily,
violating a key horizontal resistance.
It opens a potential for a further growth to 89.0 resistance.
I would suggest looking for entries after a pullback.
The safest zone to watch is a demand zone based on a broken structure
and a trend line of a rising channel.
❤️Please, support my work with like, thank you!❤️

CRUDE OIL (WTI): Price Action Analysis & Trading Plan 🛢
Detailed technical analysis for WTI Crude Oil.
Price action & important key levels.
Daily/4h/1h time frames analysis.
Bearish outlook explained.
❤️Please, support my work with like, thank you!❤️

A Sell on the Rise StrategyFrom a long-term perspective, Oil, in this case, we use the Brent Last Day Financial by NYMEX CME, overall is trending downward!
It would be tempting to initiate a “sell on rise strategy” especially when a long term trend line (in blue) is challenged. The trend line majors the historical highs of Brent (BZ) as well as Crude (CL) since the second all-time-high (ATH) in March 2022.
Diving deeper and a closer look to what's happening in 2024! Brent has been consolidating way too long already! Crude oil touched-and-go, the same immediate resistance, and marked a 4-month high before closing just below $87 per barrel. Meanwhile, from a short-term perspective, it coincides with a broad technical bullish consolidation within a channel formation (Orange lines). All recent higher-highs and higher-lows in 2024 have indicated an uptrend and the current bullish bias was well supported at triple bottom (Purple line) in the last couple of weeks.
Ideally, Oil should consolidate within the wedge formation until a sustained clear breakout. Oil is trading in an overbought territory and reversal should be in cards!
A suggested trade to bet on the stronger challenge downtrend would be to short at 87.50 level and an appropriate stop loss above an immediate significant resistance. Fundamentally still overbought am looking to break the congested trend channel downwards!

CRUDE OIL BRENT/WTI SELLINGHi Oil Traders,
This is our master plan to Rob Crude oil Barrels. Guys U can enter to Rob this oil at entry level i have mentioned or place your sell stop below my entry level this is our master plan. Our target is Trap area.

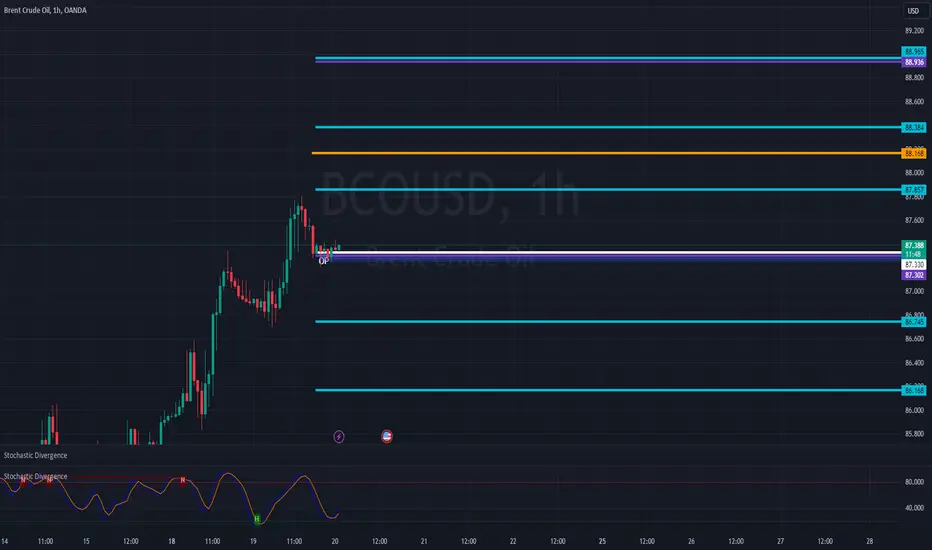
#Oil Algo LevelsSharing the algo levels for brent oil - cyan color is daily levels, purple levels are weekly levels and orange levels are monthly levels. The higher the timeframe, the stronger the levels. In general, above OP and PZ, bias is to the upside and vice versa.
OIL Bullish Heist Plan to make moneyAm going to heist the Crude Oil at bullish side. This is my plan to Loot the money in this method. I set my Buy Stop at Pivot line. when it trigger Golden cross my loot will start.

UKOIL (Brent) Technical Analysis - VideoIn my previous post, I shared my analysis on Brent crude oil. Here's a video explaining the reasoning behind my trade idea:
Currently, Brent is trading within a daily range-bound channel. It's pushing against the upper boundary, which hints at a possible retracement to test previous lows. Interestingly, historical data over the past decade suggests that March tends to be a bearish period for Brent.
Disclaimer: Remember, this analysis is based on technical factors and should not be seen as direct financial advice. Trading commodities is inherently risky. Before making any trades, always consult with a qualified financial professional and carefully consider your own risk appetite.

UKOIL (Brent) Technical AnalysisBrent crude oil is presently confined within a daily range-bound channel. The price is currently testing the upper bounds of the range, suggesting a potential retracement to retest previous lows. This analysis incorporates a seasonal perspective – historical data over the past decade indicates a tendency for Brent to experience declines during the month of March.
Disclaimer: This analysis offers a technical viewpoint and does not constitute direct financial advice. Trading commodities carries inherent risk. Always consult a qualified financial professional and carefully evaluate your individual risk tolerance before making investment decisions.

CRUDE OIL (WTI): Bullish Trend Continues 🛢️
Crude Oil is trading in a bullish trend.
The price retraced to a solid vertical trend line on a daily.
After its test, I spotted a confirmed bullish breakout of a resistance line
of a falling channel on an hourly time frame.
I think that bullish rally may resume soon.
Goals: 78.0 / 80.6
❤️Please, support my work with like, thank you!❤️

CRUDE OIL (WTI): Important Decision Ahead 🛢️
Crude Oil is currently testing a wide horizontal supply area.
Its bullish breakout may trigger a strong bullish movement.
Daily candle close above 80.8 will confirm a violation.
A bullish continuation will be expected to 82.4 level then.
❤️Please, support my work with like, thank you!❤️

WTI (OIL)Texas oil prices are rising (as well as North Sea Brent). Considering the current global risks, the possibility of oil price increase is still standing. (This is a personal opinion)

USOIL | POTENTIAL BREAKOUT IMMINENTUSOIL finds itself at a critical juncture, facing a formidable horizontal resistance level at 79 that has proven unyielding since November 2023. However, a noteworthy development is underway as it sustains its position above the DEMA100 for the first time since October 23.
Furthermore, there is discernible formation of an inverted head and shoulders pattern within the confines of the 79 resistance zone. This pattern typically signifies a bullish reversal, hinting at the possibility of a breakout.
To confirm the bullish momentum, the bulls need to achieve a daily close above the 79 mark, which would effectively unlock potential upside opportunities. It goes without saying that maintaining a stop-loss level below 76 provides a prudent safeguard for any long positions. Additionally, the EMA100 serves as a dynamic trailing stop-loss indicator, aiding in managing risk effectively.

CRUDE OIL (WTI): Important Key Levels 🛢️
Here is my latest structure analysis for WTI Crude Oil.
Resistance 1: 78.9 - 80.8 area
Resistance 2: 82.5 - 83.5 area
Support 1: 75.5 - 76.2 area
Support 2: 70.7 - 71.8 area
Support 3: 69.4 - 70.4 area
Support 4: 67.7 - 68.7 area
Consider these structures for pullback/breakout trading.
❤️Please, support my work with like, thank you!❤️

Crude Oil May Have Found Medium Term Bottom @ 68Crude oil price showing strength!
N.B!
- USOIL price might not follow drawn lines . Actual price movement may likely differ from the forecast.
- Let emotions and sentiments work for you
- ALWAYS Use Proper Risk Management In Your Trades
#usoil
#crudeoil
#wti
#brentoil

Will Brent oil stop its correction?📊 Due to the price approaching the supply range of $79.0 and the downward momentum of the price movement, if the range of 78.0 units is broken and the price stabilizes below it, the price may fall to the range of 76.6 🎯and in the case of the strength of the range of 74.0 units🎯🎯.
📊 Otherwise, the possibility of price increase up to the range of 81.0 units.

USOIL AMAZING BULLISH OPPORTUNIY Confirmed !!Hello guys ,
it seems usoil started a bullish reversal after Breaking the neckline of the double bottom and an important keylevel on the daily tf.
if the price manages to do a pull back towards the area where the trendline + poc + demand zone is it could give a great great buying opportunity .
Update the PULLBACK was done exactly as expected am waiting for reversal signals for a long trade
lets wait and see !

CRUDE OIL (WTI) Important Breakout 🛢️
Crude Oil broke and closed above a key daily structure resistance.
The broken structure turned into support.
We can anticipate a bullish movement from a broken structure.
Next resistance - 78.40
❤️Please, support my work with like, thank you!❤️

BRENT UKOil Trade IdeaA recent bullish trend is evident in BRENT UKOil on the 4-hour time frame, marked by the development of higher highs and higher lows. My approach involves anticipating a retracement into the 50-61.8% Fibonacci zone, creating a favorable discounted entry point. It is essential to emphasize that this analysis is merely an educational idea and should not be interpreted as financial advice.

CRUDE OIL (WTI) Bearish Move From Key Level 🛢️
WTI Crude Oil formed a double top pattern after a test of a strong horizontal resistance.
Its neckline breakout is a strong bearish confirmation.
We can anticipate a retracement at least to 73.0 level now.
❤️Please, support my work with like, thank you!❤️

CRUDE OIL (WTI): Important Key Levels to Watch Next Week 🛢️
Here are the important key levels & structures to watch next week on WTI OIL.
Support 1: 69.3 - 70.4 area
Support 2: 67.7 - 68.7 area
Resistance 1: 75.2 - 76.2 area
Resistance 2: 78.5 - 79.7 area
Consider these structures for pullback/breakout trading.
❤️Please, support my work with like, thank you!❤️

BRNUSD_4HBrent crude oil 4-hour and mid-term time frame analysis The possibility of the formation of ABC corrective wave, which is currently expected to be in wave B, and after the end of the range, it will continue to rise towards the number and range of $83 and $85 as wave C. The main and important support number and range is 76 and 77 dollars.
