A complete review of Brent oil with Elliott styleConsidering that oil left its long-term correction process on April 20, 2022; It started an increasing and powerful process and increasing tensions and war made this process more powerful.
By carefully examining this trend, it can be said that this trend ended in 5 waves; And now, with the situation balancing a little, the stagnation, the increase in oil production, and at the same time the permission of Venezuela to enter the oil market; The price has entered price correction. It should be expected that this price correction will be in the form of a wave (ABC).
Considering the price movement in the lower time frame, it can be expected that wave A will be formed in the form of 5 waves.
I believe; Currently, wave 1 is being completed, so we have to wait for wave 2 to be created.
If the end of wave 2 is 115; This analysis is complete and you can make the most of the other waves shown.
It should be considered that with the price reaching the range of 36-39.5 in the consolidation of the higher time frame, this whole movement can be considered as wave 1 and 2.
Tip: We have to see how the trend will be formed along the downward path; It is possible that this entire decline in price can be shown in the higher consolidation of an A wave.
In any case, upon reaching the price range of 36 to 39.5, the trend should be re-examined and a new analysis should be presented.
This analysis is prepared with an economic perspective; But from a human point of view, I am very sorry for the war and I sincerely sympathize with Ukraine.
what is your opinion ?
(be profitable)
Brentoilanalysis

#BRENTCRUDEOIL Still making higher lows within triangleIts no surprise anymore that OIL and energy stocks have been one of the only places to find some alpha this year. Even with oil taking a bit of a beating lately, looking at the technicals we are still in a very healthy shape for the time being with Brent Crude making higher lows within this triangle formation and well above its ascending 200 day moving averages. Until this breaks down, you have to give energy the benefit of the doubt to run higher this year..

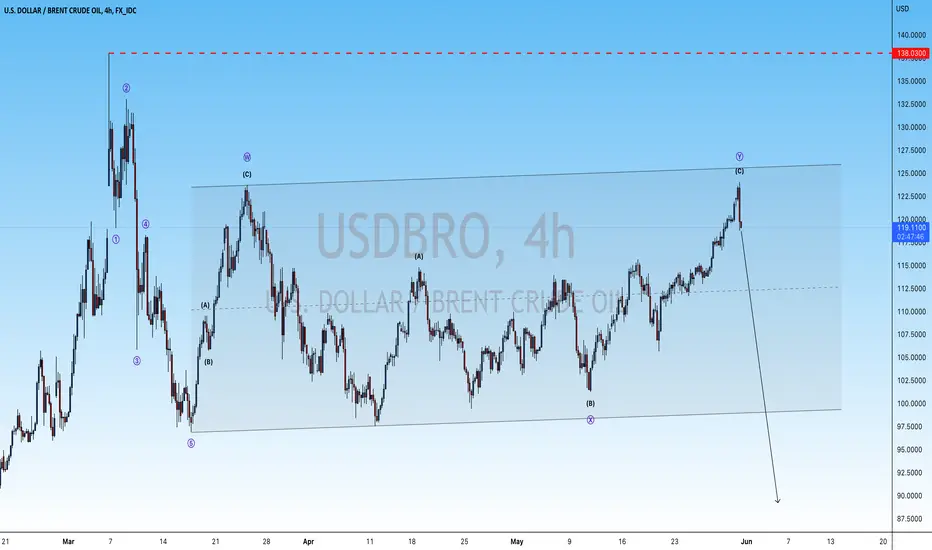
USDBRO SELLHi fellow traders, Brent crude oil is completing the flag correction in WXY formation. We can look for downside from here. Target 90 area. Goodluck!
Brent: Knock, Knock!After it has knocked at the resistance line at $112.43 already twice, we expect Brent to rise above this mark and into the white zone between $113.88 and $123.14 to finish wave (2) in white. Afterwards, Brent should fall below the support lines at $104.67 and $97.56. There is a 28% chance, though, that Brent could soar through the white zone and climb above the resistance at $123.71 until the bottom of the pink zone between $133.80 and $137.40 first before moving downwards.

Brent: GlueyBrent is currently glued to the resistance at $114.74, where it has finished wave b in blue. However, we expect it to let go of this mark soon to fall into the turquoise zone between $101.67 and $99.83. There, it should complete wave a in turquoise and move back above $104.67 afterwards to finish wave b in turquoise. After that is settled, Brent should gradually fall below the support lines at $104.67, $97.56 and $93.57. There is a 40% chance, though, that Brent could climb above $114.74 and make a detour through the green zone between $117.78 and $133.52 first before moving downwards.

Brent: Parking Assistant 🚗Beep beep, beepbeepbeep, beebeepbeepbeepbeeeeeep
Brent seems to have afforded a parking assistant, judging by the neat way in which it has entered our white zone between $106.12 and $99.47 to finish wave c in blue and wave (B) in white. We expect it to turn around soon and to head for the next parking lot above $114.74, the green zone between $117.78 and $133.52. After Brent has completed wave B in green and wave (C) in white there, it should turn again and home in on the support at $97.56.

UKOIL LONG - Buy Entry - H4 ChartUKOIL LONG - Buy Entry - H4 Chart
Buy @ Market
Symbol: UKOIL BrentOil
Timeframe: H4
Type: BUY
Entry Price: Buy @ Market
Resistance @ 117.209
Resistance @ 114.778
Resistance @ 111.456
Support @ 105.692
Support @ 104.437
✅ If you liked this analysis, please consider Following and giving it a Thumbs Up 👍
✅ If you have any feedback or questions, please leave a comment below as I answer each comment 💬
✅ Wishing you enjoyable successful trading 🙏

Brent: Watch Your Head! 🤕Brent has been climbing and climbing and climbing and has actually maxed out the space until $114.74. There, it has finished wave (A) in white, butting its head at the resistance line, and subsequently turned around to move downwards. We expect Brent to drop into the green zone between $106.12 and $99.47 to recover and to complete wave (B) in white. Then, it should start to rise again, breaking through the resistance at $114.74 this time. After finishing wave (C) in white as well as wave B in green, ideally in the lower third of the green zone between $117.78 and $133.52, Brent should turn again, heading in the direction of $97.56.

$UKOIL - Conflicts, COVID, Sanctions, Triangle patternHi guys! 👋🏻
🔔 Conflicts, military operations, sanctions, COVID seem to be the headlines of 2022
🔔 The bursts of conflicts globally looks so intense that they might be the main drivers of oil prices.
🔔 I really don't think that EU will embargo Russian oil but if they really do, BRENT will hop to $160 easy, which according to the chart here is very possible.
🔔 For now, I'm expecting a slight correction here with a potential on a jump to $123.
✊🏻 Good luck with your trades! ✊🏻
If you like the idea hit the 👍🏻 button, follow me for more ideas.

Crude Oil WTI BuyA break of down trendline, may we see a change in direction of price to the up side. lets buy BLACKBULL:WTI at current price.

brent oili never trade this, but look nice, bat pattern with a triangle formation, pretty good actually

CL1 CRUDE BRENT OIL- IS OIL STILL A GOOD TRADE ?Oil may be in a reversal now or going through corrections as the markets get use to the the Russian Invasion in Ukraine. I don't believe that US and NATO will be successful at imposing oil embargo sanctions on Russia. Therefore I am bearish and will be shorting oil etfs..
Give me a thumbs up if you enjoyed this TA,
PS. Disclaimer
I’m not a certified financial planner/advisor, a certified financial analyst, an economist, a CPA, an accountant, or a lawyer. I’m not a finance professional through formal education. The contents on this TA,(Technical Analysis) are for informational purposes only and do not constitute financial, investment, trading, accounting, or legal advice. I can’t promise that the information shared on my posts is appropriate for you or anyone else. By using or reading this technical analysis or site, you agree to hold me harmless from any ramifications, financial or otherwise, that occur to you as a result of acting on information found on this analysis, or post.

UKOil Brent LONG - Buy Entry - H4 ChartUKOil Brent LONG - Buy Entry - H4 Chart
Buy @ Market
Symbol: UKOil Brent
Timeframe: H4
Type: BUY
Entry Price: Buy @ Market
TP - Major Resistance @ 121.460
TP - Major Resistance @ 115.075
Major Support @ 106.786
Major Support @ 105.385

Crude Oil price is in an important area in W1 Time frameRight now the price has reached to the top of the descending channel and also an important resistance level; BUT this movement from channel bottom to the top was very aggressive. So we have to wait and see the reaction to this Level and because of that I will not take any positions for now.

Brent Back to 75, then 80 this time!Brent is looking good, and seems to have stabilised.
I think we are good to do BUY now.
target 1 = 75
target 2 = 80.

Brent: A lot to do! 🛢️🛢️🛢️The course is very busy surging to old highs. We expect Brent crude to push gains towards areas around $90.88, before relaxing a bit. However, this should not last long as we see the price reach heights of above $96 in the mid-run.
A good outlook!

Brent: Money Zone! 🤑🤑🤑Yes, the oil market is as bullish as it gets. Therefore, we are sharing our trading zone here. We expect the price to fall in this area and soar from there!
Happy trading!

UKOIL DAILY TIMEFRAMESNIPER STRATEGY
CFDs on Brent Crude Oil 1D TVC
I warn you again this strategy is unable to predict pullbacks but it will pay off at the end of the road
Start Believing
Something Magical will happen

Oil is on a daily downtrendThe general trend in daily time seems to be declining.
But now it seems to be a good place to enter the hourly time.
The new support level seems to be broken and the return to the new resistance level is complete and it is time to fall.

Oil analysis updateOil ended the week on 64 zone
Probably it will be consolidating
Between 65-64
Strong bearish pressure, no sign of reversals yet
Will update after next structure

Does oil affect Bitcoin? Ans: Yes, but marginally related!
Dear traders:
U.S. oil drops as much as 8% to below $70 as OPEC prepares to boost production.
Whenever oil prices crash, the digital economy destabilizes. it seems reasonable that the two (Oil, BTC) assets’ price movements would only be marginally related:
why?
1- oil is becoming ever more connected with the demand side of the global economy (demand: China.
Production: Iraq, Iran, Saudi Arabia...) .
2- Bitcoin was originally developed (partly) as a response to the US government's manipulation of the money supply (United States).
The production of oil has become greater in recent years and the availability of an increasing supply of oil puts downward pressure on the commodity. In contrast, Bitcoin’s supply is fixed. It will never have ups and downs in discovery of new product. This certainty explains perhaps some of the divergence between the two prices at certain times.
Source:
www.swissbullion.eu

Expect BRENT Up todayBrent came down exactly as expected yesterday with EIA results not giving much reason for further increase.
Formed a wedge during teh fall, expect price to retrace to around 72.3 today. nice quick opportunity there.

Brent to reach $85?I've been bullish on FX_IDC:USDBRO ever since it traded above its 200EMA. Bought few contracts, rode the trend from $43 to $69.
Last week Brent closed above $71, looking back, this was/is an area of value. Now that the price is above $71, I'm bullish once again, targeting the $85 region, with a stop below the 50EMA.
