GBPUSD - BULLISH MOVE 📈
As We Talked in The Previous Analysis:
The GBPUSD Price Reached A Resistance Level (1.24980 - 1.25484)
Currently, This Key Level is Broken and Becomes a New Support Level.
So, I Expect a Bullish Move.
I'm Waiting For Retest...
-----------
TARGET: 1.27000🎯
Britishpound

GBP/USD -28/11/2023-∙ British Pound is also benefitting from weakening USD and falling yields
∙ Bullish trend intact as long as above the ascending trend line
∙ Bulls and bears are battling through the 1.2660-70 level (September 2020 low and August 2018 low)
∙ The above level needs to be cleared for further gains through 1.2850 (200 SMA) followed by the psychological level at 1.30 and 1.31 yearly high

GBPUSD - 2 SCENARIOS 📉📈Hello Traders !
Today, The GBPUSD Price Reached A Resistance Level (1.24980 - 1.25484)
Currently We Have 2 Scenarios:
Bullish Scenario📈
If The Price Breaks and Closes Above The Resistance Level !
We Will See a Bullish Move📈
TARGET: 1.27000🎯
Bearish Scenario📉
If The Market Breaks Higher Low and Closes Below That
I Will Sell On Retest...
TARGET: 1.22260🎯

HelenP. I British Pound can exit from wedge and continue to growHi folks today I'm prepared for you British Pound analytics. A few moments ago, the price rebounded from support 2, which coincided with the support zone and started to rise to support 1. After this price around down and fell back to support 2 in a short time. Then price a little time traded near this level and later made impulse up to support 1, which coincided with the support zone. The British Pound broke this level, but at once fell to the trend line, thereby making a fake breakout. Next, the price started to rise inside an upward wedge, where it soon made a strong upward impulse higher than support 1, breaking this level again. After this movement, the price declined to the trend line, but a not long time ago it rebounded from this line and rose to the resistance line of the wedge, where it continues to trades near to this day. Now, I expect that the British Pound can decline a little more, and then the price rebound higher than the resistance line, thereby exiting from the wedge. That's why I set my target at the 1.2710 level. If you like my analytics you may support me with your like/comment ❤️

GBPNZD Sell every Channel Down top.The GBPNZD pair has enter a Channel Down pattern with the 1D MA50 as its pivot. A similar pattern emerged in May 2022, after the pair made an identical top and bottom (see the blue Rectangle). This time we have an additional support in the form of the 1D MA200 (orange trend-line) but as long as the price trades within the Channel Down, sell every Lower High and target the 1D MA200.
If the price closes a 1D candle below the 1D MA200, we have to start considering a long-term shift to a bearish trend and sell after the first rebound to the 1D MA50, while a closing above th 0.618 Fibonacci level will be bullish, targeting the 2.1500 High.
-------------------------------------------------------------------------------
** Please LIKE 👍, FOLLOW ✅, SHARE 🙌 and COMMENT ✍ if you enjoy this idea! Also share your ideas and charts in the comments section below! This is best way to keep it relevant, support us, keep the content here free and allow the idea to reach as many people as possible. **
-------------------------------------------------------------------------------
💸💸💸💸💸💸
👇 👇 👇 👇 👇 👇

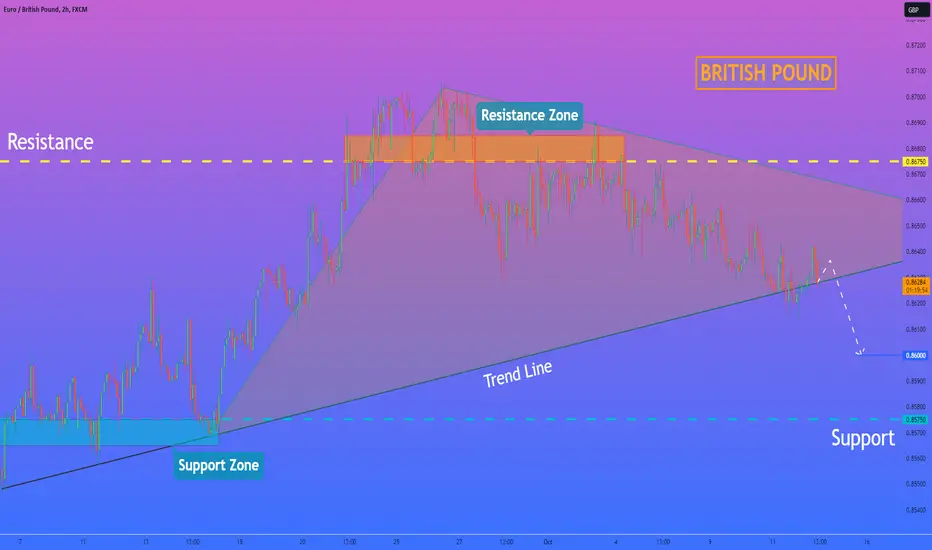
EURGBP - Price can rise a little and then bounce down to $0.8665Hi guys, this is my overview for EURGBP, feel free to check it and write your feedback in comments👊
After price entered to rising channel, it reached $0.8720 resistance level, which coincided with resistance area.
Price broke this level and rose to resistance line of channel, but soon it bounced below $0.8720 level to support line, exiting from channel.
Later British Pound bounced from support line and made upward impulse to $0.8765 points, breaking $0.8720 level again.
But then, price started to decline in falling channel, where it broke support line and fell below resistance level.
British Pound tried to back up, but failed and now trades near support line of falling channel, so I think it can rise a little.
Then price can continue to decline to $0.8665 support line of channel.
If this post is useful to you, you can support me with like/boost and advice in comments❤️

GBPAUD Sell gaining ground but needs the 1D MA200 to confirm.The GBPAUD pair broke below the long-term Channel Up that it has been trading in since the start of the year and a Channel Down emerged as last week we had a rejection on the 1D MA100 (green trend-line). That is the top (Lower Highs trend-line) of the Channel Down and the most optimal sell entry. However the 1D MA200 (orange trend-line) is still supporting, so we need a candle closing below it in order to confirm the sell (earlier confirmation would be the 2nd MACD Bearish Cross).
In that case we will target the 1W MA100 (red trend-line) at 1.8300 (which will also by a symmetrical to the first bearish leg -5.75% drop). If however we close a 1D candle above the 1D MA100 first, we will take the loss and open a buy that will target Resistance 1 at 1.997800).
-------------------------------------------------------------------------------
** Please LIKE 👍, FOLLOW ✅, SHARE 🙌 and COMMENT ✍ if you enjoy this idea! Also share your ideas and charts in the comments section below! This is best way to keep it relevant, support us, keep the content here free and allow the idea to reach as many people as possible. **
-------------------------------------------------------------------------------
💸💸💸💸💸💸
👇 👇 👇 👇 👇 👇

GBPUSD - BULLISH MOVE 📈
As We Talked in The Previous Analysis:
The GBPUSD Price Reached A Strong Support Level (1.20512 - 1.19931).
Currently:
-The Resistance Level (1.23376 - 0.53574) is Broken and Becomes a New Support Level.
The Resistance Line is Broken.
So, I Expect a Bullish Move📈.
Currently,
The Price Pull Back to Support Line !
and Now it Will Continue its Bullish Movement !
-----------
TARGET: 1.24860🎯

GBPUSD - Resistance Becomes SupportHi Traders !
On The Weekly Time Frame, The GBPUSD Price Reached A Strong Support Level (1.20512 - 1.19931).
Currently:
-The Resistance Level (1.23376 - 0.53574) is Broken and Becomes a New Support Level.
The Resistance Line is Broken.
So, I Expect a Bullish Move📈.
i'm waiting for retest...
-----------
TARGET: 1.24860🎯

GBPJPY: Great sell opportunity approaching.GBPJPY is on a bullish technical outlook on the 1W timeframe (RSI = 66.035, MACD = 3.180, ADX = 33.852) but a great sell opportunity may be emerging as the 1W RSI Bearish Divergence crossed above the MA just like the on October 4th 2021. That was the third top on that pattern much like the one that is being formed now. Technically next week we should see the top. Our target is a little over the S1 level (TP = 178.500).
See how well our prior idea has worked:
## If you like our free content follow our profile to get more daily ideas. ##
## Comments and likes are greatly appreciated. ##

GBPJPY - New Breakout 📈
Hello Traders !
As We Talked in The Previous Analysis:
The GBPJPY Price Reached a Daily Support Level (180.750 - 180.093) and Broke The Resistance Line
Currently,
The Price Created a Rectangular Range.
The Upper Resistance is Broken.
So, I Expect a Bullish Move📈
i'm waiting for retest...
-----------
TARGET: 185.920🎯

GBPJPY - BULLISH MOVE 📈
As We Talked in The Previous Analysis:
The GBPJPY Price Reached a Daily Support Level (180.750 - 180.093) and Broke The Resistance Line
Currently,
The Price Created a Rectangular Range.
The Upper Resistance is Broken and Becomes a new Support Level.
The Price Created a Correction and Touched The Support Level!
and Now it Will Continue its Bullish Movement !
-----------
TARGET: 185.920🎯

EURGBP - Change of Character 📉Hello Traders !
On The Daily Time Frame, The EURGBP Price Reached A Strong Resistance Level (0.87348 - 0.87190).
Currently, The Price Failed To Create a New Higher High.
The Last Higher Low is Broken (ChoCh).
The Support Line is Broken.
So, I Expect a Bearish Move📉.
i'm waiting for retest...
-----------
TARGET: 0.86260🎯

GBPJPY - Perfect Breakout !
Hello Traders !
As We Talked in The Previous Analysis:
The GBPJPY Price Reached a Daily Support Level (180.750 - 180.093)
Currently, The Price Formed an Inverted Head and Shoulders Pattern.
The Neckline is Broken.
The Resistance Line Was Broken and Became a New Support Line.
Currently, The Price Created a Correction and Touched The Neckline & Resistance Line
and Now it Will Continue its Bullish Movement !
-----------
TARGET: 185.800🎯
___________
if you agree with this IDEA, please leave a LIKE, SUBSCRIBE or COMMENT!

EURGBP Buy extension signal within the Channel Up.The EURGBP pair has been trading within a 2-month Channel Up pattern, with the current bullish leg rebounding on the 1D MA50 (blue trend-line) and even recently establishing the 1D MA200 (orange trend-line) as the latest Support.
With the 1D MACD on a Bullish Cross since the 1D MA200 break-out, we expect the rally to continue until 0.8000, which represents a new Higher High on a +2.14% symmetry with the previous rise, just above the 0.618 Fibonacci retracement level.
-------------------------------------------------------------------------------
** Please LIKE 👍, FOLLOW ✅, SHARE 🙌 and COMMENT ✍ if you enjoy this idea! Also share your ideas and charts in the comments section below! This is best way to keep it relevant, support us, keep the content here free and allow the idea to reach as many people as possible. **
-------------------------------------------------------------------------------
💸💸💸💸💸💸
👇 👇 👇 👇 👇 👇

GBPUSD Death Cross keeping it bearish unless the 4H MA200 breaksThe GBPUSD pair is extending the bearish trend within the 3-month Channel Down pattern. The 1D RSI remains bearish but normalized the previous oversold levels so now technically it can resume chasing much lower prices. As long as the price trades below the 4H MA200 (red trend-line), which sits now exactly at the top (Lower Highs trend-line) of the Channel Down and has been holding as Resistance since August 01, we remain bearish, targeting 1.1805 (Support 2).
If on the other hand it breaks above the 4H MA200, we see potentially a Channel Up emerging and we will buy instead, targeting 1.2435 (1D MA200 orange trend-line).
It is worth pointing out that on Tuesday the pair completed the first Death Cross on the 1D time-frame in more than 2 years (since September 01 2021). Certainly a pattern that favors selling.
-------------------------------------------------------------------------------
** Please LIKE 👍, FOLLOW ✅, SHARE 🙌 and COMMENT ✍ if you enjoy this idea! Also share your ideas and charts in the comments section below! This is best way to keep it relevant, support us, keep the content here free and allow the idea to reach as many people as possible. **
-------------------------------------------------------------------------------
💸💸💸💸💸💸
👇 👇 👇 👇 👇 👇

GBPJPY Head and Shoulders sell signalThe GBPJPY pair gave us a nice low risk sell trade last time we looked at it (see chart below):
This time it gives an even stronger one as it is on the 1W time-frame in the midst of a Head and Shoulders (H&S) formation. That is a bearish pattern calling for a a test of Support at 176.500. Most likely by the time of the test, the 1W MA50 (blue trend-line) will be very close to provide the first level of long-term Support.
Notice that the 1W RSI is on Channel Down pattern similar to the April - August 2021 H&S and so does the 1W MACD which is coming off a Bearish Cross. That pattern eventually hit its Support once completed.
-------------------------------------------------------------------------------
** Please LIKE 👍, FOLLOW ✅, SHARE 🙌 and COMMENT ✍ if you enjoy this idea! Also share your ideas and charts in the comments section below! This is best way to keep it relevant, support us, keep the content here free and allow the idea to reach as many people as possible. **
-------------------------------------------------------------------------------
💸💸💸💸💸💸
👇 👇 👇 👇 👇 👇

🚨EURGBP will Fall By Bump-and-Run Top Pattern🚨✅ EURGBP was able to make a Bump-and-Run Top Pattern .
🔨 EURGBP Broke the support line a few hours ago, and now it is on the Run phase of the Bump-and-Run Top Pattern.
🔔I expect the EURGBP will fall at least to the 🟢Support zone🟢 in the next hours.
Euro/British Pound Analyze ( EURGBP ), 4-hour time frame ⏰.
Do not forget to put Stop loss for your positions (For every position you want to open).
Please follow your strategy, this is just my idea, and I will gladly see your ideas in this post.
Please do not forget the ✅' like '✅ button 🙏😊 & Share it with your friends; thanks, and Trade safe.

GBPCAD - Bearish Double TOP 📉
Hello Traders !
On Friday 22 Sep, The GBPCAD Broke a Strong Support Level (1.65373-1.67148)
This Key Level Becomes a New Resistance Level.
The Price Created a New Correction in The Previous Week!
Currently, The Price Formed a Double TOP Pattern.
The Neckline is Broken.
So, I Expect a Bearish Move !
i'm waiting for retest...
-----------
TARGET: 1.63830🎯
___________
if you agree with this IDEA, please leave a LIKE, SUBSCRIBE or COMMENT!

HelenP. I British Pound can continue to decline to $0.8600Hi folks today I'm prepared for you British Pound analytics. A few time ago price bounced from the trend line and made a strong upward impulse to 0.8630 points, thereby breaking the 0.8575 support level. After this movement price made a correction to this level, which coincided with the support zone, and then repeated impulse to the 0.8675 resistance level, which coincided with the resistance zone too. Also, the British Pound entered to wedge, where it broke the 0.8675 resistance level and rose higher, but soon it rebounded below. The price tried to back up but failed and made an impulse down to trend lime, which coincided with the support line of the wedge. As well soon price made a fake breakout from this line, but failed and rose higher. But recently finally broke this line and now British Pound trades near. For my mind, the price can make a movement up, higher of the trend line, and then continue to decline. That's why I set my target at the 0.8600 level. If you like my analytics you may support me with your like/comment ❤️
EURGBP - Bearish Double TOP 📉Hello Traders!
The EURGBP Price Reached a Daily Resistance Level (0.87014 - 0.86951)
Currently, The Price Formed a Double Top Pattern.
The Neckline is Broken.
So, I Expect a Bearish Move📉
i'm waiting for retest...
-----------
TARGET: 0.86190🎯
___________
if you agreed with this IDEA, please leave a LIKE, SUBSCRIBE or COMMENT!

British Pound can continue to move up inside upward channelHello traders, I want share with you my opinion about British Pound. By observing the chart, we can see that the price some days ago started to decline inside the downward channel, where it broke the 1.2270 level and declined until to buyer zone, breaking the 1.2125 support level too. After this price rebounded and made a strong upward impulse to the 1.2270 level, which coincided with the resistance line, thereby exiting from the channel. Then the British Pound started to decline and at this moment it fell lower the buyer zone, but soon the price bounced and started to rise inside the upward channel. The inside channel happened gap, after which the price rose to the 1.2270 resistance level again, but this moment it has broken this level, and at the moment British Pound trades near. In my mind, the price can make a correction to the current support level and then it continues to move up. Therefore I set up my target at the 1.2340 level. Please share this idea with your friends and click Boost 🚀

GBPUSD:05/10/2023:🔴More fall for Pound🔴(Important caption)Well, as you can see, the market is totally bearish and we expect weakness of the pound against the American dollar.
I follow the price in 2 scenarios.
The first scenario (which I follow):
I expect that the supply zone can push the price lower at first to the liquidity pool, then to FVG and finally to sell-side liquidity.
Second scenario:
The previous High which is the High of the supply zone acts like a liquidity pool and the price moves higher to the bearish order block and then falls.
(I mentioned the second scenario just because it would be a perfect high-probability setup for a short position if it happens.)
💡Wait for the update!
🗓05/10/2023
🔎 DYOR
💌It is my honor to share your comments with me💌
