GBPJPY - BEARISH DOUBLE TOP PATTERN📉Hello Traders!
On Wednesday 16 The GBPJPY Price Reached A Monthly Resistance Level (186.098 - 186.805)
The Price Formed a Double Top Pattern.
The Neckline is Broken.
So, I Expect a Bearish Move📉
i'm waiting for retest...
-----------
TARGET 1: 180.750🎯
TARGET 2: 178.700🎯
___________
if you agreed with this IDEA, please leave a LIKE, SUBSCRIBE or COMMENT!
Britishpound

GBPCAD Waiting for a bullish extension confirmation.The GBPCAD pair has been trading within a Bullish Megaphone for the whole year and is about to test the 1D MA200 (orange trend-line). The recent rebound is taking place on strong technicals as it not only started on the 1W MA100 (red trend-line) but also after a 1D MACD Bullish Cross from oversold levels that we haven't seen since July 2019.
If the 1D MA200 breaks and closes a 1D candle above it, the bullish extension will be confirmed and we will buy, targeting the 0.786 Fibonacci retracement level at 1.71110.
-------------------------------------------------------------------------------
** Please LIKE 👍, FOLLOW ✅, SHARE 🙌 and COMMENT ✍ if you enjoy this idea! Also share your ideas and charts in the comments section below! This is best way to keep it relevant, support us, keep the content here free and allow the idea to reach as many people as possible. **
-------------------------------------------------------------------------------
💸💸💸💸💸💸
👇 👇 👇 👇 👇 👇

GBPNZD: Counter trend buy. Only short term.GBPNZD closed a strong 1D green candle yesterday, the first of this magnitude after almost one month. The 1D timeframe remains bearish technically (RSI = 39.063, MACD = -0.018, ADX = 72.262) so the trend is still bearish but as the 1D MACD is close to a Bullish Cross, and the 1D MA200 is holding, we can take a counter trend buy and target the R1 level (TP = 2.092225), and the 1D MA50, even though if it follows the stardard format of previous rises, it can go as high as 2.13000.
Prior idea:
## If you like our free content follow our profile to get more daily ideas. ##
## Comments and likes are greatly appreciated. ##

GBPUSD - Support Becomes Resistance Level 📉Hello Traders!
The GBPUSD Broke a Daily Support Level (1.23081-1.23744)
Currently, This Support Level Becomes a New Resistance Level.
So, I Expect a Bearish Move📉
i'm waiting for retest...
-----------
TARGET 1: 1.21970🎯
TARGET 2: 1.20515🎯
___________
if you agreed with this IDEA, please leave a LIKE, SUBSCRIBE or COMMENT!

British Pound can rebound down of resistance level to 0.8635Hello traders, I want share with you my opinion about British Pound. Observing the chart, we can see that the price some days ago price rebounded from the 0.8635 support level, which coincides with the buyer zone and started to fall. But later it entered to upward channel, where the price first made a fake breakout of the support line and then continued to grow to the 0.8635 level. After the price reached this level, the British Pound broke it and then made the correction, after which the price continued to rise. Price reached 0.8690 resistance level, which coincide with the seller zone, and even entered to this zone, but soon rebounded below to support line of the channel. Later, the British Pound rose higher of 0.8690 level again, entered to triangle, and started to decline to the support level, thereby exiting from the upward channel. In the triangle, the price rebounded from the support line, reached the resistance line, and a not long time ago broke this line, made a retest, and continued to rise. At the moment price British Pound trades very close to the resistance level, that's why I think that the price can rebound down from the resistance level to the 0.8635 support level, which is located my target. Please share this idea with your friends and click Boost 🚀

EURGBP Low risk trades on both sides.EURGBP is consolidating inside a wide Resistance (1) - Support (1) range since May.
Last week, the MA200 (1d) even came into play as a Resistance, rejecting the August bullish leg from breaking over on 4 straight candles.
It did however cross over the Falling Resistance of 2023.
Trading Plan:
1. Sell as long as the (1d) candles close under the MA200 (1d).
2. Buy if the top of Resistance Zone (1) breaks.
Targets:
1. 0.85500 (over Support 1).
2. 0.88750 (Resistance 2).
Tips:
1. The MACD (1w) has formed since mid September a Bullish Cross. Being on the bearish side, it is a strong sign of bullish potential.
Please like, follow and comment!!
Notes:
Past trading plan:

GBPUSD - Price can bounce down from resistance area to $1.2000Hi guys, this is my overview for GBPUSD, feel free to check it and write your feedback in comments👊
Some days ago price started to trades inside flat, in which it fell to $1.2620 resistance level, but at once bounced up.
Price tried to rise, but failed and started to decline and in a short time, it fell below $1.2620 level, thereby exiting from flat.
Also, British Pound later entered a falling channel, where price declined until the support line, breaking $1.2620 and $1.2265 levels.
Then, price bounced from this line and rose to $1.2265 level, but recently it declined and now GBP trades near resistance area.
I think that British Pound can rise to resistance area and then it bounce down to $1.2000 support line of falling channel.
If this post is useful to you, you can support me with like/boost and advice in comments❤️

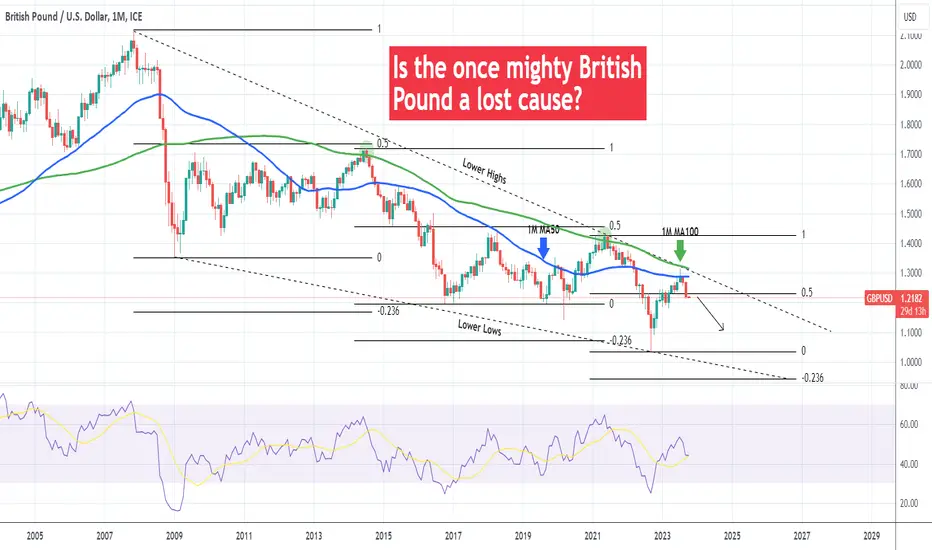
GBPUSD Is it really that doomed??The GBPUSD pair has completed 2 straight red months (1M candles) after an emphatic rejection within the 1M MA100 (green trend-line) and 1M MA50 (blue trend-line). We rarely look at the 1M (monthly) time-frame but this time it is needed in order to gain a long-term perspective following this rejection and bearish reversal.
July's rejection took place none other than the Lower Highs trend-line, the multi-decade Resistance level that started during the 2007/08 Housing Crisis. As you can see this is where the May 2021 top was rejected too. We can view this 16 year price action as a Falling Wedge. Every Lower Highs of the Wedge has been price near the 0.5 Fibonacci retracement level and every Lower Low near the -0.236 extension.
So as the title says, is the British Pound doomed? Well on 1 year perspective at least, chances are we should see it testing 1.1000 (at least). The -0.236 extension is much lower at 0.9450. Perhaps 1.0000 (parity) could be a fair target inside 2025. Keep in mind however that Falling Wedges have a tendency to break upwards aggressively. Not entirely applicable to such long term price action (that is vastly affected by fundamentals) but it gives us a certain degree of perspective. We could see the Falling Wedge breaking upwards around 2027.
Do you think GBPUSD will keep dropping until then?
-------------------------------------------------------------------------------
** Please LIKE 👍, FOLLOW ✅, SHARE 🙌 and COMMENT ✍ if you enjoy this idea! Also share your ideas and charts in the comments section below! **
-------------------------------------------------------------------------------
💸💸💸💸💸💸
👇 👇 👇 👇 👇 👇
EURGBP Bullish over the 1day MA200, bearish under it.EURGBP hit this week the 1day MA200 and fot rejected but not too low.
As long as it holds the Resistance ground, feel free to sell and target the 1day MA50 and Rising Support at 0.86100.
If it crosses over the 1day MA200, buy and target Resistance A at 0.88750.
Notice: An RSI cross under its Rising Support may indicate a shift to a more bearish momentum.
Follow us, like the idea and leave a comment below!!

GBPAUD: Oversold and in need of a reaction.GBPAUD turned briefly oversold on the 1D technical timeframe (RSI = 30.322, MACD = -0.013, ADX = 62.269) while pricing a LLL at the bottom of the Channel Down and the S1 level. The latter in particular can attract considerable buying power to push it for a 1D MA50 and R1 Zone test. This will determine the trend onwards but on the short term following 6 weeks of downtrend, a reaction should be expected. TP = 1.93000.
## If you like our free content follow our profile to get more daily ideas. ##
## Comments and likes are greatly appreciated. ##

GBPNZD The massive sell-off can extend below 2.000The GBPNZD pair is on a massive 6-week sell-off that has broken below June's and July's Low. The 1W RSI turned bearish below 45.00 and the next line of Support is the 1D MA50 (blue trend-line). In the past 5 years, every sharp sell-off on GBPNZD has been at least -9%. A potential new such decline gives us a target estimate just below Support 1 (1.97550). That is the target that we will pursue but if the 1W RSI hits the 34.00 Support earlier, we will close it on the market price regardless. The next bounce should hit at least the 0.5 Fibonacci retracement level but that can be calculated after the bottom is formed.
-------------------------------------------------------------------------------
** Please LIKE 👍, FOLLOW ✅, SHARE 🙌 and COMMENT ✍ if you enjoy this idea! Also share your ideas and charts in the comments section below! **
-------------------------------------------------------------------------------
💸💸💸💸💸💸
👇 👇 👇 👇 👇 👇

GBPUSD Two buy entries. Keep a tight SL.GBPUSD has almost touched the Fibonacci 0.382 level from the bottom 1 year ago, trading under both the MA50 and MA200 (1d).
The RSI (1d) is rebounding today aggressively being still inside very rare oversold levels, which visited last time during September 26th 2022.
This justifies a long term buy but if the 0.382 breaks, the next (and strongest) Support Zone is over Fib 0.5.
Trading Plan:
1. Buy on the current market price.
2. Buy on 1.1850 (Support Zone 1).
Targets:
1. 1.2700 (+5.09%, the minimum range for 2023).
2. 1.2350 (again +5.09%).
Tips:
1. If we assume that the large pattern is a Channel Up, then its Higher Lows trendline falls around Fibonacci 0.5 and Support Zone (1). That enhances considerably the probabilities of this being a mega bottom.
Please like, follow and comment!!

GBPUSD Buy opportunity for fast profits.GBPUSD is trading inside a Channel Down on the 4hour chart.
The 4hour RSI is heavily oversold under 20.00 and the 4hour MACD is close to form a Buy Cross.
Every MACD Buy Cross in the past 30 days has delivered a minor rise.
Buy when this Cross is formed and target 1.2220 (under the 4hour MA50).
Follow us, like the idea and leave a comment below!!

GBPJPY: Small rebound expected to be a perfect sell entry.GBPJPY got flatly rejected on our last idea as it peaked on the HH trendline and crossed under the 1D MA50 (chart at the bottom of the analysis). Even the Channel Up broke downwards and the 1D technical outlook is bearish (RSI = 38.762, MACD = -0.520, ADX = 38.784) officially. A new Channel Down has emerged, which shifted the 4H MA50 to a Resistance after the September 6th breakdown.
Our trading approach includes waiting for the next 4H MA50 contact, sell it and target a new LL. As you see the 2.0 and 3.0 Fibonacci extensions almost match the S1 and S2 levels respectively. Our targets are formulates accordingly (TP1 = 180.400, TP2 = 177.000).
Prior idea:
## If you like our free content follow our profile to get more daily ideas. ##
## Comments and likes are greatly appreciated. ##

GBPAUD Most optimal buy here but bearish if broken.The GBPAUD pair has broken below the first Channel Up (dotted lines) and in extension the 1D MA100 (green trend-line). Currently it is testing the bottom of the second (and final) Channel Up (blue). Technically that is the most optimal level to buy for the medium-term and target 1.997800 (Resistance 1). On top of that, the 1D RSI bounced back after becoming oversold below 30.00, the lowest it has been since September 26 2022, which was the absolute market bottom.
If the price breaks below Support 1 (1.885250) we will have confirmation of a potential long-term bearish reversal. Then the ideal level to enter will be following a rebound on the 1D MA200 (orange trend-line) and a clear rejection near the 1D MA50 (blue trend-line) as we will have confirmation that it has become a Resistance and the market sells long-term. In that case our target will be 1.75000 (towards Support 3).
-------------------------------------------------------------------------------
** Please LIKE 👍, FOLLOW ✅, SHARE 🙌 and COMMENT ✍ if you enjoy this idea! Also share your ideas and charts in the comments section below! **
-------------------------------------------------------------------------------
💸💸💸💸💸💸
👇 👇 👇 👇 👇 👇

HelenP. I British Pound can continue grow to resistance levelHi folks today I'm prepared for you British Pound analytics. A few time ago price rebounded from the 1.2450 resistance level, which coincided with the resistance zone and entered to downward channel, where GBP started to decline. Inside the channel, the price broke the 1.2450 level, and some time traded below, but soon it continued to fall and in a short time declined to support line of the downward channel, which coincided with the 1.2235 current resistance level. The British Pound a few time traded near this level, but recently price broke it and declined to support line of channel again. Also a not long time ago it rebounded from the support line and now I think that GBP can continue to rise to a resistance level and try to break it. After the breakout, the British Pound can make a retest and then rebound up to the resistance line of the downward channel. For this case, I set two targets, the first target at the 1.2235 resistance level and the second - at the 1.2310 level, which coincides with the resistance line of the channel. If you like my analytics you may support me with your like/comment ❤️

GBPNZD - 15mGBPNZD experienced a substantial drop, recently reaching levels below the previous lows. There's a possibility it could recover, aiming for at least the last high.

GBPNZD Swing tradeBullish run at GBPNZD already stop after strong channel up break at Sept 13.
2.0500 as previous support also as fibonacci .382 still hold bearish movement. But if this support break,
next bearish target at .618 fibonacci support at 1.9877 with 623 pips target.
We can aim for bigger target at 2023 low at 1.8848 with 1661 pips profit projection.
This is long term trade, so I will update more bearish movement at 1 hour timeframe for intraday setup.
Happy trading

EURGBP To Parity and beyond#EURGBP peaked during the #GFC @ 0.98
I expect during these coming few years and possibly next financial crisis this to be run.
What does this suggest severe weakness in the UK economy
Or the ability and the magnitude of easing to come from the BOE to dwarf the ECB's response
either way trade with the prevailing trend would be my take
#HVF
@TheMarketSniper @TheCryptoSniper

GBPCAD - Bearish Move 📉Hi Traders!
The GBPCAD Broke a Strong Daily Support Level (1.65373-1.67148)
Currently, This Support Level Becomes a New Resistance Level.
So, I Expect a Bearish Move📉
i'm waiting for retest...
-----------
TARGET: 1.62790🎯
___________
if you agreed with this IDEA, please leave a LIKE, SUBSCRIBE or COMMENT!

EURGBP - Price can make retest support level and continue riseHi guys, this is my overview for EURGBP, feel free to check it and write your feedback in comments👊
When price bounced from $0.8555 support level, which coincided with support area, it rose a little higher, but soon fell below.
After this movement, British Pound made strong upward impulse to next support level, breaking $0.8555 level and entering to falling channel.
Inside channel price a few time later fell below $0.8555 level to support line, but then it bounced up to resistance line.
Also recently, British Pound exited from falling channel and soon rose higher than $0.8675 level, breaking it.
At the moment price trades in resistance area and I think British Pound can make retest of support level.
Then price can bounce from this level and continue to move up to $0.8750
If this post is useful to you, you can support me with like/boost and advice in comments❤️

GBPJPY Turning bearish until the end of the yearThe GBPJPY pair crossed under the MA50 (1d) again and is approaching the MA100 (1d).
We have a Rising Resistance peak pattern, which is very much like that of May 2021. In fact the whole fractal since its begining (2021) is very similar to today's (since 2023).
This most likely turns the pair bearish inside a Megaphone for the remainder of the year.
Trading Plan:
1. Sell every rise to the top (dashed line) of the Megaphone.
Targets:
1. Lower Lows until the price hits the MA200 (1d).
Tips:
1. The RSI (1d) also shows high symmetry between the fractals. It peaked on the first Higher High of the Rising Resistance, breached the MA50 (1d) when the RSI was near 40.00 and made the second Higher High (and peak) around the 70.00 mark.
Please like, follow and comment!!
Notes:
Past trading plan:

EURGBP: Approaching the 1D MA200. Strong Resistance Band.EURGBP is on a strongly bullish 1D technical outlook (RSI = 67.813, MACD = 0.002, ADX = 32.512) as it is rising on HL since the 0.84950 bottom. The 1D MA50 has been turned into Support but the price is now approaching the first important Resistance levels for the long term, R1 (0.87025) and more importantly the 1D MA200. If it achieves a candle close above, we will go long and target R2 and the 0.786 Fibonacci level (TP = 0.88750). If rejected on the 1D MA200, we will go short and target the 1D MA50 - HL zone (TP = 0.86200).
## If you like our free content follow our profile to get more daily ideas. ##
## Comments and likes are greatly appreciated. ##
