Steal the Breakout: Broadcom Bulls Are In!💎🔓 "Broadcom Break-In: Bullish Vault Raid in Progress!" 🔓💎
🌟Hi! Hola! Ola! Bonjour! Hallo! Marhaba!🌟
Dear Money Makers & Market Robbers 🤑💰✈️,
It’s time for a high-stakes raid on BROADCOM, INC (AVGO) — all based on our secret Thief Trading Strategy™, combining sharp technicals & a sniff of fundamentals.
🕵️♂️ Mission Brief:
Our target is the Bullish Vault – a swing/day trade play with upside momentum. The chart reveals a possible trap at overbought zones where unsuspecting bears get lured in... and we walk out rich! 😏💸
🎯 The Heist Blueprint:
📥 Entry (Buy-In Point):
🚪 “The vault’s open – grab the bullish bags!”
Swipe any bullish setup on the 15m/30m timeframe
Ideal: Buy Limit near recent swing low (support levels)
📳 Set alerts to stay ready – we rob smart, not fast
🛑 Stop-Loss (Escape Plan):
Place SL below recent 30m swing low — approx. 269.00
Adjust by your lot size & number of trades
Don't risk the whole bag – we ain't greedy thieves 😈
📈 Target (Take-Profit Point):
🎯 First Exit Zone: 296.00
💨 Or vanish before the cops (market reversal) arrive
🧲 Scalpers’ Secret:
Only scalp long – don’t fight the bullish flow
Got big capital? Enter early. Small bag? Join the swing crew
Use Trailing SL to guard your stolen gains 🏦🔐
💡 Behind the Heist:
AVGO is showing bullishness thanks to:
📰 Macro Drivers • COT Reports • Institutional Bias
📊 Sentiment Analysis • Index Correlations
💥 Geopolitical Developments – Always stay updated
🔎 Want more intel? Dive into the news, fundamentals, & positioning data that power this trade idea 💣
⚠️ Trade Smart, Thieves:
📛 News events cause chaos – avoid fresh entries during releases
📉 Use trailing stops to secure your loot & dodge slippage
💖 Like the Heist Plan? Hit Boost!
Let’s build the most notorious money-making crew on TradingView! 🚀
Daily gains using the Thief Style™ – not for the faint-hearted.
🔒 Stay sharp, trade like a phantom, and keep stacking that digital cash!
💬 Drop a comment if you’re in the gang – another plan’s coming soon! 🤑🐱👤
📌 Note: This is a general market analysis. Do your own due diligence before risking real capital.
📌 Stay updated — the market changes fast. Adapt or get trapped.
Broadcom

Broadcom - This was just the first all time high!Broadcom - NASDAQ:AVGO - just created new highs:
(click chart above to see the in depth analysis👆🏻)
Over the course of the past three months, Broadcom has been rallying an impressive +80%. However looking at market structure, all of the previous "dump and pump" was not unexpected. Following this recent bullish strength, Broadcom is likely to channel a lot higher.
Levels to watch: $250, $400
Keep your long term vision!
Philip (BasicTrading)

AVGO – All-Time High Breakout with Flag Pattern TriggerBroadcom ( NASDAQ:AVGO ) is breaking out of an 11-day consolidation flag, pushing through the trendline and into all-time highs — a textbook momentum setup.
🔹 Flag Pattern Breakout
After a strong run, NASDAQ:AVGO spent 11 days chopping in a tight flag just under highs.
Today, we’re seeing a clean trendline break, signaling the start of a potential fresh leg higher.
ATH breakout + flag pattern = momentum trader’s dream.
🔹 My Trade Plan:
1️⃣ Entry: Long on the flag breakout and trendline break.
2️⃣ Risk Level: Stop is down at $247, just under the consolidation base.
3️⃣ Target: Riding the trend — trailing stop strategy once price confirms above highs.
Why I Like This Setup:
Strong consolidation near highs = no weakness.
Breakout is happening with clean structure and clear volume pickup.
NASDAQ:AVGO is a leader name — when it goes, it goes.
LONG | AVGO (Broadcom) | 1DScenario 1 – Pullback to Structure Zone
Entry: $211.01
Stop Loss: $198.33
Target: $259.05
Risk:Reward: ~1:3
Structure: Pullback to key fib level (~38.2%) and prior breakout base.
Market Logic: Reclaiming structure post pullback; trend resumption with minimal drawdown.
Scenario 2 – Deep Demand Zone
Entry: $187.68
Stop Loss: $162.10
Target: $263.77
Risk:Reward: ~1:3
Structure: 61.8% fib + institutional demand cluster; "if market breaks deep", re-entry possible here.
Market Logic: Value-buy zone; often unfilled unless broad market correction. Ideal for swing/position trader allocations.
_______________________________
Business Model & Sector Positioning
Core Focus: Broadcom designs and develops semiconductors and infrastructure software solutions. Their chips power AI data centers, 5G infrastructure and cloud networking—key growth pillars.
AI Exposure: AVGO provides custom silicon to hyperscalers like Google and Meta. Its next-gen networking and AI accelerator chips are integral to expanding AI workloads, which fuels earnings upside.
Earnings & Financial Momentum
Recent Results (Q2 FY25):
Revenue up ~43% YoY, beating consensus.
EPS surged ~50% YoY, driven by data center demand.
AI-related revenues now make up nearly 25% of total sales.
Guidance Raised: Management upgraded full-year revenue targets—signaling internal confidence.
Analyst Consensus & Institutional Flow
Buy Ratings: >85% of analysts rate AVGO a Buy.
Price Targets: Median PTs have moved from $260 to $285 post-earnings.
Ownership: High institutional interest—Vanguard, BlackRock and State Street are among top holders.
Dividends: Pays a sustainable dividend (~1.8% yield), increasing yearly—strong signal of financial health.
Macro Environment
Interest Rate Outlook: With the Fed expected to cut by late 2025, tech stocks are well-positioned. Lower yields boost growth stock valuations like AVGO.
Capex Trends: Global cloud providers are increasing AI data center spending—Broadcom is a primary beneficiary.
___________________________
Conclusion
Why The Setups Work Fundamentally:
$211.01 Entry: Technical pullback + fundamental tailwind from raised guidance.
$187.68 Entry: Deep value zone backed by secular demand + institutional conviction in AI.
Both zones represent opportunistic entries into one of the most fundamentally sound AI infrastructure plays, with upside tied to macro tech trends, strong earnings, and durable cash flow.

AVGO Broadcom Options Ahead of EarningsIf you haven`t bought AVGO before the rally:
Now analyzing the options chain and the chart patterns of AVGO Broadcom prior to the earnings report this week,
I would consider purchasing the 250usd strike price Calls with
an expiration date of 2025-6-13,
for a premium of approximately $14.75.
If these options prove to be profitable prior to the earnings release, I would sell at least half of them.
Disclosure: I am part of Trade Nation's Influencer program and receive a monthly fee for using their TradingView charts in my analysis.

Broadcom (AVGO) Stock Price Rose by Approximately 25% in MayBroadcom (AVGO) Stock Price Rose by Approximately 25% in May
According to available data:
→ AVGO's closing price on 30th April was $192.42
→ The closing price on 30th May was $241.59
The 25% increase in Broadcom (AVGO) stock price made it one of the leaders in the market. For comparison, the S&P 500 index (US SPX 500 mini on FXOpen) rose just over 6%.
Why is the AVGO stock price rising?
Among the bullish factors contributing to the growth of Broadcom (AVGO) stocks in May were:
→ Growing demand for AI infrastructure. This stimulates demand for Broadcom’s products—such as high-performance networking chips, which are critical for building and scaling data centres for AI.
→ Positive news related to the successful integration of the previously acquired company VMware into Broadcom's business.
→ Optimism ahead of Broadcom’s quarterly earnings report, scheduled for 5th June.
Technical Analysis of AVGO Stock Chart
Price movements in May formed an ascending channel (shown in blue).
From a bearish perspective: AVGO stock has risen to the psychological level of $250, which has acted as resistance since December 2024. Additionally, the strong rally in May may motivate some investors to sell previously purchased shares to lock in potential profits.
From a bullish perspective:
→ The price is in the upper half of the channel, which confirms strong demand.
→ A bullish gap highlighted a buyer-favoured imbalance around the $215 level.
Technically, it would be reasonable to expect a corrective move from the $250 resistance deeper into the ascending channel. However, considering the upcoming earnings report—which often triggers volatility—the bulls could attempt to break through the $250 level and set a new all-time high.
This article represents the opinion of the Companies operating under the FXOpen brand only. It is not to be construed as an offer, solicitation, or recommendation with respect to products and services provided by the Companies operating under the FXOpen brand, nor is it to be considered financial advice.

Broadcom (AVGO) is triggering a powerful breakout todayNASDAQ:AVGO – High Tight Flag + Range Breakout Setup
Broadcom ( NASDAQ:AVGO ) is triggering a powerful breakout today with two bullish patterns stacking up — a high tight flag and a larger range breakout.
🔹 High Tight Flag Breakout
Price action has been coiling tightly just under recent highs — a textbook high tight flag formation.
These setups often lead to strong continuation when they break with volume.
🔹 Range Break in the Works
We're now pushing through the $233–$234 zone, a key resistance level that has capped price recently.
A breakout here opens the door for a major trend continuation.
🔹 My Trading Plan:
1️⃣ Position: I’m playing the $235 calls for next week.
2️⃣ Entry Trigger: Breakout through the $234 level with volume.
3️⃣ Stop Loss: Stop will be based on intraday price action — likely below the 9 EMA or breakout level to manage risk.
🔹 Why This Setup Has Juice:
Strong consolidation near highs is a sign of strength, not weakness.
This is the kind of pattern where institutions start piling in.
Dual setup (flag + range breakout) increases probability of follow-through.
⚠️ Risk Management: Tight stop under breakout zone — manage risk, stay nimble.

Broadcom Inc. (AVGO): Software-Driven Growth Meets AI Hardware ECompany Overview:
Broadcom NASDAQ:AVGO is undergoing a strategic transformation—shifting from a hardware-centric model to a hybrid software and subscription platform. The VMware acquisition is proving pivotal, reshaping AVGO’s margin profile and deepening its enterprise moat.
🔑 Growth Catalysts:
💻 VMware Integration = High-Margin Recurring Revenue
70%+ of top 10,000 VMware customers already moved to subscription model
Transition boosts revenue visibility, margin expansion, and valuation multiples
Strong cross-sell opportunities within Broadcom’s enterprise base
⚙️ Custom AI Chips – A Key NVIDIA Hedge
Broadcom’s custom AI accelerators offer an alternative amid export curbs
Strong demand from hyperscalers and cloud players (Amazon, Google, Meta)
Positioned as a strategic silicon supplier in the AI infrastructure stack
📶 Diversification = Resilience
Deep reach across networking, broadband, storage, and wireless
Reduced cyclicality vs. pure-play semiconductor firms
Balanced between enterprise software and hardware demand
🛡️ Geopolitical Edge
Broadcom’s chip solutions provide alternatives in regions impacted by U.S.-China tech tensions
VMware’s software suite ensures relevance in multi-cloud and hybrid IT environments
📊 Financial Highlights:
Consistent double-digit free cash flow growth
EBITDA margin expansion via software scale and cost synergy post-VMware
Shareholder-friendly with strong buybacks and dividend growth
📈 Investment Outlook:
✅ Bullish Above: $165.00–$170.00
🚀 Upside Target: $270.00–$280.00
🎯 Thesis: With AI tailwinds, VMware synergies, and rising recurring revenues, Broadcom is evolving into a software+silicon powerhouse—positioned for outsized returns and resilience in volatile markets.
#Broadcom #AVGO #VMware #AIchips #Semiconductors #EnterpriseSoftware #RecurringRevenue

BROADCOM: Long term Channel Up points to $350 within 2025.AVGO is bullish on its 1D technical outlook (RSI = 64.250, MACD = 3.500, ADX = 29.483) as last week it crossed and close over its 1W MA50 and on the current 1W candle it is about to close over the 0.618 Fibonacci retracement level as well. This is similar to the November-December 2022 fractal that followed after the last major market bottom. Both sequences bottomed on the same 1W RSI level (34.80), so the structures share more similarities than differences. Since the 3 year pattern is a Channel Up, the stock is now on the new bullish wave aiming for the next HH. The 2022 rebound reached the 1.618 Fib extension before consolidating for weeks, so our long term target is the current 1.618 Fib (TP = $350.00).
## If you like our free content follow our profile to get more daily ideas. ##
## Comments and likes are greatly appreciated. ##

BROADCOM's 15 year chart is why you will regret not buying now.Broadcom Inc. (AVGO) has been on a strong correction in the past 4 months, completing so far 3 straight brutally red 1M (monthly) candles since January, having broken below its 1W MA50 (blue trend-line).
This month, it hit its 1W MA100 (green trend-line) for the first time since November 2022. This is a key Support level as it is AVGO's main Support during Bull Cycles that historically has only broken during Bear Cycles.
In fact, the stock has been trading within a 15-year Channel Up since it's IPO. And this is the reason why this correction is a blessing in disguise for long-term investors. The 1W MA100 was intact during the previous historic Bull Cycle from May 2013 to July 2018. So since we tested it now, there is a far stronger probability of it holding and extending the Bull Cycle that started on the October 2022 Low, than turning into a Bear Cycle.
Notice also how symmetric the rises have been within this Channel Up. The 2012 - 2015 rise has been +500% before the 1W MA50 was breached again. Similarly, AVGO has grown by +500% again from the October 2022 bottom to the recent All Time High, before it broke last month again below the 1W MA50.
If this is a new Low similar to August 2015, then we can expect an equally symmetric follow up rise of +178.64% in the next 2 years. This gives us a rough long-term Target of $380.
-------------------------------------------------------------------------------
** Please LIKE 👍, FOLLOW ✅, SHARE 🙌 and COMMENT ✍ if you enjoy this idea! Also share your ideas and charts in the comments section below! This is best way to keep it relevant, support us, keep the content here free and allow the idea to reach as many people as possible. **
-------------------------------------------------------------------------------
💸💸💸💸💸💸
👇 👇 👇 👇 👇 👇

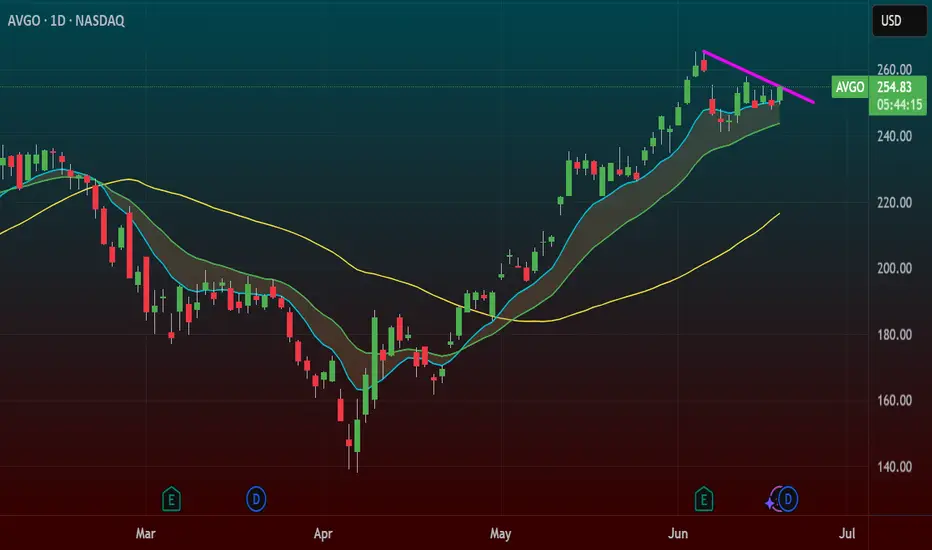
BROADCOM Megaphone bottom hit. Will it hold?Broadcom Inc. (AVGO) has been trading within a Bullish Megaphone pattern since the January 05 2024 Low and this week it hit its bottom (Higher Lows trend-line). This technically concludes the Bearish Leg and should start the new Bullish Leg.
The last Bullish Leg's initial rebound hit the 0.786 Fibonacci retracement level before pulling back again. If the market starts the new one here, which is not as easy as last time as we've already broken below the 1D MA200 (orange trend-line) last week, the immediate Target is 228.50.
-------------------------------------------------------------------------------
** Please LIKE 👍, FOLLOW ✅, SHARE 🙌 and COMMENT ✍ if you enjoy this idea! Also share your ideas and charts in the comments section below! This is best way to keep it relevant, support us, keep the content here free and allow the idea to reach as many people as possible. **
-------------------------------------------------------------------------------
💸💸💸💸💸💸
👇 👇 👇 👇 👇 👇

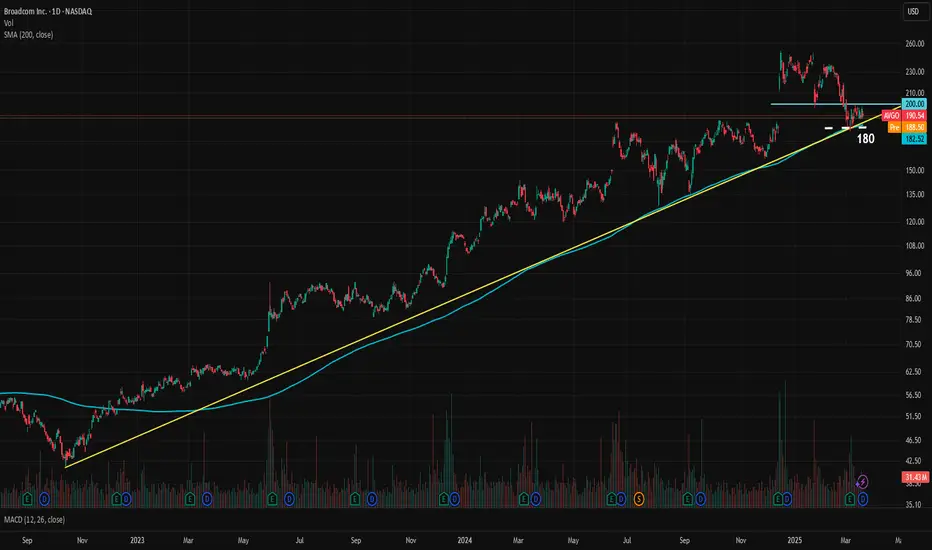
AVGO Stuck Between Key Levels, A Calm Before the Storm?Broadcom, one of the key favorites in the AI rally, is at a crossroads. AVGO has been in a steady logarithmic uptrend since October 2022, carrying the stock price from 41.51 to 251.88, marking an impressive 506% gain in about two and a half years. The company's EPS has been consistently increasing over the years and is expected to accelerate further this year. Although valuations are high, if Broadcom's performance in 2025 meets or exceeds expectations, the bullish case remains strong. The forward P/E for 2025 end is 28.7x.
Currently, the price is stuck between the trendline and the 200 resistance level. The uptrend is supported by the 200-day moving average. The trendline sits around 184, while the SMA is at 182.50. For a more cautious approach, 180 can be considered the key medium-term support level. If 180 holds and AVGO manages to break above the 200 resistance, there is significant upside potential for the bulls.
The current analyst consensus for the 12-month price target is 251, which also coincides with the stock's all-time high (ATH).
AVGO - It's time to Turnaround and GO!NASDAQ:AVGO
Monster Earnings and Move have been shrugged off...
- Ascending Triangle Successful Retest
- 50 WMA Successful Retest
- Volume Shelf
- Key S/R Zone
- Green Support Beam on Wr%
If market gets going then Broadcom is heading to $270 QUICK!
Not financial advice
BROADCOM: Is this a legit recovery on the 1D MA200?AVGO is almost neutral on its 1D technical outlook (RSI = 44.867, MACD = -8.280, ADX = 49.944) as it has stabilized following a direct contact with the 1D MA200. That was the first time the price hit that level since the September 9th 2024 low. This is also a technical HL at the bottom of the 9 month Channel Up, while also the 1D RSI is rebounding on its S1 Zone. The Sep 9th 2024 rebound hit its upper R1 level, so our worst case target is 250 (TP1), while the November 27th 2024 low rose by +59.97%, which gives a best case target of 285 (TP2).
## If you like our free content follow our profile to get more daily ideas. ##
## Comments and likes are greatly appreciated. ##

Your Stock, My Analysis – Key Levels Straight to Comments!Hey-hey
I want to give back to this amazing community! If you need a technical analysis (TA) on almost any asset, here’s all you have to do:
📌 Like this post & Follow me
📌 Comment your ticker
📌 Tell me what you want – Buying zones? Selling zones?
I’ll personally send you my TA straight to comments as soon as possible! 📩
Let’s spot the best setups together – Drop your request below! 👇
💡 Does Technical Analysis Work?
🔗 I picked 75 stocks from the S&P 500 purely based on technicals – and they outperformed the index.
Cheers,
Vaido

Broadcom Inc. (AVGO) Stock Surges Over 8%Broadcom Inc. (AVGO) Stock Surges Over 8%
As shown on the chart, Broadcom Inc. (AVGO) shares soared by more than 8% in Friday’s trading session.
The bullish momentum is driven by strong quarterly results released last week and an optimistic outlook highlighting sustained demand in the artificial intelligence sector:
→ Earnings per share: $1.60 (Analyst forecast: $1.49)
→ Revenue: $14.92 billion (Expected: $14.61 billion), reflecting a 25% increase from $11.96 billion a year earlier.
Technical Analysis of AVGO Stock
The chart indicates that the market remains in an uptrend, with signs that the price has found support at:
→ The lower boundary of the channel.
→ The former resistance zone around $183 – which also aligns with the lower boundary of the price gap that formed in December 2024, as we previously noted.
This suggests that after forming a Bullish Flag pattern (marked in red), the upward trend may continue.
Broadcom (AVGO) Stock Price Forecast
Bank of America analyst Vivek Arya called the results from Broadcom a “reassuring update from an AI leader” and a “positive read-across for AI sentiment.”
According to TipRanks:
→ The average price target for AVGO shares is $248.
→ 27 out of 30 analysts recommend buying AVGO stock.
Trade on TradingView with FXOpen. Consider opening an account and access over 700 markets with tight spreads from 0.0 pips and low commissions from $1.50 per lot.
This article represents the opinion of the Companies operating under the FXOpen brand only. It is not to be construed as an offer, solicitation, or recommendation with respect to products and services provided by the Companies operating under the FXOpen brand, nor is it to be considered financial advice.

$AVGO: Broadcom – AI Chip Powerhouse or Tariff Tightrope?(1/9)
Good morning, crew! ☀️ NASDAQ:AVGO : Broadcom – AI Chip Powerhouse or Tariff Tightrope?
With NASDAQ:AVGO at $194.94 after a Q1 earnings slam dunk, is this semiconductor star riding the AI wave to glory or teetering on trade war woes? Let’s unpack the circuits! 🔍
(2/9) – PRICE PERFORMANCE 📊
• Current Price: $ 194.94 as of Mar 10, 2025 💰
• Q1 2025: Revenue $14.92B (up 23% YoY), EPS $1.60 📏
• Movement: Up 10% post-earnings Mar 6, +8.6% Mar 7 🌟
It’s buzzing like a chip factory on overdrive! ⚡
(3/9) – MARKET POSITION 📈
• Market Cap: ~$93.5B (151.62M shares) 🏆
• Operations: AI chips, software solutions ⏰
• Trend: 42% of 2024 revenue from software, per web data 🎯
A heavyweight in the AI silicon ring! 🌐
(4/9) – KEY DEVELOPMENTS 🔑
• Earnings: Q1 beat with $14.92B, Q2 forecast tops estimates 🔄
• AI Boom: Custom chips fuel hyperscaler demand 🌍
• Sentiment: Shares rallied, per Mar 6-7 posts 📋
Thriving, wired for the future! 💡
(5/9) – RISKS IN FOCUS ⚠️
• Tariffs: Trade uncertainties loom, per web reports 🔍
• Competition: Nvidia, Marvell in the race 📉
• Valuation: Premium pricing raises eyebrows ❄️
High stakes, but risks are on the radar! 🕵️
(6/9) – SWOT: STRENGTHS 💪
• Q1 Win: $14.92B revenue, EPS $1.60 beat 🥇
• AI Edge: 77% AI revenue growth in Q1 📊
• Forecast: Q2 sales outlook shines 🔧
Powered up for the AI era! 🔋
(7/9) – SWOT: WEAKNESSES & OPPORTUNITIES ⚖️
• Weaknesses: Tariff risks, high valuation 📉
• Opportunities: 18% earnings growth projected 📈
Can it outrun trade clouds and soar? 🤔
(8/9) – 📢Broadcom at $194.94, AI chips sizzling—your vibe? 🗳️
• Bullish: $220+ by June, AI rules 🐂
• Neutral: Stable, tariffs balance ⚖️
• Bearish: $170 slide, risks bite 🐻
Drop your pick below! 👇
(9/9) – FINAL TAKEAWAY 🎯
Broadcom’s $14.92B Q1 haul screams AI strength 📈, but tariff shadows hover 🌫️. Volatility’s our sidekick—dips are DCA dynamite 💰. Snap ‘em up, ride the surge! Goldmine or gamble?

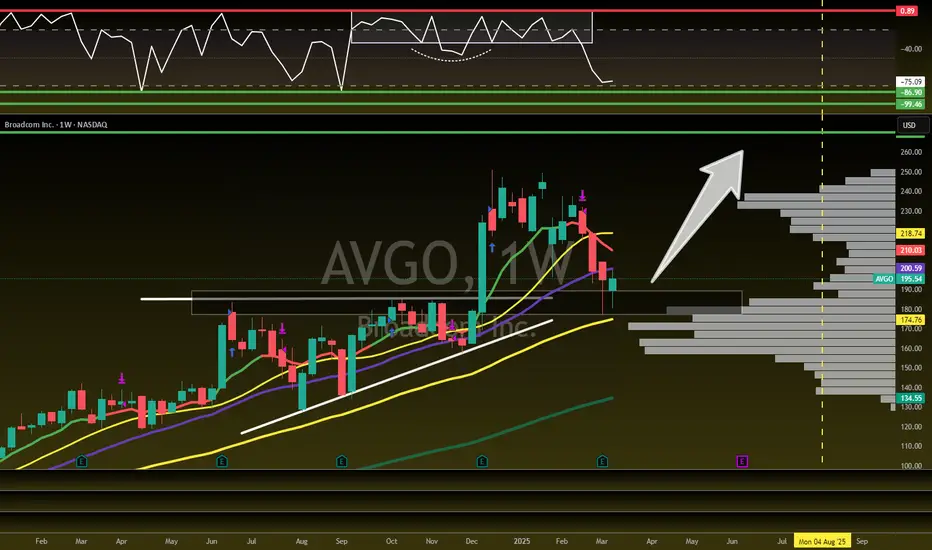
BROADCOM Is this the buy opportunity of the year?Broadcom Inc. (AVGO) has been trading within a multi-year Channel Up since the October 2022 market bottom and broke last week below its 4H MA200 (orange trend-line). In the past +2 years, every time the 4H MA200 broke, the stock was on its most optimal buy opportunity, as long as the 1W MA50 (red trend-line) held.
In fact, it has been holding since the December 09 2022 break-out so as long as it doesn't break now, AVGO is a low risk - high reward buy opportunity. Actually both in 1W RSI terms as pure price action, the current Low resembles the September 06 2024 one, which started the most recent Bullish Leg.
That sequence initially hit its previous Resistance (previous Higher High) before entering a Re-accumulation phase halfway before the Channel Up top. As a result, we expect to see AVGO hitting at least $250 before the next pull-back that quite possible may target $330.
-------------------------------------------------------------------------------
** Please LIKE 👍, FOLLOW ✅, SHARE 🙌 and COMMENT ✍ if you enjoy this idea! Also share your ideas and charts in the comments section below! This is best way to keep it relevant, support us, keep the content here free and allow the idea to reach as many people as possible. **
-------------------------------------------------------------------------------
💸💸💸💸💸💸
👇 👇 👇 👇 👇 👇

Broadcom Middle of Range RisksI like Broadcom if it gets down to $178. Right now it's still floating from the AAPL news. I wouldn't be inclined to sell here, but if looking to buy (like myself) I'd wait in hopes for $178.
Target (Potential Next Support) $302.
Good luck!

Broadcom - This Chart Is Just Splendid!Broadcom ( NASDAQ:AVGO ) is starting the rejection:
Click chart above to see the detailed analysis👆🏻
For the past decade, Broadcom has been trading in an obvious rising channel formation, perfectly rejecting the upper resistance as well as the lower support trendline. With the recent weakness, Broadcom is now preparing for a clean rejection away from the major reversal area.
Levels to watch: $250, $150
Keep your long term vision,
Philip (BasicTrading)

BROADCOM: Buy the next dip under the 1D MA50 and target $285.AVGO is neutral on its 1D technical outlook (RSI = 52.924, MACD = 2.910, ADX = 23.178) despite a recent end of January rebound on its 1D MA50. Technically the bearish wave of the Channel Up isn't completed, it should do so once the 1D RSI touches the S1 Zone again. Once it does, aim for a little under a +60% price increase (TP = 285.00).
## If you like our free content follow our profile to get more daily ideas. ##
## Comments and likes are greatly appreciated. ##

NVIDIA's Technical Outlook After the Market CrashYesterday, the market experienced a sell-off that pushed most stocks into the red. One of the key stocks in the spotlight was NVIDIA (NVDA).
From a technical perspective, NVDA had been drifting between the $130 and $150 range for the past three months without establishing a clear direction. During this time, the stock made several attempts to break above the $150 level, but all efforts failed – investors simply weren’t ready to pay such a high price.
Yesterday, the stock finally found a direction: not above $150, but instead below $130. Slightly lower price levels have now taken over.
Current Technical Outlook
At the moment, the stock is once again trapped between two levels – $130 as resistance and $100 as support. Currently, the price sits in what I’d describe as "no-man’s land," and for me, the optimal buy zone would be in the range of $90–$107.5. If the price doesn’t reach this area (pre-market is already up 5%) and instead rebounds back above $130, we can react there, in what I’d consider a safer zone. For now, it’s best to let things settle.
Opening positions at this stage might be risky; ultimately, it’s about balancing risks with your strategy. Personally, I always aim for the best possible prices or the safest scenario. For me, the lower zone between $90 and $107.5 offers the best potential value.
Second Scenario
Another approach is to wait for the price to break back above the current resistance level of $130 and secure a strong weekly close above it. This would signal that the price has moved into a potentially safer zone, suggesting that market panic may have ended well for NVDA holders. This scenario also allows us to take advantage of further potential growth.
Sector Stocks of Interest
Here are a few stocks from this sector that caught my attention and might also be of interest to you:
Broadcom (AVGO)
ASML Holding (ASML)
Marvell Technology (MRVL)
Strongest levels below the current price.
All the best,
Vaido

AVGO Bullish and bearish at the same timeAVGO had an amazing Gap up opening due to fantabulous earnings and guidance related to AI .
Looking at historic trend AVGO always fill the gap up openings by bearish moment
At this point in time AVGO is in bear trend and looking to fill the gap but we can give AVGO benefit of doubt and it seems like 212 is a very strong support as well
Entry advice
Buy at 212 or 212 when it bounces off that support
Second entry can be at 185 as that is a very strong support and will bounce off from that support level
Stop loss 155
