UBER Falling Broadening WedgeSupport/resistance lines
1. $41.95
2. $33.96
Trend lines
1. The first main trend line begin with the IPO lunch and forms the support line for the falling wedge.
2.The second main trend line begin with the initial structure high at $47.16 and forms the resistance line for the falling wedge.
Falling Broadening Wedge
We can see the Falling Broadening Wedge forming slow with the Highest point at $47.17 and the lowest point at around $15. The resistance trend line has been touched 2 times and the support trend line has been touched 3 (4) times since the form.
In the falling broadening wedges the most usual scenario is the the price consolidation when falling in that two trend lines and in some point the price to break the resistance trend line and form a breakout.
RSI
1. 5-Period Rsi
In that period i used it to define the main swings/waves of the charts.Based on oversold-overbought areas.
2. 14-Period Rsi
In that period i used to define possible divergences.
Scenario
Broadening Wedge

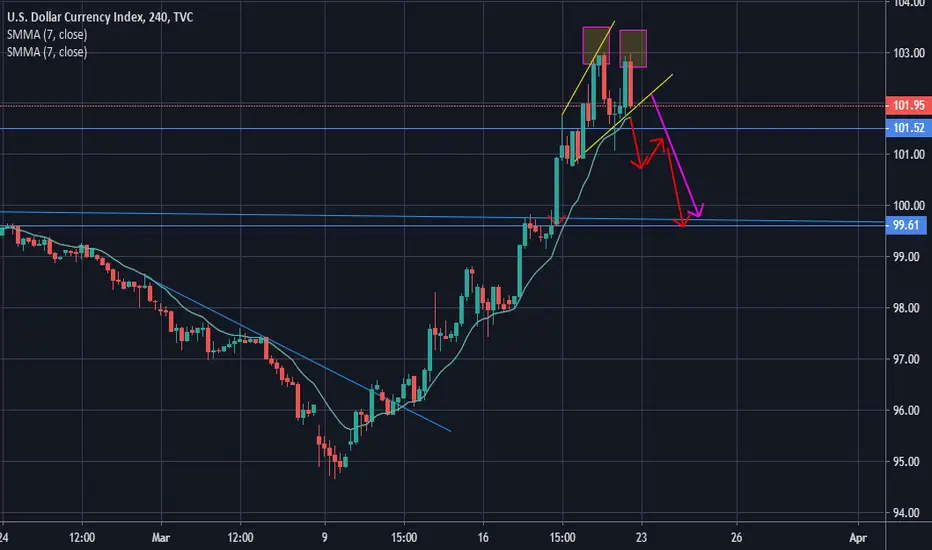
dxy making a doubletop or wedgehere we can see that it made a doubletop and if we draw two lines counting the ling wick as a fakeout then we can say its in a wedge which can take the price down. this is just an anlysis. please make sure you do your analysis before you jump in this trade
Broadening Wedge Support TestThe Dow Jones Industrial Average(DJI) closed at $19,989, down -6.3% today and fell below the $20,000 level for the first time since 2016 meaning that stocks have now given back all of the gains made in the past 4 years. The market is now down -32% from the all-time high of $29,568 made on February 12th meaning that it has taken a little over a month to wipe out four years of gains. This is a massive move and the steepest, fastest decline in market history.
Traders sold price down below the lower line of the broadening wedge, but ended up closing price above the wedge line indicating that this lower line is acting as a technical price support level as expected in previous charts highlighting this wedge pattern. The lower wick of the candle today shows that traders also sold price below $19,000 during the trading day, but ultimately enough buyers stepped in to keep price above the lower wedge line, indicated by today’s candle body being above the wedge line. There is also added support at the lower red line which stems from an historic level of interest by traders back in 2015 which was pointed out in the previous price chart shared.
The hold above these technical levels comes as the US government announced a $1.2 trillion stimulus package which includes company bailouts as well as financial support to US citizens via a $1,000 check in April and a $1,000 check in May. In my previous chart, I expected both a test of the lower wedge line and bounce due to technical traders buying this level, as well as fundamental traders buying stimulus news.
Now that we have witnessed both the technical levels being reached and the fundamental stimulus news, I’m expecting more selling as the stimulus package appears to be too small, and arriving too late, in the face of an outbreak that is still growing exponentially. Until more extreme measures are taken to control the outbreak, thus limiting the long-term affect to the economy, traders will remain fearful due to the ongoing hit to company revenue and earnings as case counts rise. The current stimulus package is enough to float markets for two months, but nothing is being done from a health perspective in order to ensure that the virus is slowed, let alone stopped, within two months. We may see a bounce tomorrow and Friday as this technical level and stimulus provide some short-term hope to traders, but the bounce will likely not last as the underlying issue is not being dealt with in a forceful enough manner. As case counts continue to rise, so will traders fear of the governments ability to contain the outbreak with just money. As I mentioned before, if the only tool the government has to fight a crisis is money, then every problem has to look like a money problem. This coronavirus is most certainly not a money problem, it is a public health problem that needs a cure or extreme containment countermeasures to combat.
The most important level to watch this week is the lower wedge line as a close below this level would be bearish/negative from a technical point of view and indicate that it is no longer a support level. Traders may also flip back to being fearful that the government’s stimulus is not enough to prevent further hits to the economy.
Overall view remains neutral with the expectation of a short-term bounce due to technical support levels being reached and fundamental support via massive Federal Reserve and government bailouts. View will switch back to bearish if lower support levels are breached which is expected as US coronavirus case counts rise.

Dow Jones Broadening Wedge Test(Lower)The Dow Jones saw another massive decline today, down -13% and nearly $3,000 in a single session making this the new record one-day point decline in history for the Dow and smashing the previous record of -$2,000 which was made last week. High volatility has been expected over the past two weeks and we are getting it in extraordinary fashion as traders appear to be experiencing emotionally-driven panic selling on top of the unknown in company and economic fundamentals which is causing selling as well. It is yet to be known how long this coronavirus is going to be affecting the economy as more states and businesses are forced into lockdown. Without knowing what impact this will have on revenue and earnings going forward, it makes sense to sell from a fundamental point of view, but the speed and rate of decline appear to be mostly emotional selling.
In the panic selloff seen today there may be a glimmer of hope from a technical perspective. Traders have now sold price down nearly -32% from the all-time high and are now testing the lower line of the broadening wedge pattern. We have yet to see a significant bounce during the decline other than the last minute bid witnessed as President Trump made the state of emergency declaration on Friday afternoon going into the market close. We saw a +10% gain mostly made in the last 15 minutes of trading on Friday which indicates that there is an appetite to buy the dip from traders, but the weekend news cycle put them back in fear mode by the time markets re-opened today. Such a strong fear mode that not even the Federal Reserve’s second emergency interest rate cut within a week-which took the Federal Funds rate down to 0%-nor the announcement of a return to Quantitative Easing could ease.
Markets are beginning to look very oversold in the short-term and I’m thinking we could see a technical bounce off of the lower wedge line if enough technical traders are still around and watching the charts. Along with the lower wedge line, there is also the horizontal support/resistance line stemming from the 2015 price peak which was created when the Federal Reserve announced monetary tightening by raising interest rates back then. Traders became fearful as rates went up as they feared it would slow economic growth, but ultimately began buying again as forward guidance from the Fed eased their fears. This red trendline is also another technical level where traders could be tempted to buy due the severe oversold conditions we are seeing, and due the fact that previous resistance levels normally turn into support in technical analysis.
Treasury Secretary Steven Mnunchin has also been working at a fast pace to provide some fiscal stimulus to the economy which is what traders mostly want to see aside from just Federal Reserve intervention in the banking sector. Fiscal stimulus would add much needed relief to not only struggling companies, but also to the American consumers via deferred tax payments for companies as well as a complete payroll tax suspension for employers through the rest of the year.
The expected fiscal stimulus amount is $800 billion, but Mnunchin and other economic officials could surprise markets with an even larger amount in economic relief which wouldn’t be too surprising considering that we’ve recently seen the Federal Reserve surprise markets with two emergency interest rate cuts within a week as well last weeks surprise announcement of $1.5 trillion in REPO.
If we get a combination of a price test of the lower wedge line along with more solid details of the economic relief package being pushed through the House this week it would give both technical and fundamental traders cause to buy at the same time which more than likely would lead to a record-breaking move to the upside. Whether or not that potential bounce would hold would largely depend on the coronavirus though. That is still the major unknown in markets right now and if case and death rates in the US continue higher and lead to more states shutting down, or potentially the entire country, traders could quickly return to selling.
For now the overall price trend remains down, but a bounce tomorrow or Wednesday is expected due to technical levels of support being reached and the expectation of a large amount of fiscal stimulus to be announced by Thursday.
Current view has now changed from bearish to neutral due to oversold conditions along with the technical levels reached and expected fiscal stimulus

GBPUSD - Repeat StoryIt seems I made a lot of mistakes in the previous ideas about this pair. Previously I saw a pattern formed as a flag, but apparently after I looked back, the result was a Descending Triangle. I once made a post about what the pair's movements might look like in my first idea, you can see it in the related link below with the title " GBPUSD - A Little Story ". Which of that idea I predicted about the possibility of forming an Inverted Head & Shoulders pattern and the existence of a Broadening Wedge pattern.
Yahhh !! this is how humans are, always making mistakes. Maybe even this later could be wrong again.
But, we should really have to learn from mistakes to be better. Is it not like that?
So, let's multiply make mistakes, but don't be intentional.
Hopefully this not completely wrong, otherwise I only make garbage analysis.

AUDNZD Updated Analysis!Previously I already wrote a little about this pair. You can see it in the related link below. Until now there have been no signs of reversal.
The existing pattern forms a broadening bottom, a pattern of continuing trend. The key point lies in the support line, if the line is broken then it has the potential to test the next support. But if it fails, and shows signs of reversal, the next move has the potential to be form higher-high in the broadening pattern.
Examples of reversal signs: Bullish Engulfing, Pinbar with long lower tail, Hammer etc .

SP500 long term target 2300 then 1650We will have a dead cat bounce up to ~3200 to activate a butterfly target at 2300. Right on previous major LOW. We need AT LEAST 3200 for this to work.
Then another dead cat, and a fall to 1650, to complete a shark pattern.
Once we reach 1650, market could range between 1650 and 2500 for years.
It's blowing my mind how the 161% extensions (golden number) are aligned with key levels.
At 3400, 2300 and 1650.

Bullish consolidation pattern - needs confirmation!Apart from all the FUD these days in the crypto space on the daily timeframe the forming chart pattern could be identified as a broadening wedge pattern which is more likely to be resolved to the upside in this case.
This demands of course that the current low is the final low in this pattern and therefor the 200 day SMA holds the price action (currently it looks like it does).
So in the next days/week we could see a rebound at least to the upper line marking this broadening wedge.
If the touch of the upper line of this wedge is happening BUT the BTC price doesn't manage to break out of this pattern we are more likely to make a next lower low before breaking out of this chart pattern.

March-May macro outlook XBTUSDAfter that hard rejection recently making a lower high I believe we will re-test the broadening wedge breakout (88xx) and that will be a hard buy for a swing/position play. My plan is to ladder in from 90xx-87xx with equal weights. This area is also the golden ratio from the whole move, which is historically a great place to buy in uptrends. Will update with stops thinking I'll place it around 7-12% from entry.

Silver braking out As mentioned on previous study we are completing that reverse head and shoulders bottom ,
The top of the shoulders along with the neckline form a right angled broadening wedge that we are trying to break out at the moment
If price accepts these levels I am expecting that measure move marked on chart to take place,
If not then a consolidation back to the trend line at 17.8 - 17.9 before we retest and finally break to the upside is likely to happen as it 's a common pattern on right angled broadening wedges like the one we are trying to break out from
They are plenty of bullish signals on Silver on the 1H, 4H , Daily and weekly time frames , nothing can be certain when dealing with markets but signals are strongly in favor with the bulls right now.

BitcoinSymmetrical Triangle, Falling Wedge, Broadening Triangle, Fibonacci levels-
Disclaimer:
We are not registered or licensed in any jurisdiction whatsoever to provide investing advice or anything of an advisory or consultancy nature,
and are therefore are unqualified to give investment recommendations.
Always do your own research and consult with a licensed investment professional before investing.
This communication is never to be used as the basis of making investment decisions, and it is for entertainment purposes only.

XRP SEASON HAS BEGUNReasons:
-xrp broke out of broadening wedge pattern
-xrp broke out of falling wedge patter (check link idea)
-xrp broke heavy resistance
-no weekly resistance until target of around 45c
- xrpbtc chart bullish
- high highs are now in for extra demand
This is not financial advice, please do your own research before opening a position
HEY EVERYONE! If you enjoyed the idea, please give me a like and a follow.
Thanks for your support :)

XRP BREAKING OUT Reasons:
-Xrp has broken out of a broadening wedge pattern
-if it breaks 32c, there is no critical resistance until around 45c
- strong uptrend following other altcoins
- bullish xrpbtc pair (btc also being bullish
- signs of alt season happening
This is not financial advice, please dyor before opening a position
HEY EVERYONE! If you enjoyed the idea please give it a like, thanks for your support :)

Celsius will probably have a retracement towards $5I am generally long on this stock. However, we are seeing an upward tilted broadening wedge pattern form on CELSIUS HOLDINGS INC. The bottom of the wedge is broken and so it is likely that price will eventually return to the low point of the formation.

Ethereum gaining altcoin dominance?Hello All,
So far, as we have seen this current market, Ethereum--previously a strong performer-- has been under performing, however, it has a strong pattern here with the chance of a classic failure swing, as the second bottom could not approach the original bottom as closely. This failure swing is denoted by the yellow strokes on the chart.
There is a broadening wedge which I have been following for several months, and so far, following this pattern has been very fruitful. But, now the price action appears to be consolidating just above an important support and one of the strongest resistance trendlines for Ethereum since the move to 360. The price objective of this broadening wedge is approximately 250 which would place ETH just above a strong resistance region. We are looking for strong movements above the resistance trendline which is in magenta or purple, after there maybe a retest of the breakout, otherwise, I believe price will power through to close to 250 with very little consolidation opportunities.
Currently, there is a small flag just under the resistance, and 179 is a strong support region; there is an extremely low probability for ETH to fail this breakout, and if it does, there is a great opportunity for good risk management.
Also, giving me a like and a follow will help motivate me to post more!
Best of luck and Stay Technical!
Previous Analysis:

XAUUSD GOLD SHORT I believe that the next gold move will be toward 1535-1515 before we see a buy opportunity on gold

Tron TRX update. Trade as you see fit. Broadening Wedge?Hi all,
A quick update on TRXBTC. I see this playing out, really good for quick scalp trades, which I will be doing. I do have longs open from a previous post a while back, that caught trx in the buy in range perfectly.
Also, just had a test on the falling wedge, though I would have liked to see more buy volume since this was practically non existant. Furthermore, use larger timeframes and plot key trend lines, volume and basic TA.
Im not here to say when to long, short or how much leverage to use. If you're on here, you should know.
Trade safe, and always keep an eye on BTC.
A small fish in the ocean is all I need
The Gatekeeper

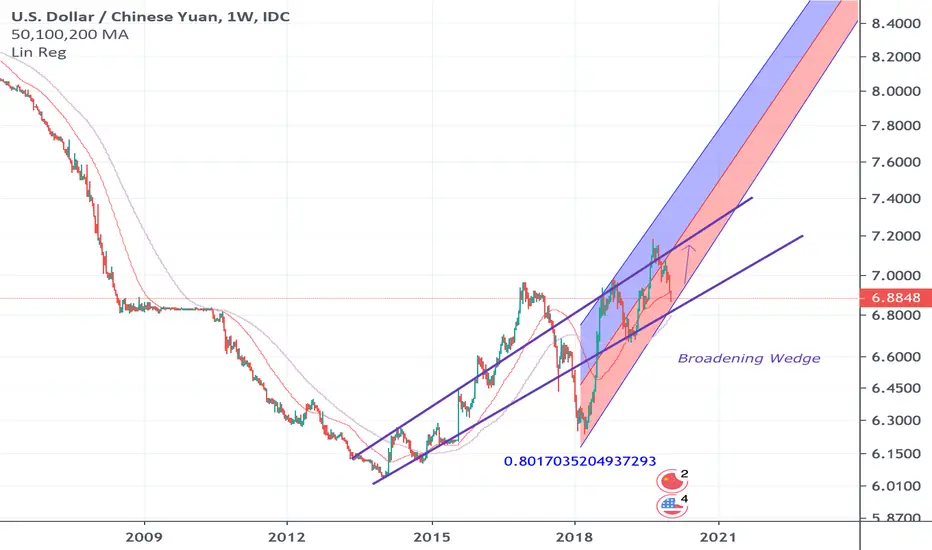
USDCNY Broadening WedgeA broadening wedge has formed on USDCNY. This may lead to a breakdown, however the short term outlook is quite bullish. With a 0.80 Regression uptrend.
MUST SEE!!! 4 BULLISH Patterns at the Same Time!!!Hi friends, please smash the Like button! This is an update to my last BTC post on December 22 of my early prediction of an Inverse Head and Shoulder forming, long before it became the pattern everyone is charting and making YouTube videos of today.
Needless to say, the right shoulder has formed! Not only that, but we also now have an ascending triangle, and a broadening wedge. All of this inside a descending channel! That is four bullish patterns at one time:
Inverse Head & Shoulders
Ascending Triangle
Broadening Wedge
Descending Channel
We still need confirmation with successful breakouts of resistance lines, but, based on these bullish patterns nearing their confirmation lines, I am long, with a current target at $8500.
Thank you!
*** I AM NOT A FINANCIAL ADVISER. THIS IS NOT FINANCIAL ADVICE. FOR ALL YOU KNOW, I COULD BE A MANIAC IN A PUBLIC LIBRARY MAKING CRAZY TALK! AS ALWAYS, DO NOT BLINDLY FOLLOW PEOPLE. AND, ALWAYS, DO. YOUR. OWN. RESEARCH.***

BURL, Burlington Stores Inc. - Stop Loss on Broadening TriangleNYSE:BURL
It is never a question of being right or wrong, but rather of being too early and being thrown out of the market before the asset's actual direction.
What we need is an event that allows us to systematically decide to enter Long or Short, in our case the patterns of technical analysis.
We are trend-followers and we gain from price movement, so we could call ourselves "Price Change Traders".
In this case the price had triggered our Stop Loss.
Stay Tuned!


LENDBTC Fib ExtensionBroadening wedge, large possible returns if the wedge holds for a while, risky trade. However in this market risk often = reward. Horns are present on the 45min chart which may be a sign of a bearish move to come.

LINKBTC Broadening WedgeLINKBTC has formed a broadening wedge, a breakdown of this formation would turn the coin quite bearish. MA’s can be seen to be ‘death crossing’ currently on the daily chart below the gaussian channel.
