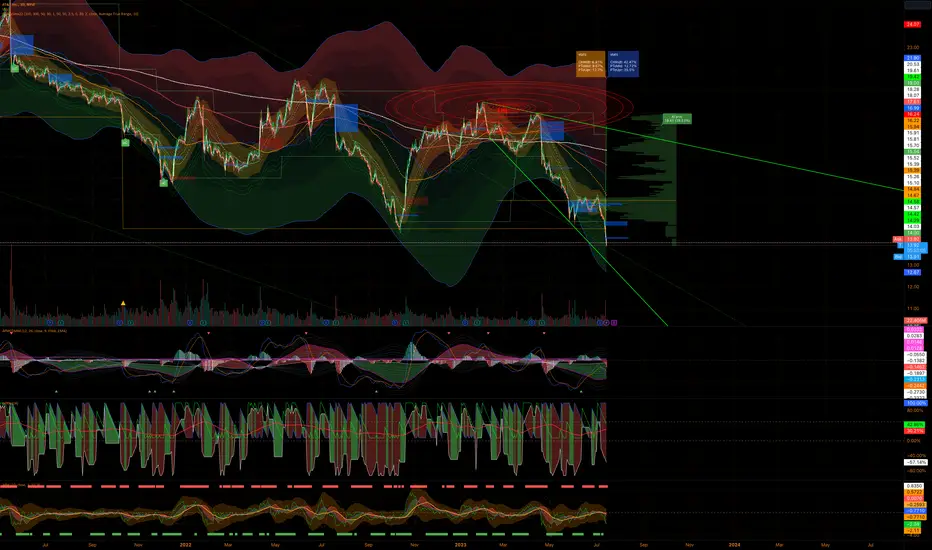
BTC - Broadening Wedge / Bull Pennant#BTC
One of the most deceptive patterns is the broadening wedge, which was an iteration of a bull pennant last time.
Will history rhyme again...?
Broadening Wedge

DXY is hitting resistance of massive broadening wedge. Big moveThe INDEX:DXY is hitting resistance of massive broadening wedge. Big move up or down coming.
If it closes above the wedge line, look for it to climb higher.
If it can't break through, look for it to retest the bottom of the wedge.
If it starts to fall, stocks and Bitcoin will rally.
INDEX:DXY COINBASE:BTCUSD NASDAQ:QQQ

ETH - Perfect Broadening Wedge 5 Count w/Beautiful Volume#Ethereum
A prefect textbook Wyckoff Reaccumulation Broadening Wedge, with volume in all the right places

#ETHBTC - #Wyckoff & #Volume & #Divergences & #Sentiment#ETHBTC
The Broadening Wedge has a track record of being one of the most brutal patterns for emotional Traders to navigate, but if we peel back the layers to see what's happening of actual importance, that's when things start to get really interesting, IMO.
This is very possibly a textbook Wyckoff bottom. It's presenting all the signs of what we want to see plus #ETHBTC has a history of combining extremely low sentiment with ruthless patterns.
But once again just focus beyond the noise of PA and we can see what is volume or lack thereof in all the right places, paired with stacked divergences.
Nothing is 100% certain in this place, but based on probabilities gauged over history and the rest of the story, I know what I'm doing...

Will it prove to be a broadening wedge? Time will tellHello!
All the info is already in the chart. Time range: 1-2 years.
Good luck!
Sisif

I'll Go To The Moon (ALGOUSDT)ALGO has been trading in an ascending broadening wedge pattern since 19th October.
In that time it has risen by ~67% and is once again trading above all EMA's. The market is shaky at the moment and any drops in BTC are causing bigger drops in alts, but any increase in BTC is not necessarily increasing alts much.
In any case, despite the very recent downward pressure ALGO found support around $0.13 and is looking to push up to the top of the channel for a short-term 20% increase. In the mid-term, if a breakout of the channel occurs we can target the $0.20 range.
If there is any major downward pressure, ALGO could fall considerably to $0.10, but that seems unlikely for now.
It has been a while since ALGO has shown some strength, now that it has the explosion should be big.
Please note I am not a financial advisor and this is not financial advice. All ideas are for educational purposes only.
Please feel free to leave your comments and thoughts below!

🚧DOT is bullish now🚧 & many Traders don't see it 👀!!!As you can see, the price is in a Broadening wedge. If the price can break this wedge, we can hope that the price will act like a butterfly pattern and the price will grow well.
_ _ _ _ _ _ _ _ _ _ _ _ _ _ _ _ _ _ _ _ _ _ _ _ _ _ _ _ _ _ _ _ _
✅Thank you, and for more ideas, hit ❤️Like❤️ and 🌟Follow🌟!

Broadening Wedge Pattern breakout in INDIGOINTERGLOBE AVIATION LTD
Key highlights: 💡⚡
✅On 1Hour Time Frame Stock Showing Breakout of Broadening Wedge Pattern.
✅ Strong Bullish Candlestick Form on this timeframe.
✅It can give movement up to the Breakout target of 2475+.
✅Can Go Long in this stock by placing a stop loss below 2380-.

BTC/USDHere is a closer look at the BTC/USD 1 day chart:
At the moment of typing this BTC/USD is ranging sideways within the range of around $31,479 and around $29,627 as highlighted by the Horizontal Dotted White Lines with Yellow Shading.
BTC/USD is in a Ichimoku Y-Wave Pattern otherwise known as a Broadening Wedge Pattern or a Megaphone Pattern on this 1 day timeframe.
We have contraction of the Bollinger Bands Upper and Lower Bands. Note that at the moment of typing this BTC has found support from its Middle Band Basis 20 Period SMA.
I have added 2 Fixed Range Volume Profiles (FRVP).
The 1st VFVP starts at the impulse from Thursday 15th June until Thursday 22nd June. Note that BTC is well above this FRVP POC (Point of Control).
The 2nd is at the start of the Ranging Sideways Movement from Friday 23rd June until Friday 7th June. Note that BTC is below this FRVP POC (Point of Control).
I have added a Fib Retracement Tool from the low at the start of the Impulse to the recent high. As you can see BTC/USD has found some support from its 0.236 / 23.60% Fib level.
I have also added a Trend-Based Fib Extension Tool so you can see the various Support and Resistance lines for this tool with the high/low range i have selected.
BTC/USD is still below its Least Squares Moving Average (LSMA) indicator. Note that the Price has not closed above the LSMA since Thursday 29th June.
Looking at the Moving Average Convergence Divergence (MACD) we can see that the MACD Line had crossed below its Signal Line on Thursday 6th July but both lines are still in the Positive Zone above the 0.00 Base Line.
All in all it’s interesting times, at the moment of typing this BTC/USD momentum is moving within a Range:
For the positive side:
An impulse move upwards with strong bullish volume with a successful daily candle CLOSE above $31,479 and successful re-test as strong SUPPORT is key for a bullish outlook.
For the negative side:
An impulse move downwards with strong bearish volume with a successful daily candle CLOSE below $29,627 and successful re-test as strong RESISTANCE is key for a bearish outlook.
I hope this quick BTC/USD post is helpful.

Descending broadening wedge GME 1 HRLooking at a textbook descending broadening wedge on the 1hr for GME, a breakout of this wedge could bring an easy 5 to 10% gap up.

BNBUSDT up-to-date expanding endingJust updating that 30m chart, in which price action (micro triangle break) seems to be igniting the terminal leg downward v of the impulse wave 3 inner a right-angled structure, likely an expanding ending diagonal. Plus hidden divergence on Chaikin Money Flow.

I Cannot Long This !!! situation+next targets.The price is in the B wedge in time frame one hour. The price can fall to the bottom of the
B wedge and then slowly move up to the Top of the B wedge.
✅Thank you, and for more ideas, hit ❤️Like❤️ and 🌟Follow🌟!

Vuvuzela Pattern for the JSE ALSI 40 target to blow up to 75000 Well, well, well, we've identified the tumultuous and monotonous pattern on the chart finally.
It's known as a Broadening Triangle or what I call a Vuvuzela Formation.
The price diverges instead of converges in a triangle pattern...
Now this can be a continuation or a reversal pattern. It all depends on the breakout.
Looking at the D&S and liquidity it looks like the JSE really wants to break above the formation and head to new highs of the year.
75,000 is a decent first target...
Also with Smart Money Concepts we can see there is a Sell Side Liquidity Order Block showing how Smart Money is sweeping selling and buying into it, hence there isn't a major push down in price just yet...
I'm bullish with this Vuvuzela. Now we need the JSE to blow up.

$T -4%, are you serious?This is another case of hidden value by a downgrade.
Nothing we do today could be possible without this company; communication is the foundation of everything nowadays.
But technically we have a broadening falling wedge, the resistance is just 32% from this price.
Maybe the key day will be the earnings call, but the opportunity is there!
GL!
BTCUSDT can ascend further!➡️falling wedge pattern it means that the price would increase and the price has already broken the pattern and Pullback is complete it. means price can rice to top of channel.
🌟 Bullish signals in the PRZ area are:
- Dynamic Support
-Broadening Wedge
⭐ Note if the Dynamic Support is broken downwards with the strength of Bearish candles from the bottom , this analysis of ours will be failed.
✅Thank you, and for more ideas, hit ❤️Like❤️ and 🌟Follow🌟!

BNBUSDT Right-angled descending broadening wedgeBNBUSDT up-to-date.
222 USDT is on the table for this asset. CZ coin is about to drop to fil the most profitable leg downward to draw this beautiful pattern on an increase of confidence by the bear side, aiming the great demand for the bottom zone.

The Bullish Case for Bitcoin! A Comprehensive Analysis!!!Chart is speaking it self!!!
🌟The Bitcoin is in a Bullish phase by ⤵️⤵️
➡️the BTCUSD has finished It's first five waves of Elliot wave principle movement (12345 Impulse wave) and also (ABC) wave. The possibility of starting a impulse 5th waves!!!
➡️falling wedge pattern it means that the price would increase and the price has already broken the pattern!
➡️the price now is making a pullback to the bottom of the descending triangle (which is shown in the picture) if the price breaks that important level we shall see a lot of increase in the price!
➡️A inverse head and shoulders pattern means a great bullish trend on the horizon (AB=CD).
➡️also Broadening Wedge it is another bullish sign.
🌟 Bullish signals are:
-Head&Shoulder.
-Broadening Wedge.
- falling Wegde.
-This is Longterm Analysis!!!
✅Thank you, and for more ideas, hit ❤️Like❤️ and 🌟Follow🌟!
⏮️Previous Analysis:

BNBUSDT right-angled broadening wedgeBNBUSDT is about to fill the corrective a-b-c retrace. After the last target reached, I'm updating this chart with potential targets based on demand zone for the next short position. An impulse wave downward can be expected. Fisher Transform oscillator on 4h-time-frame was added to speculate a price-time correlation.

PERLUSDT Impulse wave reactionPERLUSDT is igniting an impulse wave in reaction as the price bounce inner a broadening structure, in a micro triangle breakout. Fisher Transform bullish crossing is suggesting the direction in time correlation. Aiming 5% upward wave-iii.

$MCD is consolidating and ready to breakAfter two falling broadening wedges, Mc Donalds is ready to break the highest price, is consolidating in this area, with potential upside of 8% in the near time.

Bitcoin on Still in Bearish Pattern Bitcoin Daily Chart #TA
As per daily basis chart analysis, BTC still moving into Ascending Broadening Wedge Pattern and it is always works on #Bearish Pattern, Mean's soon Bitcoin will be under Lower-Low #BearishZone.
And, as per #FIBretracement, it also displays that its Higher-High mark is completed but its Lower-Low still remains.
Always #DYOR before investing.

APTV - Finding Its SupportAPTV is currently looking for a support line which it is very close to!
The support line is highlighted in solid green
I have also drawn a few patterns two falling wedges and one falling broadening wedge, or falling megaphone
Bullish once price starts to bounce off the trend line.

BTC ---> a broadening wedge patternhello guys...
btc formed a broadening formation.
what do you think?
it is going to break up or it wanna retrace to two green areas?!
____________________________
always do your research.
If you have any questions, you can write them in the comments below, and I will answer them.
And please don't forget to support this idea with your likes and comment
