Live buying signal in Nifty 24275Live Khareedo (Buying) signal in Nifty at 24275, lets see how long it will go up.
Note: This is not a buy/sell trade call. trade at your own will and analysis. Use stop loss.
BSE

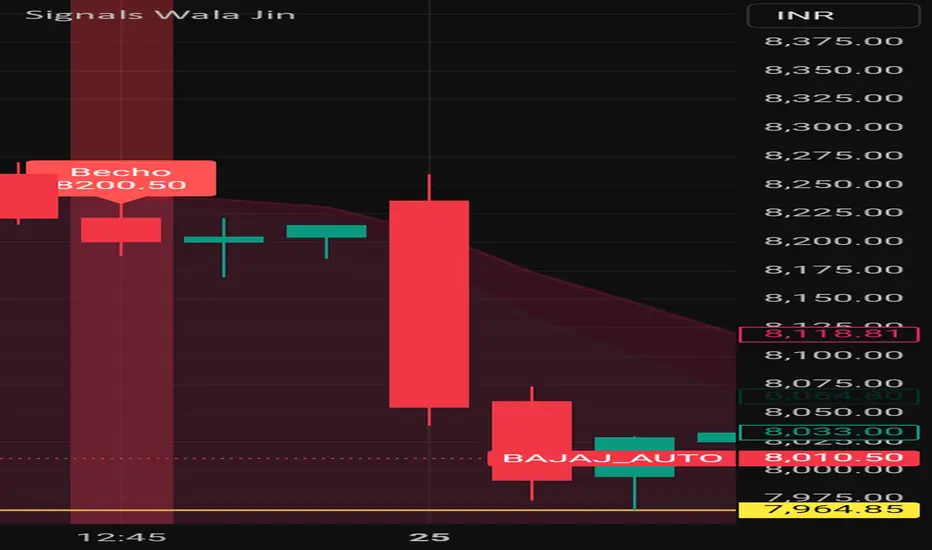
235 rupees dropped #BajajAuto share after signal 235 points dropped #BajajAuto share after generation of Signal "Becho" means sell by my custom designed indicator named SignalsWalaJin
Note: This is not a buy sell trade call. Trade at your own will. Use stop loss too.
113 rupe dropped Adanient after signal 113 rupees dropped #Adanient share after generation of Signal "Becho" means sell by my custom designed indicator named SignalsWalaJin
Note: This is not a buy sell trade call. Trade at your own will. Use stop loss too.

153 points dropped #Tac after SignalsWalaJin signal153 points dropped #Tac share after generation of Signal "Becho" means sell by my custom designed indicator named SignalsWalaJin
Note: This is not a buy sell trade call. Trade at your own will. Use stop loss too.

63 points dropped #AxisBank after #SignalsWalaJin signal63 points dropped #Axisbank share after generation of Signal "Becho" means sell by my custom designed indicator named SignalsWalaJin
Note: This is not a buy sell trade call. Trade at your own will. Use stop loss too.

Dixon in bearish zoneJadugar and Paka Kam generated signals Becho @ 16217 means sell at 16217, lets see how much it will fall.

BSE - BSE Ltd. (45 mins. chart, NSE) - Long Position; short-termBSE - BSE Ltd. (45 mins. chart, NSE) - Long Position; short-term research idea.
Risk assessment: High {volatility risk}
Risk/Reward ratio ~ 3
Current Market Price (CMP) ~ 6480
Entry limit ~ 6370 to 6430 (Avg. - 6400) on April 23, 2025
1. Target limit ~ 6500 (+1.56%; +100 points)
2. Target limit ~ 6700 (+4.69%; +300 points)
Stop order limit ~ 6300 (-1.56%; -100 points)
Disclaimer: Investments in securities markets are subject to market risks. All information presented in this group is strictly for reference and personal study purposes only and is not a recommendation and/or a solicitation to act upon under any interpretation of the letter.
LEGEND:
{curly brackets} = observation notes
= important updates
(parentheses) = information details
~ tilde/approximation = variable value
-hyphen = fixed value

IndusIndBk is in bearish zoneIndusIndBk is into bearish zone, my custom indicator generated sell "Becho" signal at 824.05 and it was dropped till 805 and rise again. Lets see how much it will drop.
Note: This is not a buy/sell call, Use stop loss too.

Divislab is in bullish zoneMy custom indicators named Jadugar and Paka Kam generated signal at 6070 Becho means to sell at 6070 and it started falling from that level. Lets see how much it will fall.
Note: This is not a buy/sell call, trade at your own will. use stop loss too.

TataMotors is in bullish zoneMy custom indicators named Jadugar and Paka Kam generated signals in last 1H candle that Becho @ 658.4 means sell at this price, lets see how much it will drop.
Note: This is not a buy/sell trade call, this is education purpose post, trade at your own will, Use stop loss.

Reliance is into bullish zoneMy custom designed indicator names Jin ka Bacha generated signal at price level of 1291 "Khareedo" means to buy, I noticed late and posting now about it, It go to 1325 after signal generated,
Note: This is not a buy/sell call, trade at your own will and use stop loss.

SBIN is crossed breakout level of 800.46SBIN is crossed breakout level and closed above it, It is a positive sign. Key levels are 800, 824, 857 and 912.
Note: This is not a buy/sell trade call. Use stop loss too.

Reliance is near to breakout 1346 levelAfter long time reliance is near to breakout level to enter is bullish zone. Breakout level is 1346 and key levels are 1358, 1416, 1489 and 1606.
Note: This is not a buy/sell trade call. Trade at your own will and use stop loss.

Axis Bank left bearish zoneAxis bank just left bearish zone and entered bullish zone.
Note. This is not a buy sell trade call.

#TvsMotors is above breakout level (2499)#Tvc Motors is closed above breakout level of 2499 and it is expected that it may cross 2600 and 2700 level
Note: this is not a buy sell trade call. Use stop loss too.

Nifty outlooks for next week and overall draw on liquidityExpecting all out bullishness on Nifty 50 Index. 25500+

Nifty Yearly Lows in Place. Time for recovery towards 25000Massive meltdown towards the sellside. Time for all out displacement towards the internal buyside. I feel the yearly lows are in place. Best time to invest for SIP and mutual funds

stock for swing KRN Heat Exchanger and Refrigeration Ltd
TF-1DAY
The stock was in a consolidation phase and now it has broken the upper side level.if this candle sustains the 880 level then make plan for entry
STOPLOSS-820
TARGET-940-980-1000++
KRN Heat Exchanger and Refrigeration (KHERL), manufactures fin and tube-type heat exchangers for the Heat Ventilation Air Conditioning, and Refrigeration Industry.

BSE +13% upside potentialSharing with you a breakout stock before the weekend, BSE today breakout its previos High 10 to 15% upside potential. holding period 1-2 week.

Caplin Point 25% upside potentialhey, here it is my weekend analysis, my weekend pick is caplin point, this stock recently break its 84 days consolidation phase and now it gives around 20 to 25% in a month.

NIFTY : Critical Support Retested – Bank Nifty Adds Pressure !Title: 📊 NSE:NIFTY (₹23,644.90): Critical Support Retested – Bank Nifty Weakness Adds Pressure!
🔍 Market Overview:
Current Price: ₹23,644.90
Key Observation: NSE:NIFTY is hovering near the crucial support of ₹23,540 (previously held on Dec 20).
Breakdown Risk: If ₹23,540 fails to hold, expect a slide toward ₹23,300 and possibly ₹23,150.
Market Sentiment: The market remains in an oversold zone, signaling a potential technical bounce, but weakness dominates.
🛑 Impact of Bank Nifty Weakness:
NSE:BANKNIFTY Trend: Also showing signs of weakness, which adds downward pressure on Nifty50.
Key Correlation: Financials have a significant weight in Nifty50; Bank Nifty's weakness could accelerate Nifty's downside move.
📊 Support & Resistance Levels:
Support: ₹23,540 → ₹23,300 → ₹23,150
Resistance: ₹23,750 → ₹23,880 → ₹24,000
📈 Fibonacci Insights:
The Fibonacci retracement highlights ₹23,540 as a make-or-break level.
A bounce from here could see Nifty testing ₹23,750 as the first resistance level.
⚖️ Strategy:
For Traders:
Below ₹23,540 → Short with a target of ₹23,300, keeping a strict stop-loss near ₹23,750.
Above ₹23,750 → Look for intraday longs targeting ₹23,880–₹24,000.
For Investors:
Use dips around ₹23,300–₹23,150 to accumulate quality stocks for long-term investment.
⚠️ Key Risks:
Continued selling pressure in Bank Nifty can trigger sharper declines in Nifty50.
Global cues and FII activity remain critical for near-term direction.
Disclaimer: I am not a SEBI-registered advisor. This analysis is purely for informational and educational purposes. Please consult a SEBI-registered financial advisor before making trading or investment decisions.

CDSL cmp on major resistance ( breakout possible)cdsl cmp 1621
closing above trendline will be a good sigh for 1811 targets
rsi divergence
i m holding my trades in cdsl so my view is biased
note: just a educational view.

SBI Life Insurance Co. Ltd (NSE: SBILIFE) - Technical Analysis Price Action and Fibonacci Analysis
SBI Life is currently trading at ₹1,628.85, which is near a crucial Fibonacci retracement level:
1. Fibonacci Levels:
The price previously peaked around ₹1,935.10, forming a possible double-top pattern.
It has since retraced, approaching the 50% retracement level at ₹1,624.75, a significant support zone. This level often acts as a key point for potential rebounds.
Below this, the 61.8% level at ₹1,551.50 is the next major support. If the price declines further, this level could provide strong support.
2. Volume Profile:
The Volume Profile on the right suggests a high volume node around ₹1,450, indicating strong accumulation in this zone. This level, if reached, could serve as a significant support area and potential bounce point.
3 . Moving Averages:
The stock is currently trading near the 200-day moving average (black line), which may act as a long-term support level.
The 50-day (blue) and 100-day (red) moving averages are above the current price, indicating that the stock has broken below its short- and medium-term trend lines.
Technical Indicators
1. Relative Strength Index (RSI):
The RSI is showing signs of being in the lower half of its range but hasn’t reached oversold territory, suggesting there may be further downside before a potential rebound.
2. Volume Trends:
There has been a significant increase in volume during the recent pullback, indicating strong selling pressure.
Conclusion and Potential Scenarios
Bullish Scenario: If the stock holds the 50% Fibonacci level at ₹1,624.75 and the 200-day moving average, we could see a recovery toward the 38.2% level at ₹1,698.00, with further resistance at ₹1,788.60.
Bearish Scenario: A break below ₹1,624.75 could lead the price toward the 61.8% level at ₹1,551.50. A further decline might see the price test the high-volume node around ₹1,450.
Trading Strategy
For Long Positions: Watch for a bounce near ₹1,624.75 or ₹1,551.50 with confirmation from volume and RSI improving from lower levels.
For Short Positions: A breakdown below ₹1,624.75, particularly with strong volume, could present a shorting opportunity down to ₹1,551.50 or potentially lower.
Note: Always consider market conditions and use proper risk management techniques.
