Birla Corp ready for breakout?Stock is at a critical level, will it breakout or breakdown like it has in previous years at this level? Keep your eyes on the charts and follow me on tradingview/twitter to find out!
BSE


LONG OPPORTUNITY IN MARUTI SUZUKIStrictly for educational purposes
I will buy only after a green sight at the entry area or stop raid for the best results!
Good Luck 🤞


Short sell opportunity in HDFC BANKDistribution phase expected
Kindly trade at your own risk.
Good Luck 🤞

Short sell opportunity in ICICI BankCheck out weekly chart ^^
Kindly trade at your own risk.
Good Luck ^_^

bse sensexthis is a clear view on BSE. at this moment we don't see any shorting opportunity. its going up and more my next target area is 50776.if reach this level. then next we see the price action on this particular area. next is next see you later. stay with me

LONG OPPORTUNITY IN ICICI BANKInstitutional order block likely to be there.
Small stop big target.
Kindly trade at your own risk.
Good Luck ^_^

ONGC - Trend AnalysisONGC is in uptrend, making higher highs and higher lows, now this is a crucial point where the price is on support level and touching the trendline for 3rd time, wait for confirmation candlestick!

United sprits to have some good times aheadAs the festival season all around the world, demand for alcohol to rise which can give benefits to all good alcohol making companies.
From my point of view from next week we can see some good rally in the counter
TP1 - 610
TP2 - 640
&
TP3 - 670
Keep stop loss below 550 good luck everyone.

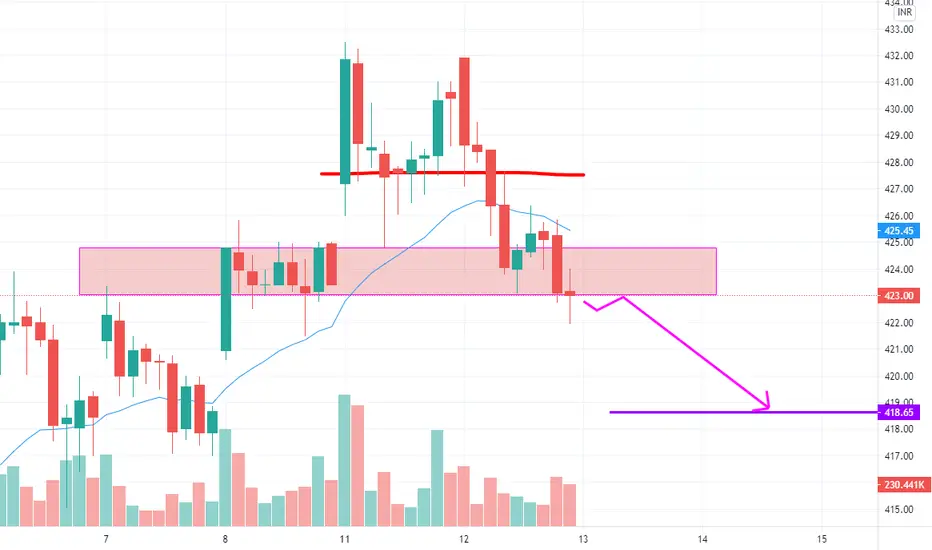
A full bodied candle to exit the range will lead to gap fillingWe can expect that IF the price exits the box and then attempts a downward move a take profit point can be expected at the gap fill range.
STEEL AUTHORITY INDIA LTD. - Bullish PenantSAIL is in bullish pennant pattern, making higher lows and lower highs, wait for breakout for trend confirmation.

KRITI NUTRIENTS LTD. - Descending Triangle KRITINUT is in triangle pattern, making lower highs' & lows are stuck on the support zone.

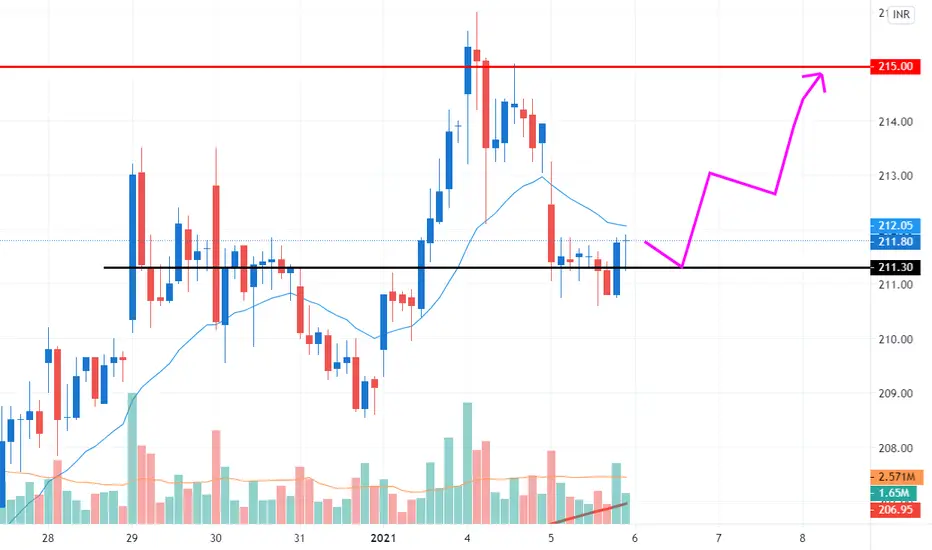
ITC looks rangebound but it fares suffocated ?It has been a rangebound movement today. And we all know what happens in range ----***TOP SECRET***
So get ready for the move on either side but prepare to buy if the stock breaks price action and can take profit at the red line
reliance industries ltd. - Triangle Continuation PatternReliance industries price is squeezing and forming a Triangle Continuation Pattern, wait for breakout!

SHORT SELL OPPORTUNITY IN NTPCReasons-
1) PSU (lol)
2) Weekly trend is down.
3) Rejection from historic resistance.
4) Noob traders buy cheap stocks not knowing it's a falling knife.
5) Small stop with bigger profit targets.
Kindly trade at your own risk.
Good Luck ^_^


Affle India looks good for buy on dipsThis will be one of the biggest future company stay invested for long term. Wait for buy it still have space toward downside, short term buy with target TP1-1930 & TP2-2275 Good luck

BUY CALL HELLO TRADER,
I WOULD LIKE TO RECOMMEND TO BUY NSE:BALAXI AT CMP
TARGET PRICE - 1090
EXPECTED PROFIT - 80%
I'M RECOMMENDING THIS STOCK AS PER TA
THANKYOU

