BSE

SENSEXSensex breakedout the rising support but was not able to break the resistance 35061.95,
Made double top pattern at 35208.17 near the resistance level 35061.95, price came down after making double top pattern to touch the support 34814.88.
Next target 34302.05

SENSEX rally finally coming to an end?See the reaction at the lower line on the rising wedge. Once we break down we have two targets on the chart. A better entry could be the top of the wedge if you would like to sweeten the Risk-Reward ratio. I believe we will make a lower low. This rally doesn't make much sense and at these levels, I much rather be sitting in cash rather than hoping that the bubble will go on.

INFRATEL | NSE | AnalysisHello guys!
Infratel seems to be forming an ascending triangle, and holding the strong trend line.
Price has been rejected at support 4 times as indicated with arrows in the chart.
It is now closing in on the top resistance, if broken / flipped will aim for new all time highs.
MACD and Stoch RSI support the bias.

INDUSINDBK | NSE | ANALYSISHey guys!
IndusIndBk has broken out of its major resistance level and has flipped it to support.
It has consolidated for a while above the support, which is healthy. And, it's closing in on the D-Day.
MACD is converging bullish adding to the bias.
Stoch RSI has bottomed out and is ready for a reversal.
Next possible resistances are way above 600 rupees, which is the 200MA on the 4H. That's a 30% easy target in the coming months.
Above are my reasons to enter the trade.
Thank you!

Technical chart analysis for Kotak Bank to trade on 22nd /Jun / Hi Friends,
I am sharing this technical analysis for Kotak Bank and its for intraday purpose to trade on 22nd Jun 2020


SBIN Cup and Handle Trade SetupWe have Really Good Setup on SBI
First Buy 175 - 180 RS if comes to that than buy someone
else another entry above 200 RS

KOTAK MAHINDRA Trading Setupif Price unable to hold than next Support is 1200 Rs
right now market is bullish so we expect it to go above but we will wait for perfect entry rather than gambling

TCS Price At Daily Trendline Support Volume is good we need daily close above the Trend line Support
if we have that on monday market than ready for the big 10% jackpot

Reliance Ascending Triangle Breakout We discuss about daily breakout in last chart and we have that daily breakout now price going above.
Target overall done with reliance debt free .. more to come

Bank nifty analysisBank nifty analisis and it says that its gonna be a short entry...
Please see the analysis....
#banknifty #nifty #NSE #niftybank

JSW Steel price at trend line SupportPrice taking support 188 rs now , from now price can move above
We need monday daily candle close above 195 if we achieve that close than it can move higher

Mahindra and Mahindra Price at Resistance.Daily price close above 520 than it is really ready to move above.
if price not close above 520 than it can take support at the lower region around ( 480 rs ) for short time.

NIFTY50 | BEARISHOutlook isn't good, Strong correction coming up.
-Head and Shoulders pattern forming.

JSW STEEL LTD | NSE | ANALYSIS JSW STEEL Has broken out of a ascending triangle and has retested the support quite a few times, holding strong.
- MACD is closing in and a bullish crossover is imminent, implying a continuation upwards.
- The price action is currently supported by the 50MA on the 2H TF.
- First target is 205 (7%)
- Second target is 231 (~20%)
If you like my charts, don't forget to leave a like below :)

JSW ENERGY | BULLISHJSWENERGY is showing buying pressure at this level.
-MACD is crossing bullish on the 1H which will take the price past 45.
-Resistances are at 46.5 and 49.
-Please leave a like :)


#VEDL #NIFTY #NIFTY50 #VEDANTA #INVEST #EQUITY ##Bullish #WedgeBoth Rounding Bottom And Bullish Wedge formed in #Vedanta ( #VEDL )
The Exponential Moving Averages crossed above
Closing Price of last candle closed above the resistance with a huge increase in volume
Expect a bullish reversal
Final Target will be 140-145
Up side potential high
Return:Risk Ratio High.

Hold it for a weekAfter few days of consolidation, we may see upside moves again my stop loss will be 388 and looking for the target of 450.

IRCTC | Don't underestimate it
IRCTC has been consolidating in a pennant right under the resistance for about 2 months now.
Just broke out of it today, im long IRCTC until it hits 2000. Not selling before that.
Think about it, the Railways are yet to operate in full capacity after lockdown is phased out slowly. Definitely i would expect this piece of art to boost up once the economy is unphased.
DONT MISS IT!
Leave a like if you like my charts, it encourages me to publish more charts to the public. Thank you.

TATA MOTORS | NEXT STEPS
TATA MOTORS Perfectly breached the 92 Resistance.
Next target would be 106 imo
Will update once 96 is breached or otherwise

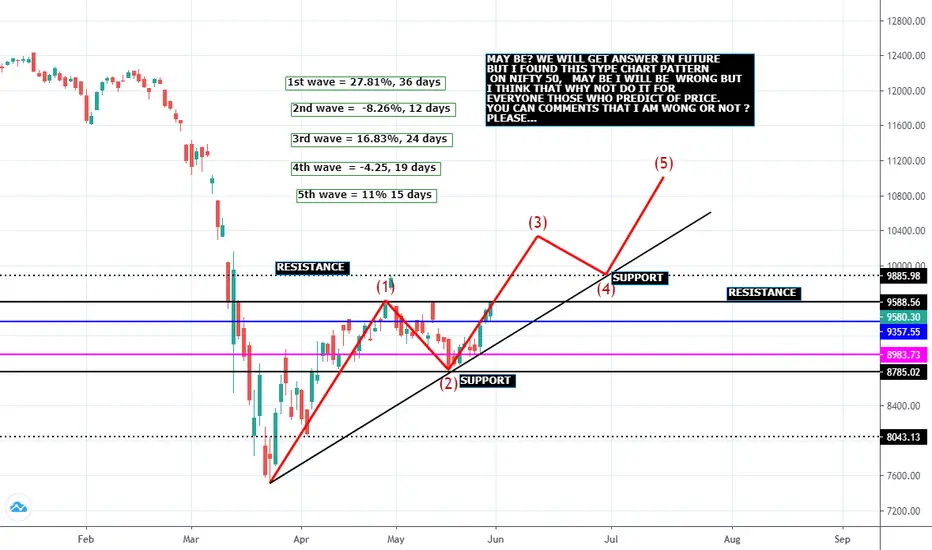
NIFTY 50 LONG ANALYSISNIFTY 50 LONG ANALYSIS THROUGH WAVE PATTERN. MAY BE NIFTY INDEX REACT AS WAVE THEORY
SO I TRY TO PREDICT OF PRICE LEVELS...MAY I WILL B E WRONG BUT I TRY TO GIVE A VISION ON NIFTY 50 PRICE ACTION.
PLEASE COMMENT IN BOX...THAT I AM RIGHT OR WRONG...GIVE ME POWER FRIENDS THOUGH CLICK LIKE BUTTON AND SHARE THIS CHART IF YOU LIKE IT...