INTEGRAEN - H & S PATTERNCMP 57.
Long suggested at 64.
Stop 54
Head and shoulders pattern.
Exponential triple digit growth in YoY quarterly profits last 4 quarters.
650%, 200%,99%,338%
FF 633 crores / MCap 1624,
RoE 33%.
Only concern D/E > 1.
BSE

SADHNANIQ - A PROSPECTIVE MULTIBAGGER#SADHNANIQ
BSE listed
CMP 722
lONG SUGGESTED ABOVE 760
Stop 670
Target Open
Logic
Technicals
Stock in a strong uptrend with all key MAs sloping upwards.
VCP observed in daily charts.
Fundamentals
Strong exponential growth in eps in the last 4 quarters
Qn-4 Qn-3 Qn-2 Qn-1
Sales 15.27 15.9 27.38 51.39
Sales YoY qrly growth 20.1% 127.6% 166.8% 331.0%
OP 1.9 2.14 10.65 19.52
OP YoY qrly growth 19.6% 706.8% 730.6% 1730.5%
NP 0.83 8.08 21.86 22.32
NP YoY qrly gr 4050.0% -2706.5% 1648.8% 3620.0%
OPM 13.46% 38.90% 37.98% 52.84%
NPM 5.22% 29.51% 42.54% 33.91%
Promoter holding 74%
D/E 0.3
Operating cash flow mar 2017 to 2018 : 440% growth

RACLGEARTECH - VCP pattern observed#RACLGEAR
BSE listed
Long suggested above 73.
Stop 65
Target Open
Logic :
#VCP
Volatility contraction pattern
A TO B 43%
C TO D 23%
E TO F 13%
Fundamentals
Qn-4 Qn-3 Qn-2 Qn-1
Sales 13.1% 18.7% 77.0% 53.1%
OP -0.7% -9.0% 13.7% 165.3%
NP 53.7% 45.2% 68.0% 147.7%
OPM 8.50% 8.80% 14.76% 13.36%
NPM 3.23% 4.68% 10.71% 4.20%
Positives -
EPS has been on an exponential grwoth for the last 4 quarters.
Negatives -
Debt to Equity 0.82
Mkt cap Rs 70 cr
Promoter holding 48% (15% pledged; 33% unpledged)
HIGH RISK INVESTMENT. HENCE PLEASE ENSURE YOUR POSITION SIZE IS AS PER YOUR RISK APPETITE
POSITION SIZE CALCULATION:
Eg : Total Capital allocated for trading stocks : Rs 10 lacs
Risk appetite : 0.5% of Total trading capital = Rs 5,000
Entry price 73
Stop 66
Risk planned in this stock = Rs 7
Position size 5000 / 7 = 714 (Around 710 to 720)
So when 715 stocks are bought and if price reaches the stop of 66, the loss is Rs 5000 which is the risk accepted.

Torrent Pharma at ResistanceTorrent Pharma is at a long term strong resistance. A short can be initiated with a stop & reverse above 1800. The risk to reward is extremely attractive. A break out hitting our stop loss would make for a strong rally, and a good long trade, recovering the SL.

Bullish breakout in Godrej Consumer Godrej CP seems have a bullish breakout and a long trade can be initiated here.


Buy Confidence Petroleum at CMP for momentum playThis is a super strong chart when compared in NIFTY 50 since last peak. Price has taken support on Kumo cloud and bounce back up and continue the trend higher. The AD line has fantastically moved upward without major change in the price, this means price is ready for a BO upwards.
The target is open and can reach great heights.
Happy Trading / Investing
Regards
Shamoil

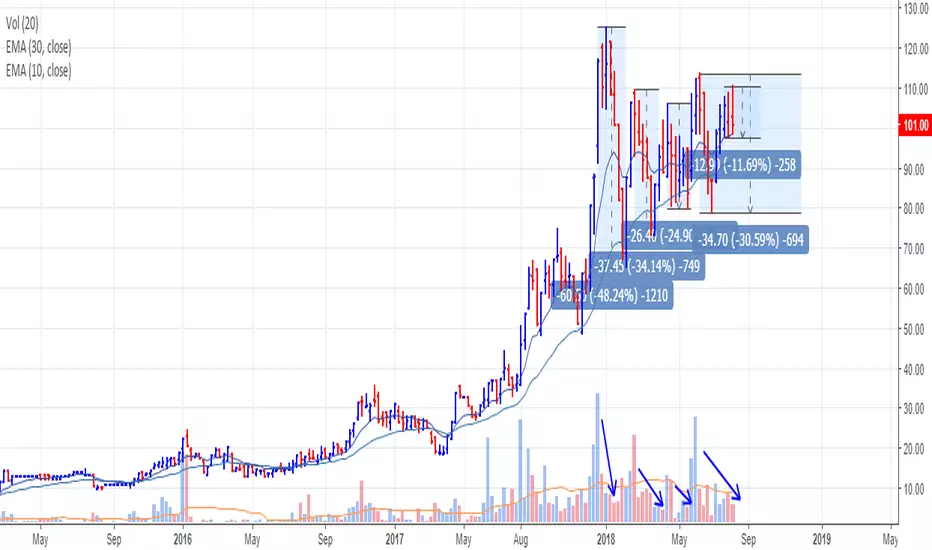
PERMAGN - VCP Pattern in progress - Buy Watchlist#MK
#PERMAGN
#BSE listed stock
Permanent Magnets Limited
CMP 101
Buy ONLY above 115.
Stop 99
Target Open (Trail 10 weeks MA)
#VCP
33W 48/11 5T in progress.
Fundamentals
Positives:
YoY quarterly profit has shown a significant uptrend in the last 4 quarters.
Margins have also been steadily increasing.
Promoter holding 71.80%
Negatives:
Debt equity at 0.93
0.36% of shares pledged by promoters.
Qn-4 Qn-3 Qn-2 Qn-1
Sales 26.36% 30.92% 49.01% 18.20%
OP -9300.00% 19.80% 29.86% 1052.63%
NP -190.00% 36.11% 270.83% 444.44%
OPM 5.48% 5.35% 7.77% 14.95%
NPM 1.07% 2.17% 7.39% 10.04%
Enter Short on BPCL for the month of AUG...Hi Friends,
Please see the snapshot its a clear down trend began for BPCL ----
Try to BUY PE's I expect it to go down below 320 BY EOD of AUG and continue to go down even more in SEPT..


Orient refractories - Classic C&H bullish patternORIENT REFRACTORIES
CMP : 202
STOP : 170
TARGET : OPEN
Technicals
1) Stock broken out of a classic C & H pattern with huge volumes.
2) All key MAs pointing towards a strong uptrend
Fundamentals
1) Last 4 quarters Y-o-Y EPS growth and sales growth exhibiting strong uptrend
Date EPS %Chg Sales(Cr) %Chg
Mar-18 2.29 +56% 178.9 +40%
Dec-17 1.84 +32% 157.8 +23%
Sep-17 1.68 +20% 148.4 +12%
Jun-17 1.36 -6% 141.7 +8%
2) Free float - 30% / Equity capital Just Rs 12 crores and Free float Rs 3.6 crores.
3) Debt Equity Nil.

#MCX heading to 1607MCX on 2 Month chart showing bounce of 38.2% fib and has started wave 3.
Long term target is 1607.

NIITTECH Flag pattern TradingApproaching oversold conditions on the weekly graph.
TA also suggests signs of next wave formation.
Although, recent acquisitions could give a boost in the perceived value by the market.(Arago and Cast)
Hit the top resistance and retraced back ~22%.
wait for the channel breakout(green)
and trade in the flag pattern. watch out for the resistance marked in red.
I will update on the next price movement. and targets if it stays in the channel.

AARTIIND: Continuation of Uptrend(Long Term Opportunity)AARTIIND in the bullish channel.
Oversold conditions reached on a weekly graph testify for the upcoming price action prediction.
Buy:1215
Stop: 1045
Take Profit:
1560
1903
(Others: Strong Buyback history last one at ~1150)
Check news and update in comments.

HCL Technologies - 20-25% Return in coming 8-10 monthsHCL Technologies has given a nice breakout today over a long term price point. This signals a good up-run in the coming months.A short term will occur in June and then some sort of low - a buying opportunity - in July. And then can sit tight for a ride up to 1200-1300 in Jan 2019.

MOIL is it a trap ?Although a promising long term buy.
RSI approaching oversold conditions.
Moil currently getting into a stochastic correction.(Look for the local peaks and troughs)
the price action would always follow Stoch.
Oscillators suggesting strong signs of next motive wave formation. However, the last motive wave pulled back below the last corrective wave,
Possible reasons could be a high dividend yield of~5%, implying a possible truncation at the top. Not suited for long term(>1y++).
I will update on the objective targets on request.

MOIL is it a trap ???Approaching oversold conditions.
Wave 3 pulled back beyond motive wave 1 termination. suggesting a truncated wave 5 and a temporary trend reversal.
Although this stock is a good long in Stoch correction. look for the local peaks and lows.
A possible explanation could be the high div. yield ~5%++
In any case, it is wise to wait till it snaps out of the stock correction.

GLENMARK Next Move(Mid Term Opportunity)RSI Depicting oversold conditions. strong support at ~520.
approaching crossover on a weekly scale. Strong Signs of an upcoming Bull run.
Take Profits:
640
730
900
1045

Long SONATA SOFTWARE at 333I am long in this stock at 333. Looks like it will make a new 52week high

Rajesh Exports - Good BetRajesh Exports, world's largest gold jewellery manufacturer and India's biggest exporter of gold jewellery is our second buy recommendation for the coming 6 months.It is currently trading around 800 level. According to our research, we can see this stock trading between 950 - 1100 levels in the near future.

Pfizer - Target 2700-2800 in 10 MonthsPfizer, probably the only pharma company in India that is going to make a new high. The pharma sector in India is in a bear territory for the last couple of years. Having found a stock in this sector that is yet to make a top is like finding light in the dark. It's good news for those who have significant exposure in this sector. It's not going to do much for them but something is better than nothing. But one must get rid of this stock as soon as it touches the level of 2700-2800, do not get optimistic when it does that. I repeat do not hold it beyond those levels.It will be too risky. When time is up, it's UP !

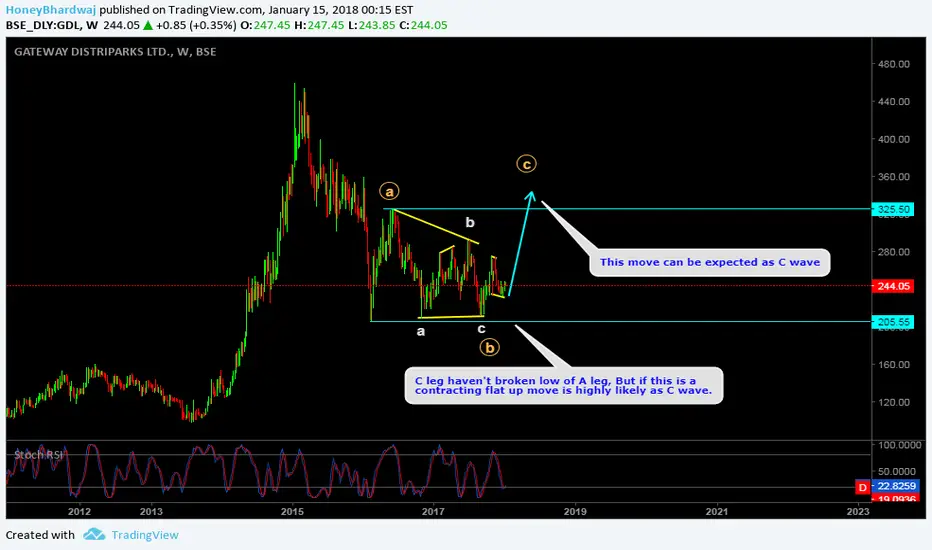
GATEWAY DISTRIPARKS LTD analysisThis idea is user requested: There is high probability that it will make that up move, contracting flats are rear patterns but can't say that it's not the one. so if you wanna buy you can it but put your SL below low of Bigger A leg.
FEDERAL BANK Correction Over-Signs of trend reversal. Approaching the next buy target of 85.
Wait for the buy signal at that target.
RSI approaching oversold on a weekly scale.
AO approaching crossover. may form elliot motive wave 1.
Take Profits:
105
125 (strong resistance)
155
178
