WILL YOU LONG BANK NIFTY THIS IS FOR YOU ???EVERYTHING ON THE CHART
JUST HAVE A LOOK
USE MY ANALYSIS FOR THE OVERALL VIEW OF THE MARKET
HAPPY TRADING!!!
BSE


Tata Steel - Rs 450 - October 2018 TargetIf you hold Tata Steel in your portfolio, it's prudent to exit at the current level and book profits. We are expecting the stock to head lower until October of this year. And then we can buy the stock at a discounted price of around Rs 450.That is the whopping 40% off of the current price. Call it the Great Diwali Sale for Indian stocks.

Tata Motors - Bright / Not Bright - Short term shortingTata Motors - the stock is treading lower with every passing week and will continue to do so until November of this year. What has to be seen is the price level.We are expecting around 280, however, the carnage could take it lower, depends on how hard the FII are involved in the selling. But we believe the low of Feb 2016 @ 266.00 should not be broken. Because if it does then the future of Tata Motors is bleak for coming 6-7 years. And in my personal opinion Tata Group is the best Indian company with least to no manipulation of its stock prices.

3M India LtdThis stock is our first pick of the year for our readers.Handpicked after sifting through countless companies.We see good potential for the stock to jump from current levels.We see the stock moving towards the price band of 27000-30000 in the coming 8 to 10 months. Currently trading at 21000 level, the upside return is above 30%. Keep your eyes on the stock.

FDC - LOOKING VERY BULLISHFDC
CMP 305
TARGET 360 PLUS
STOP 275
Weekly chart
1) Stock has cleared previous reistance with huge volumes.
2) Stock has had a long consolidation W pattern spanning several months, the range of which has been convincingly broken out.
3) Stock has the potential to move towards 360 plus in the coming weeks time.

LOTUS CHOCOLATE - HIGH POTENTIAL AHEAD...LOTUS CHOCOLATE
CMP 51
STOP 39
TARGET 82 PLUS
Weekly Chart
1) Stock clears 200 period ema with huge volumes and currently consolidating with low volumes, possibly a penant pattern structure formation.
2) Stock has the potential to go towards 80 plus. An important fundamental reason apart from the above technical pattern is, globally cocoa price has begun its uptrend journey. Cocoa price has cleared a major resistance at $ 2225 in weekly chart preceded by a multiple bottom formation (4 bottom formation), possibly heading towards 2800/3000.

PIRAMAL ENTERPRISES - A SHORT SETUPCMP 2441
TARGET 2185/1822
STOP 2575
Stock below 200 ema.
Stock has broken key multiple support levels with huge volumes.
Short only below 2425.

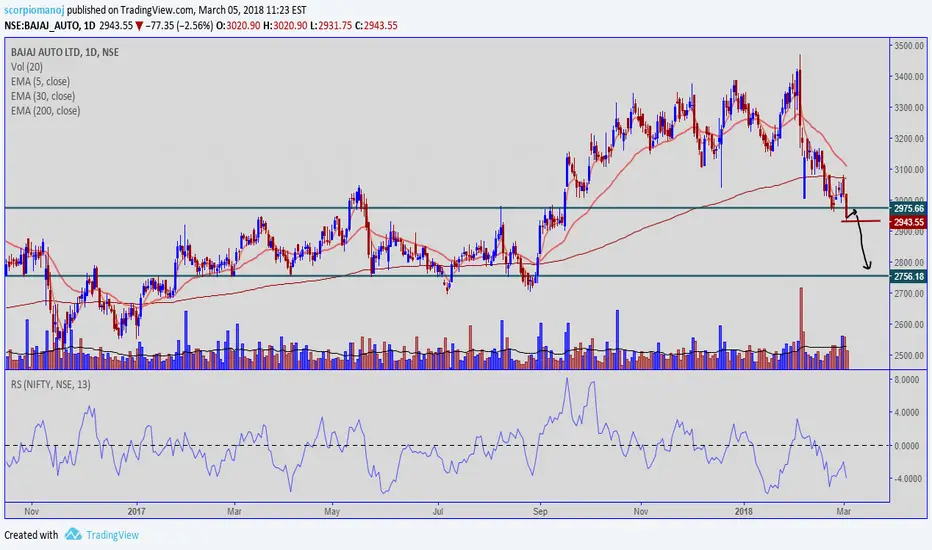
Bajaj Auto - A potential bearish setupCMP 2943
Target 2750
Stop 3025
Stock below 200 ema
Breaks previous support.
Shorting suggested only below 2930.

Nifty long term, wait for the market to fall below 10,000This run looks like an ending diagonal, with massive fib cluster in 11,200-11,500

Aro Granite three year ascending triangle breakout/downAhead of the result on 21 Jan let see how this stock is doing this week


TCS completed Wave 4, up for Wave 5 (Long Term view)With positive result TCS broke the Wave 4 triangle this week on Weekly time frame, with this it should be up for Wave 5 which it should minimum run to 4,500 for Wave 5 completion.

Nifty ready for Wave 3 and break to new high ?With positive global market performance, Nifty looks like it completed the wave 2 and to see a gap up tomorrow seems to very high, the rally tomorrow will be wave 3 if it breaks 10550 area and ultimately to complete the wave 5 towards 10600. Price is in a channel under a bigger channel, we have already tested the bigger channel support last week and now it is in the inner channel and succesful break out tommorw above 10550 will confirm the next leg up. If in case 10400 is broken to the downside then this set-up will be invalidated.

Venus Remedies Limited broke two year symmetrical triangle Venus Remedies Limited attracted massive volume in today's trading session, which helped this stock to break out of two year long symmetrical triangle on weekly time frame to potential to run towards 200 with on the way four ladder profit cover opportunity to ultimate target of around 200.


ASIANPAINTS look for break of this correction to downside.Hi Guys, Those who trade it can look for break to downside if it broke that corrective structure then more up or more down.

HEROMOTOCORP : SELL SIGNAL To Rs 2598 and Rs 2266Supreme Court bans BS 3 vehicles models for sale and Hero has inventory of 3.5 Lakhs to get rid off.
This will prove as Catalyst for EW to finish its pending C wave.

Long @ 2407Strategy: Buy @ 2407
------------------------------
TCS was on uptrend and correcting it's uptrend after hitting 2700 resistance zone. Correction was on running flat correction which was supposed to be completed below 2100 levels. Post 2100 support reach, script was able to jump and tested 2550, We are calling it's five wave impulse move in nested manner. 2407 can provide good support level here to go long.

CrudeOil Elliottwave View: Buy the dipStrategy: Buy the dip
------------------------------
CrudeOil is in correction phase and looking for W-X-Y correction on weekly chart where target for Y is above 55. On Short term, we are waiting for good opportunity to go long. After breakout of bullish inner channel, we are on sideline and looking to see support on outer bullish channel.
