Bseindia
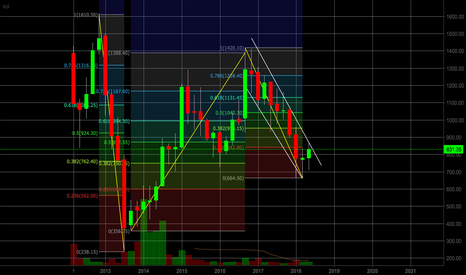
State Bank Of India- Best buy opportunity HI,
I hope everyone is doing well. as the start the last couple of months is really depressing for banking sectors as every major public sector banks is suffering at the moment and it's quite hard to just rely on the Technical side of these assets so just keep in mind that the risk is a little high while we try to go long on them, but it's really interesting to know what our technicals have to say one of major public bank ( State bank of India).
As per our analysis, We have found a major support in a month time frame in state bank of India. Remember this call is for holders whos like to double their money in a year.
Good luck.
NIITTECH Flag pattern TradingApproaching oversold conditions on the weekly graph.
TA also suggests signs of next wave formation.
Although, recent acquisitions could give a boost in the perceived value by the market.(Arago and Cast)
Hit the top resistance and retraced back ~22%.
wait for the channel breakout(green)
and trade in the flag pattern. watch out for the resistance marked in red.
I will update on the next price movement. and targets if it stays in the channel.
Pioneer Distilleries BO above 255 , can trade long as weekly charts shows bullish crossover on aroon indicator.
LGBROSLTD - High probability bullish setup observed.LGBROSLTD
CMP 1220.
Target 1700 plus
Stop 1100
Weekly chart
Stock has broken out of the cup pattern which is more visible in daily chart.
Stock has broken above convincingly the long term upward sloping trend channel. Upper boundary should ideally act as a support going forward.
Expected target is 1700 plus which is 50% of the width of the channel.
Stop is 1100 which is previous resistance based support.
DILIP BUILDCON - BULLISH SIGNDBL
CMP 1114
Target 1280 plus
Stop 960.
Daily Chart
1) Stock has bounced back convincingly after a long period of cup based consolidation.
2) Stock has also bounced back from 30 day ema support.
3) Relative Strength bounces back from support.
Strategy
Aggressive traders can buy at CMP.
Conservative traders can buy at possible retracements around 1170 to 1115 levels; but should be prepared to miss out if rally continues without retracement.
Target 1280 plus and Stop at 960.
Pfizer - Target 2700-2800 in 10 MonthsPfizer, probably the only pharma company in India that is going to make a new high. The pharma sector in India is in a bear territory for the last couple of years. Having found a stock in this sector that is yet to make a top is like finding light in the dark. It's good news for those who have significant exposure in this sector. It's not going to do much for them but something is better than nothing. But one must get rid of this stock as soon as it touches the level of 2700-2800, do not get optimistic when it does that. I repeat do not hold it beyond those levels.It will be too risky. When time is up, it's UP !
HINDALCO - A SHORTING OPPORTUNITY
Hindalco
CMP 220
Target 180
Stop 237
APART FROM THE TRADE SETUP, I HAVE ALSO EXPLAINED THE MOST IMPORTANT ASPECT WHICH IS POSITION SIZING AND RISK MANAGEMENT.
THIS FORMS 80% OF A TRADING STRATEGY AND THE BALANCE 20% IS THE TRADING SETUP. FOLLOWING THIS WILL INCREASE THE PROBABILITY OF SUCCESS IN TRADING BUSINESS.
Higher time frame (weekly).
1) Stock has breached 30 ema.
2) Stock has breached the previous weekly support zone of 220.
3) Falling RS confirms the beginning of a possible downtrend for this stock.
4) Next weekly support zone is 180.
Intermediate time frame (daily)
1) Stock has breached 200 ema.
2) Stock has also breached the support zone with good volumes.
3) MACD / RS etc are pointing towards a possible continuation of downtrend.
Lower time frame (hourly) - Trade entry time frame
1) Wait for the price to come to the value zone which is between 20 ema and 30 ema.
2) Once the price is into the value zone, next step is to watch out for a trigger to enter a short position. Trigger is a bearish candle which could potentially be identified by confirming stochastic 533 crossunder above 50. In all probability that should rest somewhere around 229-230 making it as the ideal entry point for a short trade.
Position sizing and Risk mgmt:
1) Assuming trading capital of Rs 10 lacs.
2) Assuming risk appetite is 5% of trading capital, which is Rs 50,000.
3) NRML Margin required for this trade = Rs 1 lac.
4) Loss willing to accept as per stop loss = (Stop price - Entry price) X Lot size = (225-237)*3500 = Rs 42,000. Since this is less than the risk appetite, ie item 4, this trade is ACCPETABLE.
5) In other words,
Risk appetite = Rs 50,000
Entry point = Rs 225
Stop = Rs 239
Risk = Rs 14 per 1 stock (not 1 lot).
Number of stocks permitted to enter as per risk appetite = 50,000 / 14 = 3571.
Futures standard lot size = 3500
Since futures lot size is less than no. of stocks permitted to trade, this trade is ACCEPTABLE.
Hence, no. of lots permitted to trade with a capital of Rs 10 lacs is 1.
Exact capital required to trade this setup = Risk X lot size X no. of lots / Risk appetite % = 14 X 3500 X 1 / 5% = Rs 9.8 lacs.
ie, FOR EACH LOT AS PER THE RISK APPETITE OF 5% OF TRADING CAPITAL, RS 9.8 LACS IS REQUIRED AS TRADING CAPITAL.


