Gujarat Industries Power Co Ltd (GIPCL)Gujarat Industries Power Co Ltd
Book Value ₹ 195
CMP :79
Undervaued Stock
Sales more than market cap
Debt Free Stock
Dividend yield
EPS last year 12.1
Reserves ₹ 2,791 Cr
this canbe a big multibagger
Bseindia

Excel IndustriesCup and Handle Breakout
above 1021
we can see 1120 levels , SL 903 if the rally continues
Above 1137 sl 961 then targets can 1215 -1220-1250

Wait for breakoutin 1 Hr TF, if price break trendline and give hard close after breakout we can see nice movement...
This means if the orange line breaks and make a complete white candle after breaking, the orange trend line then we can expect a nice upward movement.. or we can test pink or orange trending before a big upmove and similarly, if pink break and nice blue candle formed outside it then we can expect nice down movement, or before move down we may test pink or orange trend...


Laxmi Organic Industries ltdLaxmi Organic Industries locked in upper circuit on healthy Q3 earnings
Laxmi Organic Industries' December quarter operating revenue grew 97 percent year-on-year to Rs 859.9 crore

Devyani InternationalDevyani International All getting set for a big move
crucial levels are 182
Above 182
we can see testing r1@ 235 levels


AGIIL near breakout levelThe stock is at the verge of it`s breakout. It can give a good move in coming days. Keep an eye ! This is just for educational purpose and not any investment/trading advise.


SENSEX (S&P BSE Sensex) Index Analysis 07/04/2021as earlier we had predicted an other impulsive wave for better shorting position and we shorted it at 50363
Fundamentals:
as we know the system is Forcing the Covid-19 Vaccination to the public so it requires to reshut the country for showing it some seriousness and let the Culprit capitalists gets more capitalize and some Retail Section to loos on some positions.
we are facing another lockdown and it will effect the economy and it stimulate the market to make some retracements.
Technical Analysis:
now we are getting our Bearish Divergence with MACDs confirmation with the Head Fall of the Bullish rally and retest of the immediate Support we can now specify 4 Targets by Fibonacci Retracement.
these 4 Targets are having strong confluences with the certain levels in Price Action analysis.
we can target the 3 TP as soon as we the 2TP gets Trigged followed by some retracement and Distribution

Buy TATAPOWERBullish harmonics hovering around tata power. Levels mentioned on the chart. 207 buying level with 197 of stoploss and 222 target.
1:1.5 R2R i.e. risk to reward

#Hindalco Short Term Positional View Looking good for swing
If #HINDALCO sustains above 474.
Expected Targets: 485, 500, 520
SL: 445.
this is not a recommendation, this is just a personal view.

Breaking DowntrendUpmove
Buy above 2490
Target 1 2600
Above 200 Ema, up Longterm trend
Crossing 50 EMA
Crossed downtrend line.
RSI going above 50.

DIVISLAB TARDE IDEADIVISLAB very good buy above 5385 for posional target of 5400+/ 5500+
its HEAD & SHOULDER brekout in 1 day time frame and we can entry in 1 hr time frame clear brekout of POLE & FLAG pattern brekout with volume as well try to grab on by monday.
NSE:DIVISLAB

TATAMotors ShortTerm Trade & Long+Mid Term Investing OpportunityStock broke down in the previous triangle pattern due to news regarding chip deficit and is nearing the strong support zone around 285 RS. It may find support and undergo a reversal rally within the current prize channel or breakdown causing further crash. Brokerage Houses around the world are bullish on the stock. Stock is good for traders to enter or for long term investors to enter as this price acts as a strong support zone preventing further downside with upward potential.
Enter The Stock after confirming support around RS 280-290.
Target Price - RS 338-355 (Near the Resistance for *Traders*) (*Investors* Can Hold on to the stock without exiting the trade for medium to long term investments)
Stop Loss - RS 260-250 supported by strong support and 200 EMA below (For *Traders*)
Risk Reward Ratio for Traders - 2:1
DYOR before taking action. No Trade can be 100% Successful. Position Sizing Is Important.
Also note for investors - This is not a Investment recommendation. It is just a good price level to add up stocks or newly invest into TATA Motors due to technical situation of the stock.

Bandhan bank gave breakout on Falling Wedge chart patternBandhan bank was creating Falling Wedge chart pattern and gave break out to it.

Indian bank technical chant patternIndian bank has created beautiful reverse head and shoulder traditional chart pattern. Based on this technical chart pattern, target is very high.
The support this target, Fundamental of Indian bank also supports here because this bank's book value is more than 300.


YESBANK trading at strong support levelYESBANK is available at all time low price. It's trading at 10.90 which is price seen before almost year at 28th July 2020. After touchinig this level, it showed strong rally and almost reaches at 20. There might chance we see more volume seen at upcoming days and will show same rally as before.

Indian bank trending lineDrawing important support trend line for indian bank which may hard to break as share price takes support at three times and make it more strong support.

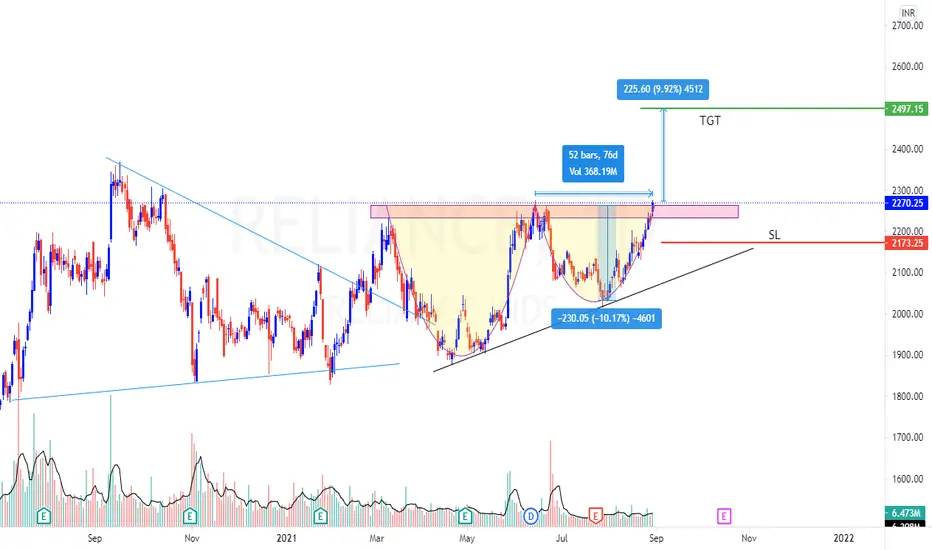
Reliance Chart For Long Reliance give good Breakout After 74 days wait and watch if stock trade near this range with good volume go for the target of at least 10% with the given SL.
This Target Reach around 3 months
Mphasis stock analysisMphasis on a daily timeframes showed us a recovery from 2750 level by projecting a inverted head and shoulders pattern. If it is manages to close above 2930,we can initiate a swing position in it..
