Bitcoin SV will follow Bitcoin Cash & pump to $800 for an doublePerfect setup in BTC pairing. This Bitcoin fork has been the most underwhelming performer. Bitcoin Satoshi Vision shall soon rise. It is currently trading at $374 in fiat value. Once we have the cup and handle breaks out on the 4 hour MACD convergence, it is time to explode to $800+.
BSVBTC

Bitcoin SV (BSV) - May 8Hello?
Dear traders, nice to meet you.
By "following" you can always get new information quickly.
Please also click "Like".
Have a good day.
-------------------------------------
(BSVUSD 1W chart)
(1D chart)
You should watch for any movement that deviates from the 356.660-440.280 section.
In particular, it remains to be seen if it can gain support at 377.950 and climb along the uptrend line.
If you fall at 323.210, you need a short stop loss.
If it falls from the 273.040 point, a Stop Loss is required to preserve profit and loss.
However, if it does not fall below the downtrend line, it is expected to rise.
On the CCI-RC indicator, we need to see if the CCI line can touch the EMA line and rise.
-------------------------------------
(BSVBTC 1W chart)
(1D chart)
614530 Satoshi-711110 We must watch for any movement that deviates from the Satoshi section.
In particular, we have to watch for movements that deviate from the downtrend line.
582337 Satoshi-614530 If it falls in Satoshi section, Stop Loss is needed to preserve profit and loss.
However, it may rise along the uptrend line, so careful trading is necessary.
--------------------------------------
It is advisable to trade at your average unit price.
This is because if the price flows below your average unit price, which was on an uptrend or downtrend, there is a high possibility that you will not be able to earn a large profit due to the psychological burden.
The center of every trade starts with the average unit price you start trading.
If you ignore this, you may be trading in the wrong direction.
Therefore, it is important to find a way to lower the average unit price and adjust the proportion of the investment, so that the money that ultimately corresponds to the profit can regenerate the profit.
-------------------------------------------------- -------------------------------------------
** All indicators are lagging indicators.
So, it's important to be aware that the indicator moves accordingly with the movement of price and volume.
Just for the sake of convenience, we are talking upside down for interpretation of the indicators.
** The wRSI_SR indicator is an indicator created by adding settings and options from the existing Stochastic RSI indicator.
Therefore, the interpretation is the same as the conventional stochastic RSI indicator. (K, D line -> R, S line)
** The OBV indicator was re-created by applying a formula to the DepthHouse Trading indicator, an indicator that oh92 disclosed. (Thank you for this.)
** Check support, resistance, and abbreviation points.
** Support or resistance is based on the closing price of the 1D chart.
** All explanations are for reference only and do not guarantee profit or loss on investment.
Explanation of abbreviations displayed on the chart
R: A point or section of resistance that requires a response to preserve profits
S-L: Stop Loss point or section
S: A point or segment that can be bought for profit generation as a support point or segment
(Short-term Stop Loss can be said to be a point where profits and losses can be preserved or additionally entered through installment transactions. It is a short-term investment perspective.)
GAP refers to the difference in prices that occurred when the stock market, CME, and BAKKT exchanges were closed because they do not trade 24 hours a day.
G1: Closing price when closed
G2: Cigar at the time of opening
(Example) Gap (G1-G2)


#BSVBTC is interacting with the 18 month moving average, a nice strong push the remainder would be very promising indeed.

Bitcoin SV (BSV) - April 28Hello?
Dear traders, nice to meet you.
By "following" you can always get new information quickly.
Please also click "Like".
Have a good day.
----------------------------------
(BSVUSD 1W chart)
(1D chart)
You should watch for any movement that deviates from the 273.040-328.787 segment.
In particular, we have to see if we can get support and climb at 285.240.
If it falls at 217.293, you need a Stop Loss to preserve profit or loss.
However, you need to trade carefully as you can touch the 193.680 point and climb along the uptrend line.
The next volatility period is around May 1.
----------------------------------
(BSVBTC 1W chart)
(1D chart)
We have to see if we can get support at the 517950 Satoshi branch and ascend to the 582337 Satoshi-614530 Satoshi section.
--------------------------------------
It is advisable to trade at your average unit price.
This is because if the price flows below your average unit price, which was on an uptrend or downtrend, there is a high possibility that you will not be able to earn a large profit due to the psychological burden.
The center of every trade starts with the average unit price you start trading.
If you ignore this, you may be trading in the wrong direction.
Therefore, it is important to find a way to lower the average unit price and adjust the proportion of the investment, so that the money that ultimately corresponds to the profit can regenerate the profit.
-------------------------------------------------- -------------------------------------------
** All indicators are lagging indicators.
So, it's important to be aware that the indicator moves accordingly with the movement of price and volume.
Just for the sake of convenience, we are talking upside down for interpretation of the indicators.
** The wRSI_SR indicator is an indicator created by adding settings and options from the existing Stochastic RSI indicator.
Therefore, the interpretation is the same as the conventional stochastic RSI indicator. (K, D line -> R, S line)
** The OBV indicator was re-created by applying a formula to the DepthHouse Trading indicator, an indicator that oh92 disclosed. (Thank you for this.)
** Check support, resistance, and abbreviation points.
** Support or resistance is based on the closing price of the 1D chart.
** All explanations are for reference only and do not guarantee profit or loss on investment.
Explanation of abbreviations displayed on the chart
R: A point or section of resistance that requires a response to preserve profits
S-L: Stop Loss point or section
S: A point or segment that can be bought for profit generation as a support point or segment
(Short-term Stop Loss can be said to be a point where profits and losses can be preserved or additionally entered through installment transactions. It is a short-term investment perspective.)
GAP refers to the difference in prices that occurred when the stock market, CME, and BAKKT exchanges were closed because they do not trade 24 hours a day.
G1: Closing price when closed
G2: Market price at the time of opening
(Example) Gap (G1-G2)

BSV DominanceBSV Dominance has definitely got a good scope based on the trend lines. Multiple resistances are found. It may be bumpy for short term but it has enormous supports.

BSV BullishBullish on BSV, all in.
BTC chart is looking very good. Remember this was at 0.24 BTC at one point?

BSV in big Demand Zone 579$ can be good targetBSV in Deamnd zone with up trend the best level to enter is 427.33 SL 384 and TP 579$
Win Ratio : 1:3

Bitcoin SV (BSV) - April 19Hello?
Dear traders, nice to meet you.
By "following" you can always get new information quickly.
Please also click "Like".
Have a good day.
----------------------------------
(BSVUSD 1W chart)
(1D chart)
You should watch for any movement that deviates from 316.600-342.950.
If it falls from the 258.900 point, a Stop Loss is required to preserve profit and loss.
The next volatility period is around April 22nd.
------------------------------------
(BSVBTC 1D chart)
It remains to be seen if the upward trend can continue by rising above the 621140 Satoshi point.
-------------------------------------------------- -------------------------------------------
** All indicators are lagging indicators.
So, it's important to be aware that the indicator moves accordingly with the movement of price and volume.
Just for convenience, we are talking upside down for interpretation of the indicators.
** The wRSI_SR indicator is an indicator created by adding settings and options from the existing Stochastic RSI indicator.
Therefore, the interpretation is the same as the conventional stochastic RSI indicator. (K, D line -> R, S line)
** The OBV indicator was re-created by applying a formula to the DepthHouse Trading indicator, an indicator that oh92 disclosed. (Thank you for this.)
** Check support, resistance, and abbreviation points.
** Support or resistance is based on the closing price of the 1D chart.
** All explanations are for reference only and do not guarantee profit or loss on investment.
Explanation of abbreviations displayed on the chart
R: A point or section of resistance that requires a response to preserve profits
S-L: Stop Loss point or section
S: A point or segment that can be bought for profit generation as a support point or segment
(Short-term Stop Loss can be said to be a point where profits and losses can be preserved or additionally entered through installment transactions. It is a short-term investment perspective.)
GAP refers to the difference in prices that occurred when the stock market, CME, and BAKKT exchanges were closed because they do not trade 24 hours a day.
G1: Closing price when closed
G2: Cigar at the time of opening
(Example) Gap (G1-G2)

Bitcoin SV (BSV) - April 8Hello?
Dear traders, nice to meet you.
By "following" you can always get new information quickly.
Please also ask for the "Like" clock.
Have a nice day.
----------------------------------
We need to see if it can rise above the downtrend line (3).
If it falls, you need to make sure you get support in the 211.200-218.670 range.
If it falls from the 193.680 point, a Stop Loss is needed to preserve the profit and loss.
The next volatility period is around April 12th.
------------------------------------
(BSVBTC 1D chart)
You should watch for any movement that deviates from the 0.00375420-0.00465310 segment.
-------------------------------------------------- -------------------------------------------
** All indicators are lagging indicators.
So, it's important to be aware that the indicator moves accordingly with the movement of price and volume.
Just for the sake of convenience, we are talking upside down for interpretation of the indicators.
** The wRSI_SR indicator is an indicator created by adding settings and options from the existing Stochastic RSI indicator.
Therefore, the interpretation is the same as the conventional stochastic RSI indicator. (K, D line -> R, S line)
** The OBV indicator was re-created by applying a formula to the DepthHouse Trading indicator, an indicator published by oh92. (Thank you for this.)
** Check support, resistance, and abbreviation points.
** Support or resistance is based on the closing price of the 1D chart.
** All explanations are for reference only and do not guarantee profit or loss on investment.
Explanation of abbreviations displayed on the chart
R: A point or section of resistance that requires a response to preserve profits
S-L: Stop Loss point or section
S: A point or segment that can be bought for profit generation as a support point or segment
(Short-term Stop Loss can be said to be a point where profits and losses can be preserved or additionally entered through installment transactions. It is a short-term investment perspective.)
GAP refers to the difference in prices that occurred when the stock market, CME, and BAKKT exchanges were closed because they are not trading 24 hours a day.
G1: Closing price when closed
G2: Cigar at the time of opening
(Example) Gap (G1-G2)

Retest & Bounce... Shake n BakeWe exploded then retested. Sky is the limit. The world has made a mistake 😁 BSV crushes the competition.

BSV... I knew.Bounce off old failed double bottom. Lets GO!
You cant buy my lucky egg (NFT) from twetch!

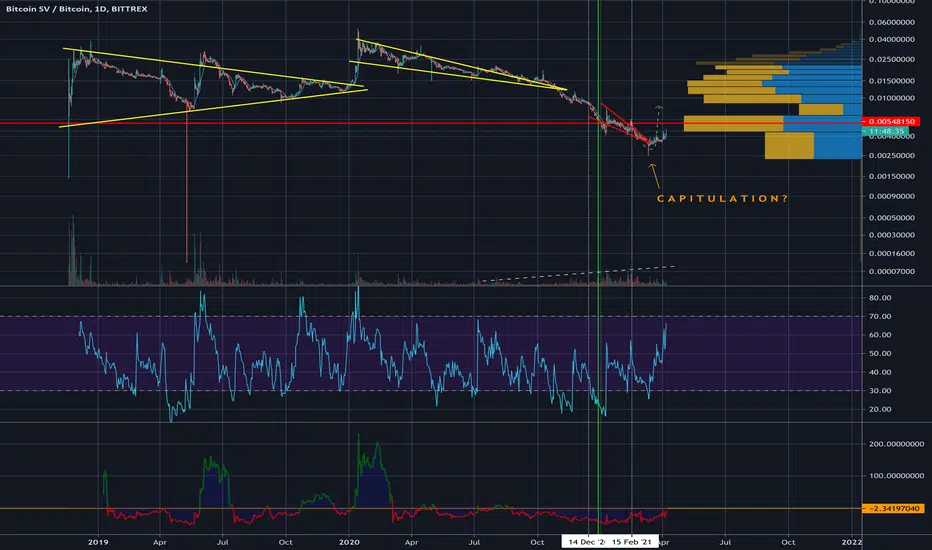
BSV - a 60 X move relative to Bitcoin in the making !!!WHATCH OUT !!!
It is time for THE MOST HATED COINS to arise from its lethargy !!
BSV is the real Bitcoin and stands for the original protocol.
It is to be considered "electronic cash system" - set in stone and immutable.
As I pointed out before the Lenten Period, it has gone through a CAPITULATION phase and was about to turn around the apex of the bullish wedge.
It took some time to do so and is now moving up slowly but consistently.
On the BULLISH SENTIMENT SIDE it has barely started to move.
When the sentiment will flip bullish, it could surprise the whole crypto sphere !!!
I positioned myself around 0.004 BTC - this was a great entry point.
In my personal opinion we will take part at a 60 X move RELATIVE TO SEGWIT BITOIN - at least !!
Target 0.25 BTC.
KEEP WATCHING - AND HOLD YOUR BREATH !!
👀 on BSVLooking great right now. Ready for breakout. Did you get the NFT airdrop easter egg yesterday???!

BSV is the best version of BITCOINExpected bounce achieved and now a retest of this double failed bottom area. Flip to support should be easy but most people are still clueless. Dump and I buy WAY MORE.

Bitcoin SV (BSV) - March 31Hello?
Dear traders, nice to meet you.
By "following" you can always get new information quickly.
Please also ask for the "Like" clock.
Have a nice day.
----------------------------------
We need to see if we can break off the downtrend line and rise above the 211.200 point.
If it falls, you need to make sure you get support at 193.680.
If it falls in the 184.850-193.680 range, Stop Loss is required to preserve profit and loss.
However, it may rise along the uptrend line, so careful trading is necessary.
If you get support at 211.200, you'd expect a move to ascend above 261.170.
The downtrend line (3) is likely to fall without breaking, so careful trading is necessary.
--------------------------------------
(BSVBTC 1D chart)
We need to see if we can break off the downtrend line and rise above the 0.00465310 point.
If it falls, you need to make sure you get support at 0.003126.
-------------------------------------------------- -------------------------------------------
** All indicators are lagging indicators.
So, it's important to be aware that the indicator moves accordingly with the movement of price and volume.
Just for the sake of convenience, we are talking upside down for interpretation of the indicators.
** The wRSI_SR indicator is an indicator created by adding settings and options from the existing Stochastic RSI indicator.
Therefore, the interpretation is the same as the conventional stochastic RSI indicator. (K, D line -> R, S line)
** The OBV indicator was re-created by applying a formula to the DepthHouse Trading indicator, an indicator that oh92 disclosed. (Thank you for this.)
** Check support, resistance, and abbreviation points.
** Support or resistance is based on the closing price of the 1D chart.
** All explanations are for reference only and do not guarantee profit or loss on investment.
Explanation of abbreviations displayed on the chart
R: A point or section of resistance that requires a response to preserve profits
S-L: Stop Loss point or section
S: A point or segment that can be bought for profit generation as a support point or segment
(Short-term Stop Loss can be said to be a point where profits and losses can be preserved or additionally entered through installment transactions. It is a short-term investment perspective.)
GAP refers to the difference in prices that occurred when the stock market, CME, and BAKKT exchanges were closed because they do not trade 24 hours a day.
G1: Closing price when closed
G2: Cigar at the time of opening
(Example) Gap (G1-G2)

BSV/BTC trend reversal (possible 300-400% gains)Classic treand reversal sings:
+ RSi bullish divergnece
+ MACD bullish divergence
+ High volume in last three months of consolidation period.
+ Price is starting to break falling wedge long term resistance.
First strong resistance at 0.12
Good luck!

BSV must flip .0041 and Bounce.Easy. We have 2000+ tokens on chain with next to zero fees.... all on the white paper protocol. We should be on Marz. Just an update on what I see. Volume good today. Tomorrow is big. We also have a DEX now.... lots happening. No advice but opportunity could be knocking for whales.
If you cant send 1 cent its not Bitcoin. Period.

BSV updateSmall bounce... volume is low. Coinbase listed us this morning. Just kidding you couldnt buy BSV if you wanted to lol 😛 I wonder why that is?
I got a yuge airdrop this morning from Relayx 😁
Thanks frens.
Think ill go mint my own Bitcoin Tokens now...


BSVs moment... You can see here our old 'double bottom' which was not a bottom... we have now retested our mid line whatever I drew 🙂 and weve retested as support... Volume was rising nicely today. Lets see. I got more BSV. Forks of Bitcoin are better then any alt coin we can do it all. USE IT. TRY IT. Come build w us. Weve got token exchanged and NFT excitement just beginning ON BITCOIN. No gas fees ETH heads. Try Handcash & Twetch. Try Relayx. Or youre gunna cry one day. Ill hold this coin till the end. Not advice just my 2. Good luck all.


Interesting? Bsv trashcoin last possibility. Looks kinda interesting. I took trade from link to bsv because I could've swap for 35%+ from link 3x long. I am kinda settled up, and it may look pretty similar but we shall see...
Bullish divergence / bounce out of multi-year support. BSV failed too many times, that's why I doubt it will go to the upside but I can take that risk with 35%+ in a day.
