GOLD is showing the $300k way to BITCOINBitcoin / BTCUSD is currently on a strong rebound on its 1week MA50.
It's 1week chart looks identical to Gold's 1month chart. Both are Cup and Handle patterns and Bitcoin lags behind.
Gold has already made its final parabolic rally and nearly touched its 2.0 Fibonacci extension.
This shows that BTC's potential is extremely big, eyeing (if symmetry plays out to the end) $300000.
Follow us, like the idea and leave a comment below!!
Btc!

Bitcoin (BTC) Market Update – May 19, 2025📅 Bitcoin (BTC) Market Update – May 19, 2025
BTC is trading at $105,488 with a slight +0.0115% 24h uptick.
📊 Technical Snapshot:
• Price Range: $102,381 – $106,540 (Moderate volatility)
• Support: GETTEX:97K – $98.5K | Resistance: $110K – $115K
• Trend: Consolidation Phase – Awaiting breakout
🔗 On-Chain Highlights:
• 87% of supply in profit = Potential for sell pressure
• Accumulation increasing across wallet cohorts
• Improved investor sentiment
🧭 Fundamentals to Watch:
• Sharpe Ratio: 1.72 – High risk-adjusted returns
• ETF inflows rising = Institutional demand
• Macro Index flashing Buy signal
📈 BTC Price Outlook:
• Short-Term: $100K – $110K
• Mid-Term: $110K – $129K
• Long-Term: $174K – $462K 🚀
✅ Summary:
Bitcoin remains range-bound but shows strength in accumulation and fundamentals. Keep an eye on $110K resistance for a possible breakout.
#Bitcoin #BTC #CryptoAnalysis #SorooshX

BTCUSD: Going for the decisive breakout that opens path to 155,0Bitcoin is almost overbought on its 1D technical outlook (RSI = 69.391, MACD = 3884.400, ADX = 20.801), which during rallies is the starting condition that fuels bullish breakouts and continuations. Such a breakout is about to take place right now as the price is on the LH trendline coming from the ATH. As this chart shows, once Bitcoin breaks over a LH trendline on this Cycle, it has always delivered (much) more upside. Assuming we are currently on the 0.5 Fibonacci level of that breakout, the pattern gives a TP = 155,000.
## If you like our free content follow our profile to get more daily ideas. ##
## Comments and likes are greatly appreciated. ##

ADA (Cardano) – Long Swing Setup from Major Support ZoneADA is currently trading within a critical support area ($0.71–$0.73), offering a compelling higher low opportunity. With BTC holding strength, ADA may be gearing up for a rebound, particularly if it maintains structure above the support.
🔹 Entry Zone:
$0.71 – $0.73
🎯 Take Profit Targets:
🥇 $0.80 – $0.84
🥈 $0.98 – $1.02
🛑 Stop Loss:
Daily close below $0.66 (loss of higher low and structural invalidation)

LINK (Chainlink) – Breakout Setup Aligned With BTC Macro MoveWith BTC on the verge of a new all-time high, the market is poised for high-beta altcoins like LINK to follow with strength. LINK is currently testing the 200-day EMA — a critical momentum indicator. If BTC confirms breakout and LINK holds this zone, it sets up a high-probability continuation play.
🔹 Entry Zone:
$16 (on confirmation of support at 200-day EMA)
🎯 Take Profit Targets:
🥇 $20 (prior range high / psychological resistance)
🥈 $25 (multi-month breakout level)
🥉 $30 (macro extension target)
🛑 Stop Loss:
Daily close below $14.50 (breakdown of EMA support and invalidation of current structure)

4H Bitcoin Chart - What's Next?Bitcoin is currently trading near $105,000, fresh off a historic milestone where it crossed $100,000 for the first time last Wednesday, peaking at an all-time high of $104,000. This breakthrough past the six-figure mark is a big deal, it’s a psychological level that many traders have been watching for years.
Since hitting $104,000, Bitcoin’s price hasn’t just kept climbing, it’s taken a breather. On the 4H timeframe, we’ve seen some back-and-forth action, with the price pulling back from its peak to test lower levels before stabilizing around $105,000. This pullback isn’t unusual after a big breakout; it’s Bitcoin’s way of catching its breath. The chart shows a pattern of higher highs and higher lows over recent weeks, which keeps the uptrend intact, but the latest consolidation hints that the market is deciding its next move.
Key Levels:
The $104,000 mark, the recent all-time high, is now a resistance level (Bitcoin will need some serious buying power to push past it again). On the flip side, $78,000 is a major support level; if the price drops that far, it could signal trouble for the bulls. Closer in, $100,000 might hold as support now that it’s been conquered, while $90,000 and $94,000 could act as stepping stones for any dips or bounces in the near term.
Bitcoin’s price is dancing around its 50, 100, and 200-period moving averages. This clustering suggests a tug-of-war between buyers and sellers, with no clear winner yet. The Relative Strength Index (RSI) has cooled off, dropping to levels we last saw when Bitcoin dipped below $78,000. This could mean the market’s a bit oversold, setting the stage for a bounce if buying picks up. For now, the price ranging near these moving averages might be building a foundation for the next big push.
Market Sentiment:
The vibe around Bitcoin is a mixed bag right now. On one hand, there’s optimism, big inflows into BTC ETFs since the U.S. election and talk of a new SEC chief have people feeling bullish. On the other hand, some traders are cautious, pointing to a bearish RSI divergence on the 4H chart and warning of a possible correction if support levels crack. It’s a classic case of hope versus hesitation, and the chart reflects that uncertainty as Bitcoin hovers in this consolidation zone.
Wrapping it up, Bitcoin at $105,000 is in an interesting spot on the chart. The uptrend is still alive with those higher highs and lows, but this consolidation phase could go either way. If the RSI and moving averages hint at a reversal, we might see a run toward $104,000 or beyond. But if $78,000 gives way, a deeper pullback could be on the cards, keep $90,000 and $94,000 in sight as potential pit stops. Stay sharp and watch these levels, because Bitcoin’s next move could be a big one.

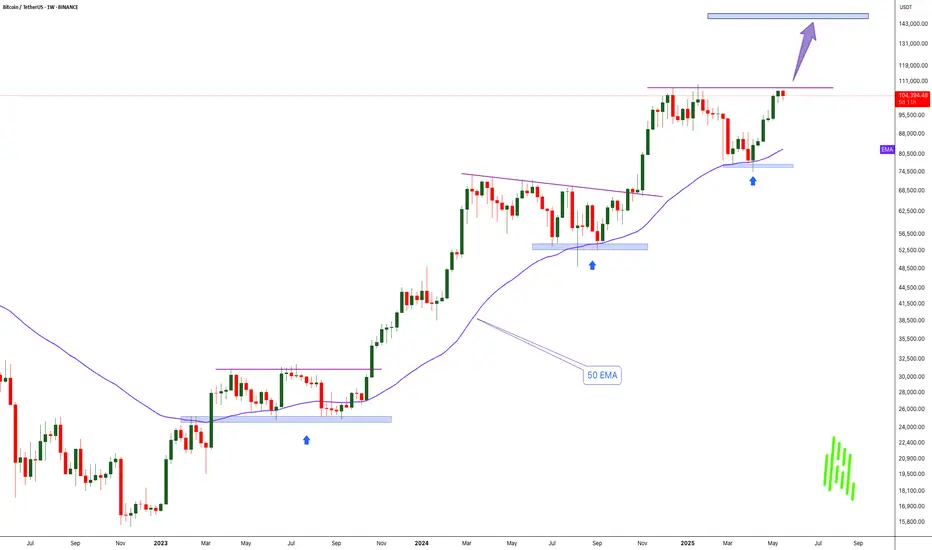
History Repeats: Bitcoin Bounces from Weekly 50 EMA-$150K Next!!MARKETSCOM:BITCOIN continues to show exceptional strength and bullish momentum. If we look back at the charts from 2023 and 2024, a clear pattern emerges — every time BINANCE:BTCUSDT touched the 50 EMA on the weekly chart, it led to a significant rally and eventually new all-time highs. That same setup seems to be unfolding again right now.
Recently, COINBASE:BTCUSD tested the 50 EMA around the $75,000 level and has since bounced strongly. The price has reclaimed the $100,000 mark and is now challenging previous all-time high resistance. Historically, after a successful bounce from this key moving average, Bitcoin hasn’t just recovered — it’s exploded to new highs.
Based on this repeating pattern, our current cycle target is set at $150,000. A clean breakout above the current resistance zone could be the catalyst that propels BYBIT:BTCUSDT Bitcoin into uncharted territory once again. The structure remains bullish, momentum is building, and the trend clearly favors the upside.
This is a classic “Buy and HODL” moment. The technicals are aligning, the market psychology is shifting, and all signs point toward a continued bull run. Buckle up — it looks like we’re in for another legendary Bitcoin rally.
Bitcoin vs Resistance Zones | Fake Breakdown Below the Channel!Bitcoin ( BINANCE:BTCUSDT ) has been moving up and down with high momentum over the past 24 hours and finally fell below the lower line of the ascending channel . Is this break of the lower line of the ascending channel valid?
Bitcoin is trading near the Resistance zone($105,100-$104,140) , Cumulative Short Liquidation Leverage($104,478-$103,941) . Since the volume of breaking of the lower line of the ascending channel is NOT high, the probability of a fake break is very high (in my opinion).
In terms of Elliott Wave theory , the structure of the main wave 4 seems to be an Expanding Flat(ABC/3-3-5) . The main wave 5 could lead to the formation of a new All-Time High(ATH ).
One of the reasons why I think we saw a Fake Break below the lower line of the ascending channel is that I think the S&P500 Index ( SP:SPX ) will trend upward , and given the high correlation between Bitcoin and S&P500 Index these days, we can expect Bitcoin to increase .
I expect Bitcoin to start rising again AFTER breaking the Resistance zone($105,100-$104,140) and touch the targets I have indicated on the chart.
Note: If Bitcoin touches $101,800, we can expect more dumps.
Please respect each other's ideas and express them politely if you agree or disagree.
Bitcoin Analyze (BTCUSDT), 1-hour time frame.
Be sure to follow the updated ideas.
Do not forget to put a Stop loss for your positions (For every position you want to open).
Please follow your strategy and updates; this is just my Idea, and I will gladly see your ideas in this post.
Please do not forget the ✅' like '✅ button 🙏😊 & Share it with your friends; thanks, and Trade safe.

EURAUD BULLISH OR BEARISH DETAILED ANALYSISEURAUD is currently presenting a textbook bullish setup with a well-defined falling wedge formation on the daily chart. After a strong impulsive rally in April, price has been consolidating within this wedge, forming consistent lower highs and lower lows—typical of a corrective pattern. Now, with price testing the upper trendline of the wedge, we are positioned for a potential breakout, supported by increasing bullish momentum and clean structure. With the current price around 1.75, the next leg higher toward the 1.85 resistance zone is well on the radar.
From a fundamental perspective, the euro is gaining strength on the back of improving Eurozone macro data, with recent PMI figures showing resilience and inflation staying moderately sticky—making the ECB cautious about aggressive rate cuts. Meanwhile, the Australian dollar continues to face headwinds amid declining commodity prices and weakening consumer sentiment. The Reserve Bank of Australia remains relatively dovish, especially as wage growth plateaus and inflation expectations cool. This EURAUD divergence sets the stage for a broader move in favor of the euro.
Technically, the breakout from this wedge structure would signify the continuation of the prior bullish trend, and given the size of the previous impulsive move, a breakout target of 1.85 is both conservative and well-aligned with market structure. The bullish divergence forming on oscillators such as RSI and MACD also confirms the slowing momentum in the downward move. A clean break and close above 1.7550 would be the trigger point for long positions, with invalidation below 1.7220.
This is a high-probability breakout setup with strong confluence across technical and fundamental indicators. With euro strength coming into play and AUD fundamentals remaining weak, I’m favoring the long side here. A move toward 1.85 is well-supported, and a break above the wedge could trigger significant upside in the coming sessions. This is a setup worth watching closely.

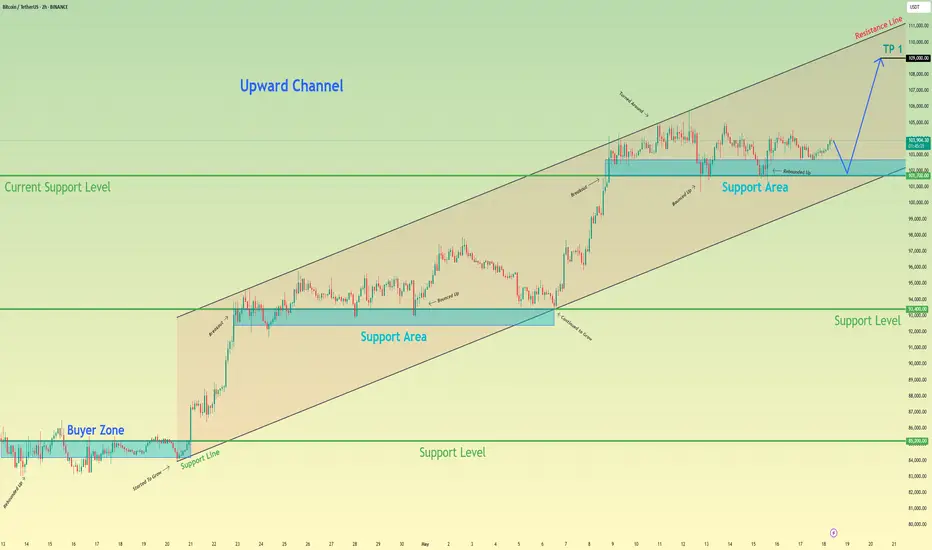
Bitcoin can continue grow in channel, after small correctionHello traders, I want share with you my opinion about Bitcoin. In this chart, we can see how the price remains inside a clear upward channel, respecting both support and resistance boundaries. After breaking above the 93400 - 92400 support area, the price continued to grow and formed a new support zone between 101700 - 102700 points. This area has been tested several times, showing strong buyer interest and keeping the bullish structure intact. Right now, BTC is hovering just above this support area. A minor correction down to this zone would be healthy and could provide fuel for the next upward leg. The market structure shows higher highs and higher lows, typical of a stable channel-driven trend. As long as the price stays above 101700 points, I expect it to move toward the upper channel boundary. That’s why my current target is set at 109000 points, which is the next key resistance and the top of the channel. This move would align with the current trend and follow the previous impulse-retracement pattern we’ve seen throughout this structure. Please share this idea with your friends and click Boost 🚀
HelenP. I Bitcoin can drop to $99500, breaking support levelHi folks today I'm prepared for you Bitcoin analytics. Price is currently testing a crucial area where multiple technical factors converge. After an extended period of consolidation between 101500 and 105100 points, the price failed to break the upper boundary and instead reversed, showing increased bearish momentum. The recent move has brought BTC right to the lower edge of the consolidation range, which aligns with the ascending trend line, a level that has held multiple times before. This time, however, the setup looks weaker. Price pierced through the trend line slightly, and while there was an initial reaction from buyers, the overall structure suggests a loss of bullish strength. The market has been forming lower highs, and this recent failure to hold above the trend line could be a signal that sellers are beginning to dominate. Given this context, I expect that BTCUSDT will soon break decisively below the ascending trend line and move through the 101500 - 100800 support zone. If this zone is lost, the next logical target lies at the 99500 level, which aligns with the broader structure and the base of a previous impulse. My outlook remains bearish for now, with 99500 as the next key objective. If you like my analytics you may support me with your like/comment ❤️

BTCUSDT - Smart InvestorPrudent investors observing BTCUSDT will note the blue box I have highlighted on the chart. It represents a particular juncture where, should market action decisively penetrate this upper boundary, we might witness a rather substantial appreciation in price.
Retracement will be lower but I think risk reward is very good.
Now, the intelligent investor does not engage in speculation based merely on lines drawn on a chart. However, such zones can serve as important indicators of potential shifts in market sentiment and buying pressure. A breakout above this defined area, accompanied by what one might term 'significant volume' a confirmation of genuine interest and not mere fleeting enthusiasm would suggest a possible continuation of an upward trend.
It is crucial, of course, to await confirmation. A breach of this resistance level that is not sustained, a 'false breakout' as some call it, can be a trap for the unwary. Therefore, diligent observation of subsequent price action, particularly on shorter timeframes, is warranted. A successful retest of the broken resistance as a new level of support would lend further credence to the bullish thesis.
One should also consider the underlying fundamentals, to the extent that such a nascent asset class allows. However, in the realm of technical analysis, these zones of potential breakout offer a visual representation of where supply may be overcome by demand.
Therefore, should BTCUSDT indeed break through this blue box with conviction, it would suggest a potential for a robust upward movement. But remember, the intelligent approach is one of caution and confirmation, not impulsive action. We observe, we analyze, and we act only when the evidence supports a calculated move.

BITCOIN This Cycle's peak zone is $150k - $200k.Bitcoin (BTCUSD) is extending its gains week after week since the April 07 bottom on the 1W MA50, which as we've analyzed extensively its a new Higher Low launchpad for the new (current) Bullish Leg, the way it's been consistently doing on the Higher Lows trend-line since the start of this Bull Cycle.
It's in fact the very same Higher Lows trend-line it had during both previous Cycles, which ended up peaking on the Logarithmic Growth Curve's (LGC) top 2 zones (red), breaking also above the 2 SD above band (orange) of the Mayer Multiple Bands (MMB).
This time the price has 'only' broken above the 1 SD MMB (grey), while having breached into just the lower pink LGC zone. This highlights the theory of Diminishing Returns but at the same time also shows the strong upside potential of the market while subject to these conditions.
So assuming it won't hit by the end of this Cycle the 2 SD MMB nor the top 2 zones of the LGC, the bad case scenario seems to be topping the lower pink LGC zone and the good case scenario topping the upper pink LGC zone. Those two give a profit taking range of 150 - 200k respectively and based on the Sine Waves, we should peak around October 2025.
Is that your profit taking zone as well for this Cycle? Feel free to let us know in the comments section below!
-------------------------------------------------------------------------------
** Please LIKE 👍, FOLLOW ✅, SHARE 🙌 and COMMENT ✍ if you enjoy this idea! Also share your ideas and charts in the comments section below! This is best way to keep it relevant, support us, keep the content here free and allow the idea to reach as many people as possible. **
-------------------------------------------------------------------------------
💸💸💸💸💸💸
👇 👇 👇 👇 👇 👇

BTC UpdateLooking at historical data, we’re at a similar point as in 2021 — diverging RSI, declining volume, and signs of exhaustion. The key difference now is the level of institutional involvement: hedge funds are heavily in, MicroStrategy keeps buying, and even nation-states have exposure.
Despite the bullish narrative, I believe we’re heading down.
Price action isn’t convincing — we're still trading below the January monthly candle close, volume is drying up, and RSI continues to diverge. Each 5–10% pump is followed by a sharp spike in open interest (OI), then a brutal liquidation cascade wiping out $500M–$1B. This is starting to look like a leveraged casino, not a healthy uptrend.
That said, I wouldn’t rule out a final wick toward $120K to trap late longs and suck in liquidity before the real move down.
I called the top after the January rally — they called me a madman. Still, I was right.
Mastery tends to be a funny thing, seems like on a long enough timeframe you cant lose.
Stay safe everyone.

PENDLEUSDT → Resistance retest. One step away from distributionBINANCE:PENDLEUSDT is preparing for distribution after a prolonged consolidation. The price is testing a key resistance level, which, if broken, will trigger a rally...
The coin is breaking through the flat resistance and consolidating above the upper border of the range. The key level is 4.400. If the bulls hold their ground above this level, the growth may continue.
Bitcoin is showing bullish dynamics, which supports the altcoin market. The bullish trend may continue in altcoins as well. Pendle may move from consolidation to distribution.
Resistance levels: 4.32, 4.400
Support levels: 4.024, 3.622
If the coin manages to consolidate above the key resistance level, thereby confirming the breakout, the price may move to aggressive growth. In this case, the target could be 4.800.
Best regards, R. Linda!

Hanzo / Btc 15m Path ( Confirmed Breakout Zones )🔥 BTC – 15 Min Scalping Analysis (Bearish Setup)
Bias: Waiting For Break Out
Time Frame: 15 Min
Entry Type: Confirmed Entry After Break Out
👌Bullish After Break Out : 105770
👌Bearish After Break Out : 105140
☄️ Hanzo Protocol: Dual-Direction Entry Intel
➕ Zone Activated: Strategic Reaction from Refined Liquidity Layer
🩸 Momentum Signature Detected:
Displacement candle confirms directional intent — AI pattern scan active.
— If upward: Bullish momentum burst.
— If downward: Aggressive bearish rejection.

Hanzo / BTX 15m Path ( Confirmed Breakout Zones )🔥 BTC – 15 Min Scalping Analysis (Bearish Setup)
Bias: Waiting For Break Out
Time Frame: 15 Min
Entry Type: Confirmed Entry After Break Out
👌Bullish Reversal : 103000
👌Bearish After Break Out : 102000
☄️ Hanzo Protocol: Dual-Direction Entry Intel
➕ Zone Activated: Strategic Reaction from Refined Liquidity Layer
Marked volatility from a high-precision supply/demand zone. System detects potential for both long and short operations.
🩸 Momentum Signature Detected:
Displacement candle confirms directional intent — AI pattern scan active.
— If upward: Bullish momentum burst.
— If downward: Aggressive bearish rejection.
💯 Market Zone: Transition Phase
Asset in premium-to-discount (or vice versa) range — valid for both reversal and continuation trades. Execute with precision.

Bitcoin Hourly Analysis (2H)Given Bitcoin's rapid movement near previous highs, along with quick pump-and-dump action and liquidity grabs, it's expected that the liquidity pool below the price will be swept, collecting orders from the green zone, and then price may reverse back to the upside.
A 4-Hour candle closing below the invalidation level will invalidate this analysis.
For risk management, please don't forget stop loss and capital management
Comment if you have any questions
Thank You

That's where the $BTC 2017 vibes are felt!As we mentioned before, the current cycle that Bitcoin is in is exact

BTC - Will BTC revisit $102k or is a pump imminent?Bitcoin (BTC) has been in a consolidation phase for an extended period, marked by a lack of strong directional momentum and characterized by ranging price action. This type of market environment often leads to both liquidity grabs and choppy movement, and traders need to remain especially vigilant about key levels and structure shifts.
Liquidity grab
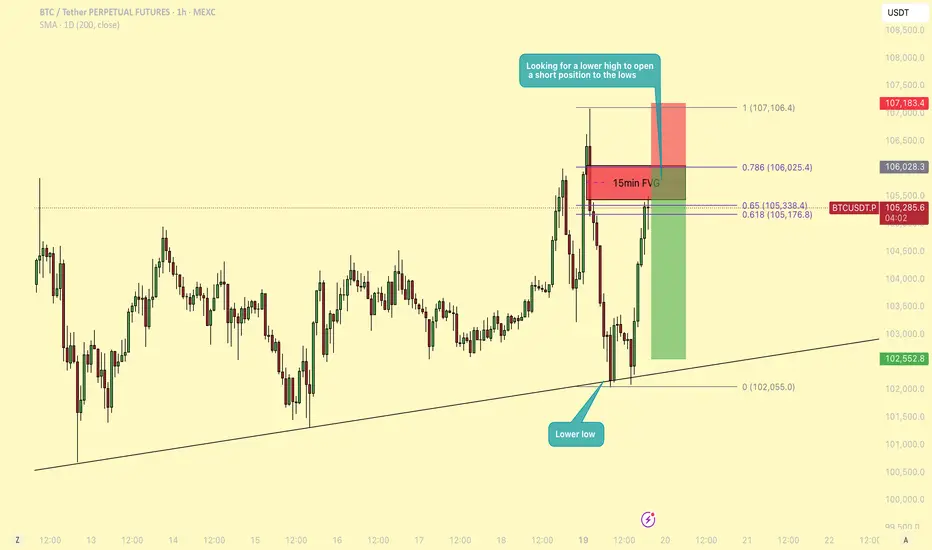
Yesterday, BTC managed to sweep the recent highs, grabbing liquidity above a short-term resistance zone before reversing and moving lower. This move appears to have been a classic stop-hunt or liquidity sweep, which was followed by a strong rejection. As price moved down from those highs, it left behind an unfilled gap on the 15-minute chart, what many refer to as a Fair Value Gap (FVG). This gap now acts as a magnet for price and is a key area to watch as we approach it again.
Market structure
On the 1-hour timeframe, BTC has now printed a lower low, suggesting a short-term shift in market structure to the downside. This structural break opens up the possibility for a lower high to form, setting up a classic trend continuation scenario. From a technical standpoint, the expectation would be for BTC to now create a lower high and then push lower, potentially targeting the range lows from yesterday and today. This provides an opportunity for a short setup with a favorable risk-to-reward (RR) ratio, estimated to be around 3:1, if the entry and stop are managed around the key resistance and structural levels.
Fibonaccy that aligns with the FVG
Currently, BTC is sitting at the Golden Pocket, the region between the 0.618 and 0.65 Fibonacci retracement levels. This area often serves as a reaction zone for price, and we are seeing some hesitation here. Interestingly, this Golden Pocket sits just below the aforementioned 15-minute FVG, and price appears to be gravitating toward this inefficiency, potentially looking to fill it before making a more decisive move.
What adds to the confluence at this level is the 0.786 Fibonacci retracement, which aligns almost perfectly with the top boundary of the Fair Value Gap. While many traders look to enter short positions at the 50% mark of the FVG, this added confluence makes the 0.786 + FVG top zone a more compelling entry point. This would allow for a tighter stop just above the gap or structure high, and thus improves the risk-to-reward ratio slightly compared to a more conservative FVG entry.
Conclusion
In summary, the plan would be to wait for BTC to either fill the FVG and reach the 0.786 level or show strong rejection signs there. A rejection from this zone would confirm the lower high thesis and offer a solid short setup aiming for a move back to the range low. With the current setup, market structure, and confluence levels lining up, this trade idea presents a tactical opportunity with clear invalidation and high RR potential.

Can BTC touch 110k today?Well if it closes 107.1k then stances change, as of now, 102.5k is what it looks delicious as per chart drawn ~~ Thank you!!

Altcoins: Bitcoin Daily Turns Bullish, New All-Time High But...New All-Time High but how high? How high is Bitcoin set to move in this breakout as a the new All-Time High? How high is Bitcoin set to continue in May that still has 12 days left and what about June and July 2025?
What happens after June-July 2025 and what happens in late 2025?
What's the map? How high comments section below—yes?!
Bitcoin is now challenging the "final resistance." This is truly the final resistance because we are in the 2025 bull market. There are many things happening around this final resistance. For example, the Altcoins market.
The Altcoins market goes bullish when Bitcoin grows above 100K yes? Yes it did/does and has been growing for an entire month many pairs are up 70% to 100% some are up 400% and this is only the start but, think of this... What happens when Bitcoin hits a new All-Time High?
For Bitcoin this isn't much, the ATH is at $109,588 and a new All-Time High is $110,000 but what about the Altcoin? Magic!
When Bitcoin hits a new ATH it goes on all media all screens and nobody can deny it is happening because it is happening and the market is full green. This creates boom, interest and many people trade only when resistance breaks. The Altcoins will boom growing 2-3 levels up within days. The bottom forever gone massive profits, lives changing and this is only the start.
The first level of importance as Bitcoin moves in price discovery eventuality and territory and market conditions—change, grow, win—sits around $120,000 and $130,000. This is the level to watch for.
Some people are saying a massive correction at this point more like a normal correction or maybe nothing for a few reasons that I will explain below.
The next range is $150,000 and $160,000 and here is the thing. If Bitcoin is going to $180,000-$220,000, then the correction cannot happen at 120/130K. It needs to happen on the second level around 150/160K, do you understand?
If the strong mid bull market correction happens at $120,000-$130,000 this is bad news because the final market cycle top gets lowered. If it happens later we have $180,000, $200,000, $220,000 or more. And this is the interesting part and what we want.
We are still in May month #5 and the minimum we can expect growth is until November month #11 which gives us 6 months. 6 months of straight up is a very long time. With a 2-3 months correction now it isn't that long.
These are the things that we need to consider but aim high because Bitcoin will always surprise.
Minimum, you can aim for $180,000 as the cycle top—minimum. Go higher leave a comment and with the excitement, euphoria and the first time since 2021 seeing so much growth, institutional adoption, Trump, Saylor, El Salvador think $220,000 can you see how that works? Comment below.
Things are bright for Cryptocurrency holders know why now think in this way. Your life can change forever if you take the right action following the right steps in the next 6 months. Imagine a lifetime of profits secured in this bull market bull run. The choice is yours.
It can happen of course, it has happened many times and will continue to happen but we have to be smart. It is happening now but we are early this time we have experience and we know exactly what will happen. It is not a question of if but when. When? In late 2025.
Thank you for reading.
Your comments show your continued support and helps activate the bots to do the same. Show them some love!
Namaste.
