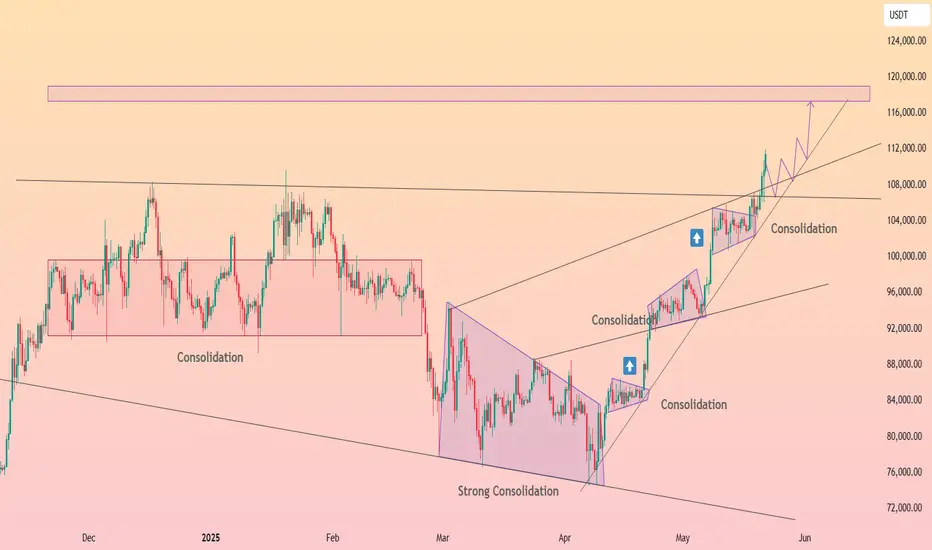
HolderStat┆BTCUSD has reached a new peakCRYPTOCAP:BTC has stair-stepped from 75 k to 110 k inside a steeply guided channel, carving neat consolidation bricks at every leg. A fresh box rests over 102 k support; defend that and the rising wedge projects toward the long-watched 118-120 k new-ATH zone. Break the inner rail and a glide to 96-97 k tests the mid-channel without derailing the dominant ascent.
Btc!
KASPA CUP AND HANDLE (TA+TRADE PLAN)Cup and Handle pattern clearly formed with rounded bottom and emerging handle.
This is a strong bullish continuation pattern suggesting a potential breakout once the handle completes.
The neckline resistance is approximately at $0.12, and a breakout above this could trigger a strong upward move.
Support & Resistance Zones (S/R)
Current Price: $0.10895
Major Resistance Levels:
$0.12 (neckline)
$0.14
$0.16
$0.19 (pattern target)
Major Support Levels:
$0.10
$0.085
$0.065
Volume Analysis
Volume increased during the formation of the right side of the cup – a bullish signal.
Volume has decreased slightly during handle formation, which is expected.
Indicators
RSI (14): 52.89 – Neutral zone. Not overbought or oversold. Room for upward movement.
Stochastic (14, 3, 1): 27.76 – Close to oversold; potential bullish crossover incoming.
Money Flow Index (MFI): 62 – Healthy inflow of money, not overbought yet.
Wave Momentum/Cipher B: Shows bullish divergences and momentum building from recent lows.
Price Target (Pattern Projection)
Cup depth: ~$0.12 - $0.06 = $0.06
Breakout target: $0.12 + $0.06 = $0.18–0.19 zone
📈 Trading Plan – KASPA/USDT
Strategy: Cup and Handle Breakout
Entry
Aggressive Entry: Buy near current price ($0.108–$0.11) if expecting early breakout.
Conservative Entry: Buy on confirmed breakout above $0.12 with strong volume (daily close).
Stop-Loss
Place SL below handle low, approx. $0.096–$0.098 (depending on risk tolerance).
Alternative: wider SL below $0.085 support if aiming for longer-term hold.
Take Profit Levels
TP1: $0.14
TP2: $0.16
TP3: $0.19 (pattern target)
Use laddered take-profits for partial exits at each level.
Risk Management
Risk per trade: 1–2% of capital
Use position sizing calculator to adjust size based on SL distance
🔄 Re-entry Plan
If breakout fails, monitor $0.085–0.095 zone for support and potential re-entry on double-bottom or bull flag.
⚠️ Bearish Scenario
Breakdown below $0.085 invalidates cup and handle.
Next support at $0.065.
Reassess structure and macro sentiment.

ADA/USDT: Bullish Move Ahead ? (READ THE CAPTION)By examining the #Cardano chart on the 3-day timeframe, we can see that the price is currently trading around $0.80. If it holds above $0.71, we can expect more upside. The expected return for Cardano is around 30% in the short term, 47% in the medium term, and 85% in the long term.
Please support me with your likes and comments to motivate me to share more analysis with you and share your opinion about the possible trend of this chart with me !
Best Regards , Arman Shaban

BTCUSDT – Mild Pullback, Support Holds FirmBTCUSDT remains in a clear uptrend with a structure of higher highs and higher lows, after breaking out of a prolonged consolidation pattern since early May.
The price has surged from the 106,000 resistance zone and approached the technical target around 112,000 – an area that is currently triggering a slight pullback.
At the moment, the support zone around 106,700–107,800 aligns with a demand area and the EMA34, likely serving as a springboard for the next upward move.
If BTC continues to consolidate around this zone without breaking below 106,700, the 112,000 level could be breached, paving the way for a move toward higher targets.

Where' s BTC heading to?#bitcoin price did well in May. It was spot buying with good volume, that was positive. I' ve been observing some issues on #btc chart.
CRYPTOCAP:BTC has been moving in an ascending channel, breaking down these channels results with heavy correction. (As CRYPTOCAP:ETH broke a long time ascending channel and dumped heavily months ago) . Plus, There have been a bearish divergence whilst #btcusd moving upside for weeks. I showed the divergence on the chart. 113 - 114K is the very important resistance point for btc price. A hard declination there will result a heavy but healthy correction.
Above 115K with weekly closes are the invalidation. Not financial advice.

ETH 10 000$ soonAs for me, the fractial is the same)
Flashcrash in the preles of accumulation, the same good fast V-shaped reversal. BTC made 1.6 and 2 fib level, if copy paste it on ETH, it could be 10k$ easily. The dominance on the TOP, ETH/BTC on historical bottom. The cyclicality of the cryptocurrency market persists.
I would like to see June growth, going sideways at higher values closer to August. And starting in the fall to make the final movement.

BITCOIN is attempting to converge with past Cycles!Bitcoin (BTCUSD) is experiencing the weakest Bull Cycle in its history, a natural product of the Theory of Diminishing Returns (TDM).
This chart couldn't have put it better as we show all Cycles since BTC's first day, one on top of the other. Naturally the first Cycles were the most aggressive, witnessing extraordinary gains as the upside potential of a fresh market was enormous in its early days.
The 2015 - 2017 (blue trend-line) and 2019 - 2021 (black trend-line) Bull Cycles have been harmonized to a more traditional capital market state and this is obvious on their trend-lines, which exhibit similar parallel price action. Whenever the two diverged, they converged at some point during the Cycle.
The current Cycle (2023 - 2025) following the late February 2025 divergence, is now attempting to converge again with its strong rebound in the past 6 weeks. Being however within a Channel Up throughout the entirety of the Cycle, it appears that it will do so in a structured way and as the TDM suggests, will offer weaker gains.
What we can project, as we've shown on previous studies in great detail, is the timing of the Cycle Top. Based on past Cycles, it should be within October - December 2025. Timing your exit strategy can perhaps be more effective than assigning a certain Target, even though the peak is expected to be anywhere within the $150k - $200k range.
So do you agree that the rise we're witnessing is the Cycle's attempt to converge with past ones and close the gap before it tops? Feel free to let us know in the comments section below!
-------------------------------------------------------------------------------
** Please LIKE 👍, FOLLOW ✅, SHARE 🙌 and COMMENT ✍ if you enjoy this idea! Also share your ideas and charts in the comments section below! This is best way to keep it relevant, support us, keep the content here free and allow the idea to reach as many people as possible. **
-------------------------------------------------------------------------------
💸💸💸💸💸💸
👇 👇 👇 👇 👇 👇

XLMUSDT → Consolidation above 0.300 will provide an opportunityBINANCE:XLMUSDT.P is returning to the buying zone relative to strong resistance as part of a local uptrend. The market backdrop is favorable, but Bitcoin poses risks...
Bitcoin is updating its historical high and continuing its bullish trend, which is a favorable backdrop for altcoin growth. However, risks are posed by the fact that BTC may form a false breakout of resistance, which would trigger a correction across the entire market.
XLMUSDT is returning to the buying zone relative to strong resistance as part of a local uptrend.
If the bulls hold their ground above 0.3000, growth may continue in the short and medium term.
Resistance levels: 0.318, 0.324
Support levels: 0.300, 0.2975, 0.2799
The focus is on 0.3000, which is a fairly important and key (psychological) level. If the bulls manage to hold their ground above this point, the price will continue to rise, but it is necessary to monitor the behavior of the bitcoin.
Best regards, R. Linda!

ETH/USDT – Breaking Out After BTC!🚀 Hey Traders! 👋
If you’re finding value in this analysis, smash that 👍 and hit Follow for high-accuracy trade setups that actually deliver! 💹🔥
After BTC’s rally, it’s ETH’s turn to shine! 🔥
Ethereum has officially broken out of the descending channel on the 12H timeframe, a structure that’s been holding price down since late 2024. This breakout is significant — and here’s why:
📊 Technical Breakdown:
🔸 Broadening wedge finally broken after months of compression
🔸 Price holding well above the EMA, confirming short-term bullish momentum
🔸 Strong volume on breakout candle, suggesting genuine buying pressure
🔸 Breakout coincides with BTC’s surge — signaling altcoin rotation could be starting
📍 Key Levels:
➡️ Immediate Resistance: $2,850
➡️ Short Term Target Zone: $3,200–$3,500
➡️ Major Target Zone: $5000
➡️ Support to Watch: $2,480 (EMA + breakout retest)
💡 Why It Matters:
This move isn’t just technical — it’s psychological. ETH has been lagging BTC for weeks, and this breakout could shift trader sentiment back toward altcoins. If ETH holds above the breakout zone, we may see altcoins gain serious traction in the coming days.
📌 Strategy Note:
Look for a successful retest of the breakout zone for confirmation. A strong daily close above $2,700 could pave the way for a sustained uptrend.
What’s your ETH price prediction? Drop it in the comments and let’s ride this momentum together! 💥

BTC: New All-Time High, What's Next?#Bitcoin reached a new ATH this week, confirming the early April low as a key bottom. With no resistance above, the sky is the limit. But breaking $102K could signal a correction, and $74.5K would mark a major trend shift.
Still, the risk/reward for buying BTC now is poor. Based on past cycles, altcoins usually shine after BTC tops due to capital rotation. So, now is the time to focus on strong altcoins with real activity.

Next Target: Right Fibonacci Ratio 2.24 (116940.43)
Hello, traders.
If you "Follow" me, you will always get the latest information quickly.
Have a nice day today.
-------------------------------------
(BTCUSDT 1D chart)
It was supported near the Fibonacci ratio 2 (106178.85) and rose to renew the new high (ATH).
If this upward trend continues, it is expected to rise near the Fibonacci ratio 2.24 (116940.43).
-
If it falls,
1st: 102302.08
2nd: 97226.92
3rd: 89294.25
You need to check which of the 1st and 3rd areas above is supported.
Since the M-Signal indicator on the 1D chart is passing near the 1st area, if it falls below this, there is a possibility that it will turn into a short-term downtrend.
The M-Signal indicator on the 1W chart is still rising around 94K, but since the 97226.92 point is the HA-High indicator point on the 1W chart, I think it is likely to continue the upward trend if it receives support around this area.
The 89294.25 point is the HA-Low indicator point on the 1D chart, so if it receives support around this area, it is a good time to buy.
-
(30M chart)
If the price continues to rise by renewing the ATH, it is difficult to set support and resistance points.
Therefore, you need to be careful when trading coins (tokens) that are renewing the ATH.
Therefore, I think it is better to trade in a short-term trading (day trading) method, but to leave the number of coins (tokens) corresponding to the profit for the profit realization method.
In other words, when the price rises and then falls by the purchase price, the method is to sell only the purchase amount (+ transaction fee) to leave the coin (token) corresponding to the profit.
When selling, you should not sell the number of coins (tokens), but you should sell only the purchase amount.
You do not necessarily have to sell all of the purchase amount, but if possible, it is better to sell close to the purchase amount.
The reason is that when the price plummets or turns downward, there is a possibility of psychological pressure.
In my chart, the trading strategy is when the HA-Low and HA-High indicators are touched.
If it is supported near the HA-Low indicator, it is the time to buy, and when it meets the HA-High indicator, it is the time to sell.
However, if it is supported near the HA-High indicator, there is a possibility that a stepwise upward trend will continue, so a split selling strategy is necessary.
On the other hand, if it falls after receiving resistance from the HA-Low indicator, it is likely to show a stepwise downtrend, so a split buying strategy is needed.
-
When you meet the HA-Low and HA-High indicators, if you check the movement of the OBV indicator, it can help you create a trading strategy.
That is, when the OBV indicator breaks upwards through the Low Line, High Line, and OBV EMA, the price is likely to rise, and if the opposite happens, the price is likely to fall.
-
Thank you for reading to the end.
I hope you have a successful trade.
--------------------------------------------------
- This is an explanation of the big picture.
(3-year bull market, 1-year bear market pattern)
I will explain more details when the bear market starts.
------------------------------------------------------

Bitcoins LinesPrice is approaching previous highs with strong bullish momentum and no major resistance until the red-marked level around 240,000. Given the breakout structure and Fibonacci confluence, the most likely scenario is continuation toward the 140,000–160,000 range before facing any significant rejection. A stop loss would be prudent just below 91,000, with the initial target set at 139,000, and extended TP zones at 155,000 and 239,000. This trade aligns with a longer-term macro trend.

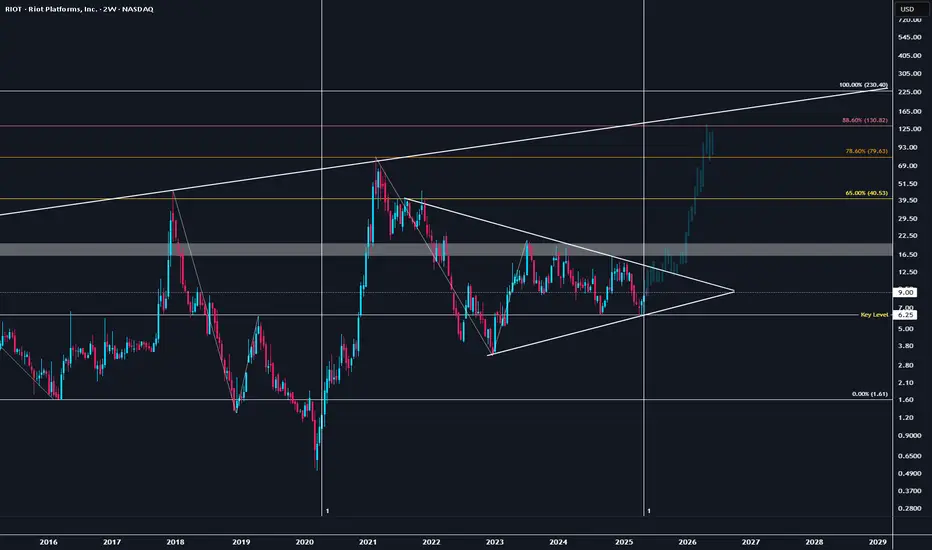
RIOT: The Sleeper Trade to $130📈 RIOT to $130? The Bull Case Is Heating Up
RIOT Platforms is primed for a major breakout — multi-year triangle compression on the weekly, identical to its 2020 setup before a 35x move. We’re now approaching the 1:1 time Fib window (2021 top → 2022 bottom → 2023 echo high), the same cycle structure that triggered the last parabolic rally.
BTC at $111K, eyeing $160K. History says miners lag then explode. RIOT gained 35x in the last BTC breakout — this cycle could easily echo that with a $130 target (0.886, last cycle price hit the 0.786, prior to that, the 0.65 so the logical next target is the 0.886
Fundamentals are locked in:
⚡️ Hash rate: 33.7 EH/s
🧱 Producing 500+ BTC/month
🧮 Cost per BTC: ~$44K → profit margins >70% at $160K BTC
💰 Treasury: 19,000+ BTC (~$2B)
🏭 New Corsicana site online, scalable beyond 35 EH/s
Sentiment setup is explosive:
🔥 High short interest = squeeze fuel
🔁 Chart reclaiming macro trendline + coiled tight
🧠 Retail and institutional flows rotating into miners
Cycle symmetry. BTC tailwind. High-beta name with short squeeze potential. Riot’s $130 move is technically, fundamentally, and psychologically primed.
#RIOT #Bitcoin #BTC #CryptoMiners #Breakout #Compression #BullRun
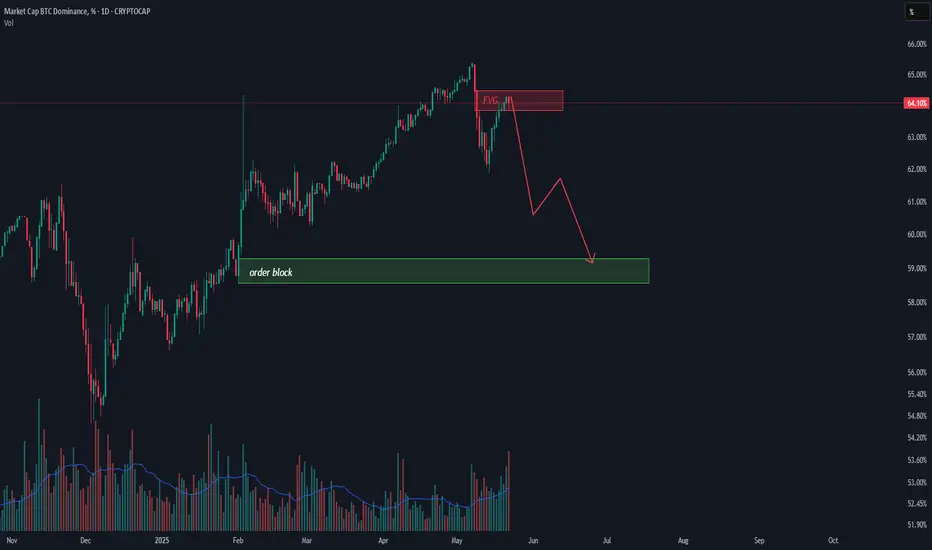
BTC dominance next move (maybe) looking at this BTC Dominance chart, we’re currently sitting around 64.13%, and price just tapped into that red zone marked as “FVG” — that’s a fair value gap, basically an area where price moved too fast before and didn’t fill orders properly as you see this is my take on BTC Dominance and i think its going to the order block that its around 58%
this is just my take, not financial advice. No one can predict the crypto market with certainty. It's wild and full of surprises, so always do your own research and stay sharp.
BTC traffic update and channel exit.As we can see, the BTC price is moving according to the previously mentioned rules. Here we can see how the price left channel number 1 at the top, and the increase after leaving the channel gave an upward movement at the level of the height of the channel itself.
In this situation, it is worth paying attention to channel number 2, from which we also previously got an exit at the top with a strong upward movement, currently we can see how the price is fighting with strong resistance at the level of $ 111,500, however, taking into account the height of channel number 2, we can mark the level of around $ 121,500 as another very strong resistance.

BTC hits ATH – But this hidden signal could ruin the rally!Bitcoin (BTC) has been in a steady and impressive uptrend over the past two months, with nearly seven consecutive weekly green candles forming on the chart. This sustained bullish momentum signals strong buying pressure and growing confidence among market participants. Such a consistent rally is rare and often indicates a broader shift in sentiment, suggesting that Bitcoin may be entering a new phase in its market cycle.
Price discovery
Recently, BTC broke through its previous all-time high (ATH) of 110K on the lower timeframes, a significant technical development. This breakout means BTC is now trading in price discovery territory, where there is no historical resistance to guide price action. While this opens the door for further gains, traders should remain cautious. Upcoming daily and weekly candle closes will be critical in determining whether this breakout is sustainable. For the move to be confirmed, Bitcoin needs to close multiple weekly candles above the previous ATH. If instead, the price falls back below the ATH on either this weekly close or the next, it could introduce downward pressure and potentially signal a failed breakout.
As we navigate this pivotal moment, it's crucial not to get swept up in the euphoria. While the price action is undoubtedly bullish, certain technical indicators warrant close monitoring to avoid complacency. In particular, the weekly Stochastic RSI and the weekly RSI are now at levels that deserve attention.
Stochastic RSI
The weekly Stochastic RSI is entering overbought territory, even before this week’s candle has closed. This suggests strong bullish momentum is currently driving the market. However, history shows that when the Stochastic RSI enters the overbought zone, it often marks areas where it was wise to take partial profits. If the blue and orange lines on the Stochastic RSI begin to cross back below the 80 level, it could indicate a weakening of momentum and the possibility of a short-term correction. That scenario becomes more likely if Bitcoin fails to continue making higher highs in the weeks ahead.
Relative Strenght Index (RSI)
Meanwhile, the Relative Strength Index (RSI) is approaching a critical resistance trendline. In previous market highs, we’ve seen the RSI top out at 89, followed by a high of 80 despite new highs in BTC’s price, a classic case of bearish divergence. If Bitcoin fails to push significantly higher in the coming weeks and the RSI does not break above the 80 level, we could be looking at a potential triple bearish divergence. This would be a strong warning signal that momentum is waning, and it could lead to a broader correction.
For this reason, it is crucial that Bitcoin continues to push upward with conviction. The RSI must break through its historical trendline and post a new high above 80 in order to invalidate the threat of bearish divergence. Should the market fail to do so and instead roll over, we may experience increased volatility and downside pressure as we move into the summer months.
Conclusion
In conclusion, while Bitcoin is exhibiting powerful bullish behavior and appears poised for further gains, the sustainability of this rally hinges on continued momentum and strong technical follow-through. Specifically, Bitcoin must maintain closes above its previous all-time high, avoid a bearish cross on the Stochastic RSI, and see the RSI break above its recent highs to neutralize the threat of bearish divergence. If these conditions are not met and momentum fades, the market may face a period of consolidation or correction in the near term. Staying vigilant and objectively monitoring these indicators will be essential for navigating what comes next.
Thanks for your support.
- Make sure to follow me so you don't miss out on the next analysis!
- Drop a like and leave a comment!

BTC is high! Any Weakness?If you find this information inspiring/helpful, please consider a boost and follow! Any questions or comments, please leave a comment!
Bitcoin Breaks to All-Time Highs — What’s Next for Price Structure?
Bitcoin has officially pushed into new all-time highs, and while the move wasn’t entirely unexpected, it still packs a punch. We discussed this possibility in recent videos, though I wasn’t fully convinced at the time. That’s the nature of trading—uncertainty is the cost of admission, and conviction builds as structure confirms.
As always, I was watching the price action closely. BTC started providing the clues needed to lean into the more bullish interpretation. The levels held. The flips were clean. Momentum lined up.
That said, I did take some speculative shorts at lower degrees—not to fight the trend, but to respect possible overextensions within the count. For those following the Elliott Wave roadmap, these intraday reactions were worth probing, but nothing confirmed a larger reversal yet.
The key now is structure.
We’re currently navigating uncharted territory, and in these zones, understanding wave context and market behavior around prior resistance becomes even more critical. There’s no overhead supply—only psychology, fib projections and profit-taking to watch for.
Here’s what I’m focused on:
Clear labeling of the motive sequence—is this the end of a Wave 3 or just a smaller subdivision?
Volume behavior and momentum divergence—looking for any signals that we’re near exhaustion.
Pullback zones—marking areas where Wave 4 or consolidation might emerge, if it’s due.
This is a time to stay sharp, not euphoric.
Trade safe, trade smart, trade clarity.

IBITUSDT | Volume Speaks FirstRight now, IBITUSDT is showing more volume than even Binance’s pair . That alone tells me where the real activity is — and this is the chart I’ll be tracking .
I’m not interested in premature entries. I’ll be watching below the green line for potential setups , but only with clear confirmation on lower timeframes.
“I will not insist on my short idea. If the levels suddenly break upwards and do not give a downward break in the low time frame, I will not evaluate it. If they break upwards with volume and give a retest, I will look long.”
Most traders follow the noise. I follow the volume. That’s how I stay accurate.
📌I keep my charts clean and simple because I believe clarity leads to better decisions.
📌My approach is built on years of experience and a solid track record. I don’t claim to know it all but I’m confident in my ability to spot high-probability setups.
📌If you would like to learn how to use the heatmap, cumulative volume delta and volume footprint techniques that I use below to determine very accurate demand regions, you can send me a private message. I help anyone who wants it completely free of charge.
🔑I have a long list of my proven technique below:
🎯 ZENUSDT.P: Patience & Profitability | %230 Reaction from the Sniper Entry
🐶 DOGEUSDT.P: Next Move
🎨 RENDERUSDT.P: Opportunity of the Month
💎 ETHUSDT.P: Where to Retrace
🟢 BNBUSDT.P: Potential Surge
📊 BTC Dominance: Reaction Zone
🌊 WAVESUSDT.P: Demand Zone Potential
🟣 UNIUSDT.P: Long-Term Trade
🔵 XRPUSDT.P: Entry Zones
🔗 LINKUSDT.P: Follow The River
📈 BTCUSDT.P: Two Key Demand Zones
🟩 POLUSDT: Bullish Momentum
🌟 PENDLEUSDT.P: Where Opportunity Meets Precision
🔥 BTCUSDT.P: Liquidation of Highly Leveraged Longs
🌊 SOLUSDT.P: SOL's Dip - Your Opportunity
🐸 1000PEPEUSDT.P: Prime Bounce Zone Unlocked
🚀 ETHUSDT.P: Set to Explode - Don't Miss This Game Changer
🤖 IQUSDT: Smart Plan
⚡️ PONDUSDT: A Trade Not Taken Is Better Than a Losing One
💼 STMXUSDT: 2 Buying Areas
🐢 TURBOUSDT: Buy Zones and Buyer Presence
🌍 ICPUSDT.P: Massive Upside Potential | Check the Trade Update For Seeing Results
🟠 IDEXUSDT: Spot Buy Area | %26 Profit if You Trade with MSB
📌 USUALUSDT: Buyers Are Active + %70 Profit in Total
🌟 FORTHUSDT: Sniper Entry +%26 Reaction
🐳 QKCUSDT: Sniper Entry +%57 Reaction
📊 BTC.D: Retest of Key Area Highly Likely
📊 XNOUSDT %80 Reaction with a Simple Blue Box!
📊 BELUSDT Amazing %120 Reaction!
📊 Simple Red Box, Extraordinary Results
I stopped adding to the list because it's kinda tiring to add 5-10 charts in every move but you can check my profile and see that it goes on..

BTC - Why THIS TIME is DIFFERENT (⊙ˍ⊙)This time IS DIFFERENT. Bitcoin has made a new ATH as I predicted in a few previous posts, but something's off...🤔
If we look at BTC from a macro view, the dates for this run up was quite extended. We do see some similarities in terms of the retracement (highlighted in blue) but from a timeframe analysis, there is no comparing this high to the previous:
stretching from March to October where classical bear market symptoms were show - lower highs and lower lows, with a duration unlike any of the previous cycles.
Interestingly, the previous season we increased not even 7% from the previous peak. And if we were to look at the same fractal, that places us around $116k.
But the ONE thing, that has had me suspicious this entire time (🥁) was ETH. Overlaying the ETH chart, we see that historically, ETH peaked a week or two after the BTC ATH - until this time.
The fact that BTC made such a dramatic ATH and Ethereum didn't? That was a new one. And even up to now, ETH is still 80% away only from it's previous ATH - imagine the altseason we will have IF ETH makes a new ATH... or will this time just be , different ?

BTC - New Impulse Soon!Hello TradingView Family / Fellow Traders. This is Richard, also known as theSignalyst.
📈 BTC has been bullish, trading within the rising channel marked in orange. 🟧
In a typical trend, corrections are usually bearish. 🔻
However, in BTC’s case, the correction phases marked in red are flat — a strong signal that the bulls are in control 💪 and not allowing the bears to trigger a classic pullback.
As long as BTC holds within the rising orange channel, we expect the next impulse phase to kick off soon 🚀 — aiming for the $115,000 round number. 🎯
This move will be confirmed once BTC breaks above the current flat correction zone marked in red. ✅
📚 Always follow your trading plan regarding entry, risk management, and trade management.
Good luck!
All Strategies Are Good; If Managed Properly!
~Rich

Bitcoin may break support level and fall to support lineHello traders, I want share with you my opinion about Bitcoin. In this chart, we can see how the price a few moments ago declined, but then turned around and started to grow inside an upward wedge. Price at once rebounded from the support line of the wedge and made an upward impulse to the support level, which coincided with the buyer zone, after which it broke it and made a retest. Then BTC rose to the resistance line, after which it corrected to the 100900 support level and then started to slowly grow in the wedge. Some time later, Bitcoin rose to the current support level, which coincided with the support area and even climbed a little higher to the resistance line of the wedge, but soon dropped to the support line. Next, price turned around and made an upward impulse from this line, breaking the 105800 level, and at once made a retest. After this movement, BTC continued to grow and reached the resistance line of the wedge, but recently it rolled down, so now I expect that the price can rise a little. After this movement, in my opinion, BTC can drop to the support line of the wedge, breaking the current support level. Therefore, I set my TP at this line - 104200 points. Please share this idea with your friends and click Boost 🚀

Bitcoin: 106K Breakout To 113K Resistance.Bitcoin is attempting to break out of a minor consolidation which is a typical momentum continuation pattern. The updated wave count illustrates the potential (113K area) IF this breakout follows through over the coming week. While the structure is clearly bullish, I suspect this is a 5th of a 5th wave relative to the wave structure dating back to the 2017 peak (weekly chart). For traders this offers plenty of opportunities particularly on the long side, BUT for investors this means the higher it goes, the GREATER the risk. In other words, a break out to new highs should be considered an opportunity to take profits or reduce risk. Wave 5's typically appear to be the "best" time to get involved in a market, but offer the LEAST potential and the greatest risk.
I was not able to write my analysis over the previous week because I was hosting the ICTC 2025 (link in signature). My analysis the week before that was still bullish but I was anticipating a broader retrace which never materialized. Again the key in this game is ADJUSTING, not getting stuck on opinions. IF the 106K is compromised, and the daily candle closes strong, the breakout is more likely to follow through. This can lead price back to the 109K all time high. Since Wave 5's typically go higher than the Wave 3 peak, the next price objective is the 113K area which is proportional to Wave 1 on this impulse (similar length) when projected from the consolidation breakout (see illustration).
It is possible that Wave 5 can extend further, because the broader price structure is bullish. The mistake to avoid is thinking "it's just getting started". The further it goes, the greater the risk. Longer term investors are MOST vulnerable in situations like this because they are more likely to follow the "hype" that surrounds such moves while be completely ignorant to the shrinking shorter term potential. Wave 5's often characterize the idea that the majority of participants who were going to buy have bought, which means there will be much less potential demand in the near future.
This concept is NOT to be confused with long term fundamentals which often don't change. What changes is the sentiment and sentiment is what motivates price. The recent corrective move to the 76K low also illustrates this phenomenon. Fundamentally there was no reason for price to be pushing such lows. Such a move was provoked by the "perceived" risks brought on by the tariff drama which we know now was nothing more than a knee jerk reaction and an enormous buying opportunity for those who have the ability to see through the hype (read my analysis of that time).
In my opinion the best way to navigate this market is on smaller time frames. Anywhere from 1 minute to 4H offers more precise price references to mitigate risk from. Another consideration is if you plan to trade the broader time frame, use smaller than usual sizing if you plan to dollar cost average into higher prices. The trend is clearly BULLISH which means support levels are more likely to hold while resistances are likely to break. Expect more from longs and LESS from shorts. Short setups, while tempting are going to be lower probability. This should only be done by more experienced traders who understand how to manage the elevated risk. This is the mindset I will maintain UNTIL the market proves otherwise.
Thank you for considering my analysis and perspective.

BTCUSDTBTCUSDT is expected to have a chance to test the 112,678 level. If the price fails to break through this level, a correction is expected and the price is likely to fall.
🔥Trading futures, forex, CFDs and stocks carries a risk of loss.
Please consider carefully whether such trading is suitable for you.
>>GooD Luck 😊
❤️ Like and subscribe to never miss a new idea!
